- yuxip's home page
- Posts
- 2015
- 2014
- December (2)
- November (1)
- October (2)
- September (6)
- August (2)
- July (1)
- June (3)
- May (4)
- April (1)
- March (2)
- 2013
- December (1)
- November (1)
- October (3)
- September (3)
- August (2)
- July (1)
- June (2)
- May (1)
- April (3)
- March (1)
- February (1)
- January (1)
- 2012
- 2011
- My blog
- Post new blog entry
- All blogs
FMS meeting 05/05/2014 --further comparisons between Mriganka/Yuxi' jets. Hot tower lists
With updated selections criteria and FMS hot tower list I've made some more comparisons between the EM jets produced by
Mriganka's code and those produced by mine. This is blog is to document some of the final tunnings and to support the use
of a new hot tower list/masking scheme.
I'll just follow a chronological order to show how different changes came about.
Remove fiducial area cut for EM jets
In the prevous FMS meeting we agreed that a fiducial area cut is not necessary for EM jet studies as oppose to inclusive pi0
analysis. So I've remove this cut in the jet comparisons. The rest of the cut are the same as described in my previous post.
In addition, I took the updated hot tower list from Mriganka which was used for his DIS talk. According to Mriganka the new
list was produced in order to tackle the remaining hot region which seemed to persist even after the first round of tower
masking.
with Mriganka's new hot tower list the following shows the jet comparisons.
.gif)
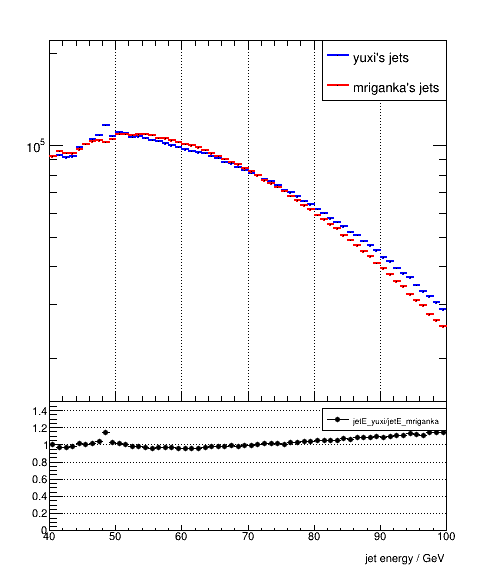
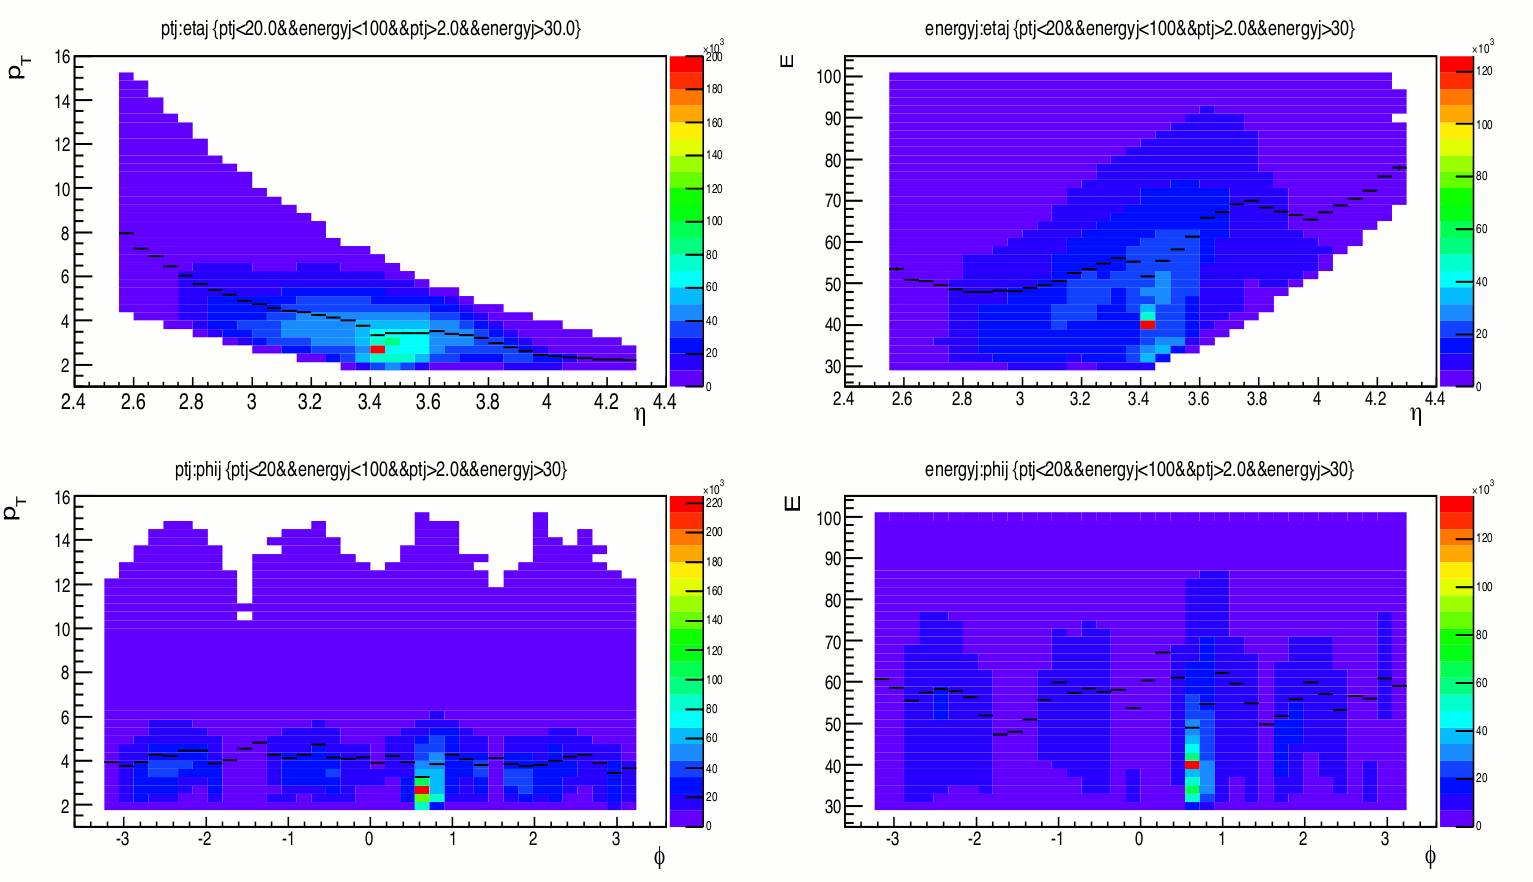
Figure 1 a) jet energy, 2.8 < eta < 4.0 Figure 1 b). jet pT
.gif)
.gif)
Figure 2 a). jet eta, 40 GeV < jetE < 100 GeV Figure 2 b). jet phi, 40 GeV < jetE < 100 GeV
There is a hole in phi at around -1.5 in the jets produced by Mriganka's code. The reason for this hole is still not clear to me. When I run my code with
symmetric shower shapes I didn't see this hole either. (see figure 4 of my previous post). The following 2D plot shows this hole more clearly.
.gif)
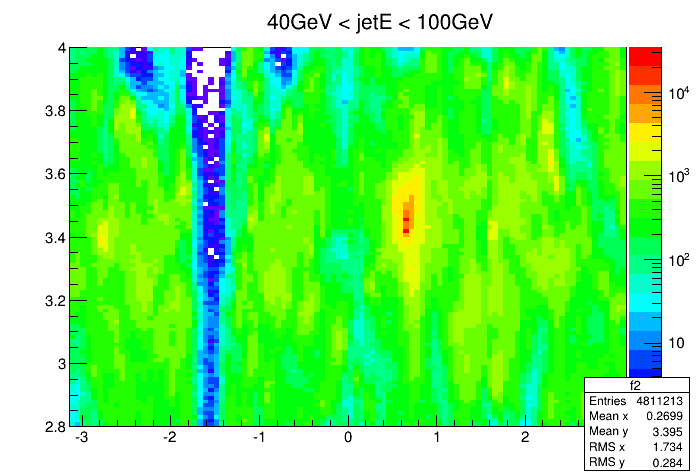
Figure 3 a). Mriganka's jet eta vs phi (nentries = 4811213) Figure 3 b). Yuxi's jet eta vs phi (nentries = 4869775)
This hole was also present in Mriganka's slides (see http://www.star.bnl.gov/protected/spin/mriganka/fmswg/fms-wg-presentation.pdf for example). So the reason
that I saw more jets at high energy and pT is probably due to this hole.
The bump at eta~3.4 and phi~0.8 is due to the insufficient hot tower masking. The hot area persists even after applying Mriganka's hot tower list. So he added an ad-hoc
cut on the phi of photons. The cut range in photon phi is very narrow therefore had different effects in my jets vs in Mriganka's jets, due to different shower shapes we used.
re-produce FMS hot tower list
As I was trying to identify the remaining hot towers I found a possible loophole in our procedure. Both Mriganka and I produced the histogram of hit frequencies using
tower energy before the LED correction. While the correct thing to do is to use LED-corrected hit energy. I have regenerated the hot tower list with a slightly different
procedure. Here is what I did,
1). For each day# (day79 to day98) the are 6 tower lists for 6 energy bins. The energy bins I used are (0,10), (10,40), (40,60), (60,80), (80,100), (100,) GeV, whereas Mriganka had (10,38), (38,42), (40,60), (60,80), (80,100), (100,) GeV
The first bin I used will be modifed to (1,10) GeV since (0,10) just accepts all the towers.
2). the hot towers in each energy bin were identified by a iterative procedure. In each iteration if the hottest tower has more than 10 times the averaged count it is going
to be removed. The average count in each iteration is calcuated over the remaining non-zero towers. The iteration keeps going until none of the towers has more than 10
times of the averaged hits.
Mriganka's method was to remove a fixed amount of hot towers (top25) in a single pass for each of the 6 energy bins. As an example for day98 the number of hot towers
identified and removed by my list is (0,1,8,13,21,15) for the 6 energy bins, whereas in Mriganka's list it is (25,25,25,25,25,25). The following plots show a comparison between
Mriganka's list and mine for the (40,60) GeV energy bin.
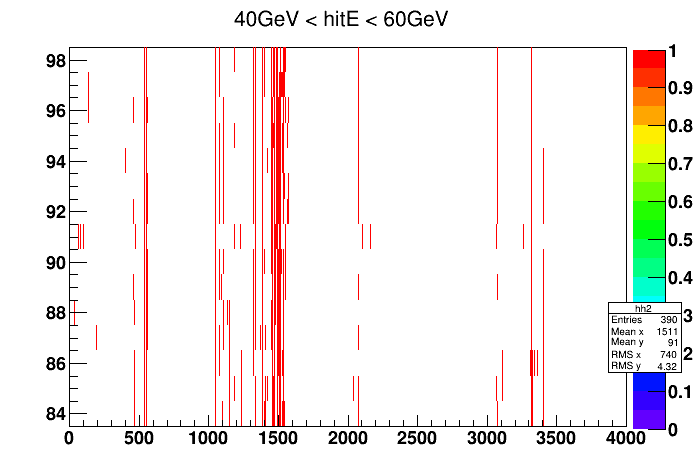
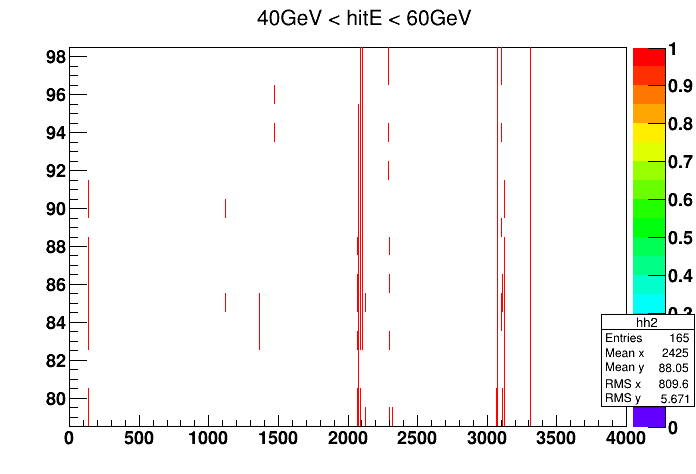
Figure 4 a). Mriganka's hot tower list Figure 4 b). Yuxi's hot tower list
Figure 5 below shows the EM jet eta,phi distribution with my hot tower list. Using the same dataset (Fill15419) as Figure 3.
.gif)
Figure 5, jet eta phi with yuxi's hot tower list (nentries = 4002092)
Figure 6 shows the tower hit frequencies for Fill15419. The energy range is 10 to 100GeV
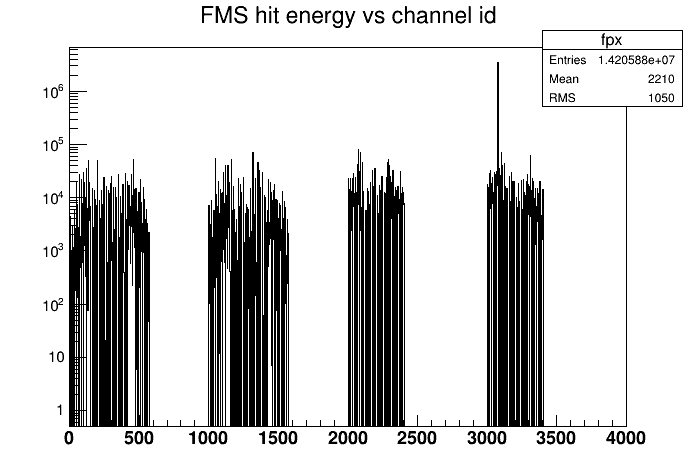

Fig 6 a). tower hit counts vs id, no hot tower masking Fig 6 b). tower hit coutns vs id, with Mriganka's hot tower masking
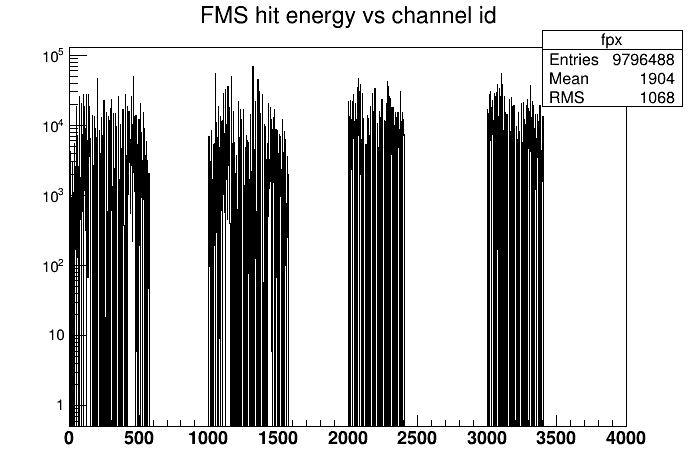
Fig 6 c). tower hit coutns vs id, with Yuxi's hot tower masking
So by masking out less towers the new hot tower list can actually remove the hot problematic region. The log indicates that 88% of the time
it is tower_3077 being masked out
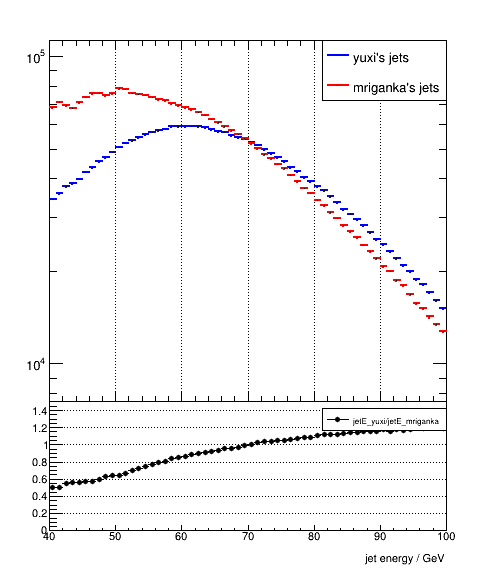
Figure 7 show the comparison with jets from Mriganka's code. All the kinematic cuts are the same as Figure 1.
.gif)
.gif)
.gif)
Figure 7. jets produced by Yuxi's code and the new hot tower list vs those from Mriganka's code with old hot tower list
As a reference Figure 8 was taken from Mriganka's slides showing the problematic region.
So the significant excess below E = 60 GeV is mostly caused by a single hot tower (id_3077).
Next step is to see how the asymmetries change with this hot tower masking scheme. If there is no major issue I am going to start processing the entire Run11
dataset. The hot tower list for Run11 has already been generated.
ref. Mriganka's slides
http://www.star.bnl.gov/protected/spin/mriganka/spinwg/spin-call-03-20-14.pdf
Groups:
- yuxip's blog
- Login or register to post comments