- yuxip's home page
- Posts
- 2015
- 2014
- December (2)
- November (1)
- October (2)
- September (6)
- August (2)
- July (1)
- June (3)
- May (4)
- April (1)
- March (2)
- 2013
- December (1)
- November (1)
- October (3)
- September (3)
- August (2)
- July (1)
- June (2)
- May (1)
- April (3)
- March (1)
- February (1)
- January (1)
- 2012
- 2011
- My blog
- Post new blog entry
- All blogs
FMS Meeting 06/09/2014 --updated method of A_N and signal/bkg. fraction calculations
I have finished producing Run11 FMS pions and EM-jets with the new hot tower list (see my previous post). This time I decided to calculate asymmetries fill-by-fill. Due to the large statistics of pion yield it turned out a single set of signal and background shapes is not sufficient to describe the entire dataset. As can be seen from my previous fits.
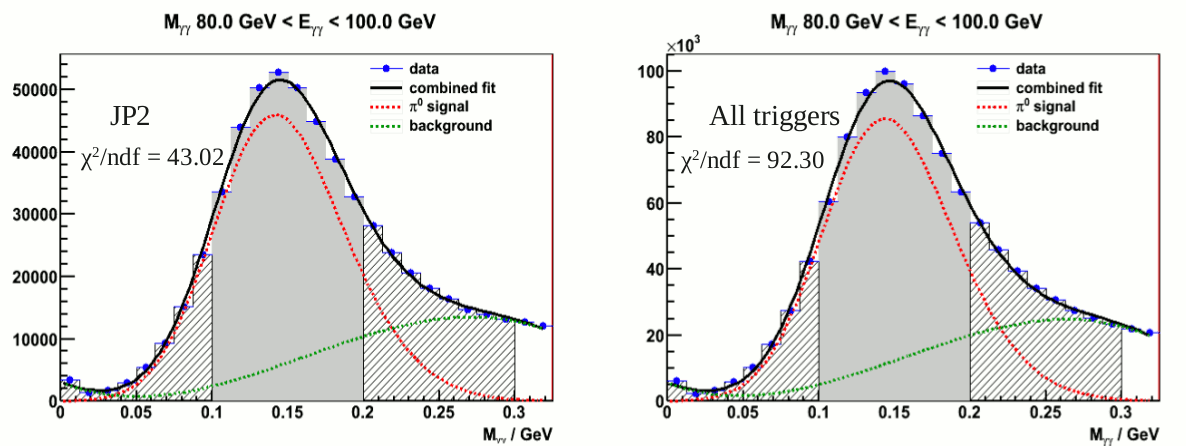
Figure 1. Prevous fit over entire dataset
Now I decided to split up the data fits on a run-by-run basis for each of the 7 energy bins from which I will extract the pi0 asymmetries. For each fill the averaged
pi0 fraction in the signal and side-band region will be used to calculate bkg. subtracted pi0 A_N. For example the following plots show the fits for 7 energy bins from Fill15419
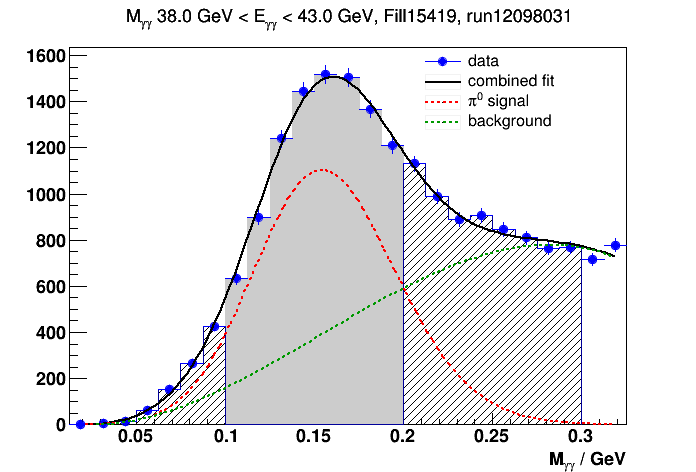
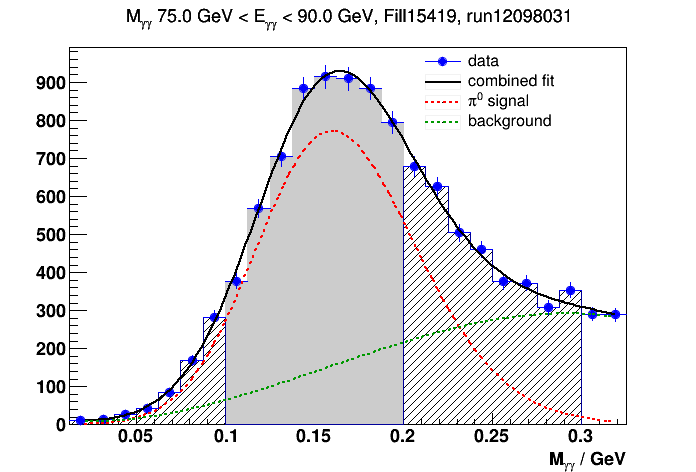
Figure 2. signal + bkg. fits for Fill 15419, run12098031
Figure 3 shows the chi2/ndf for all the 11 runs from Fill15419
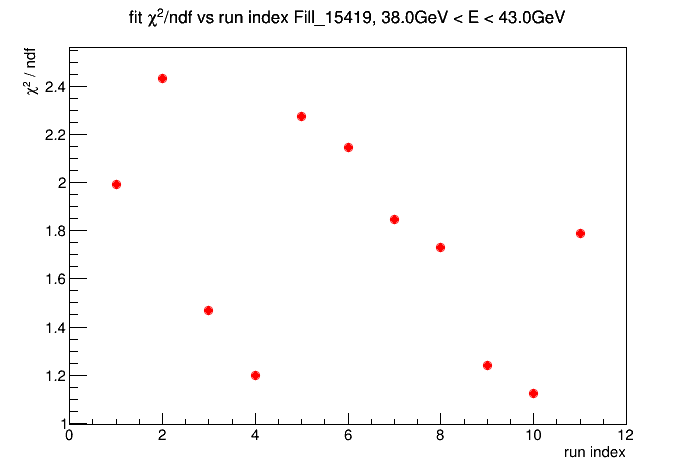
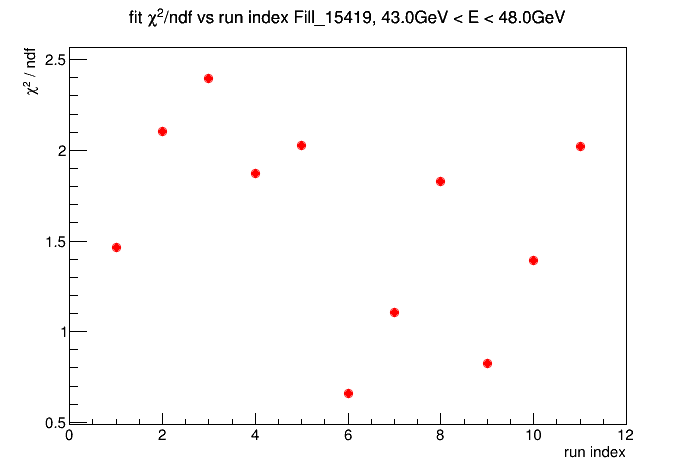
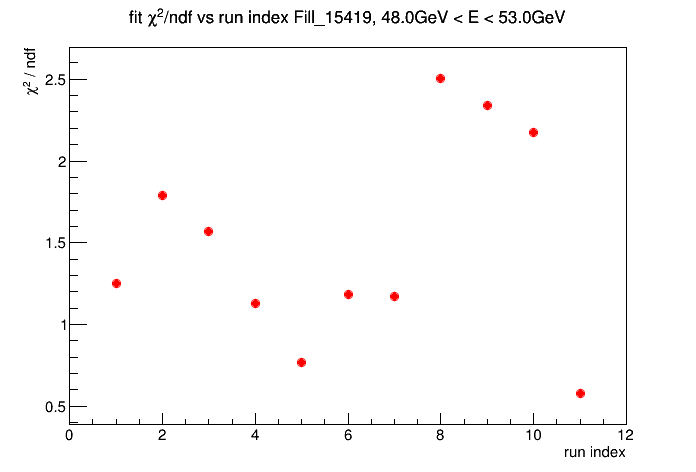
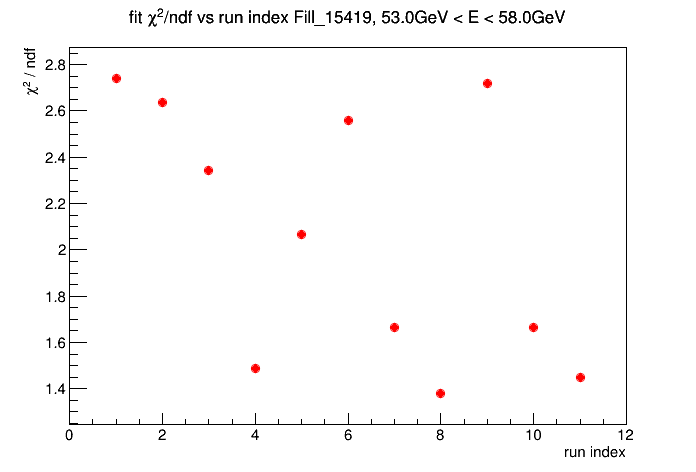
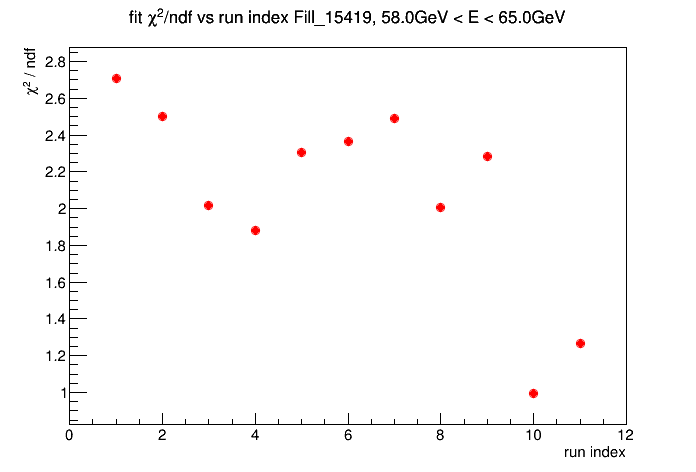
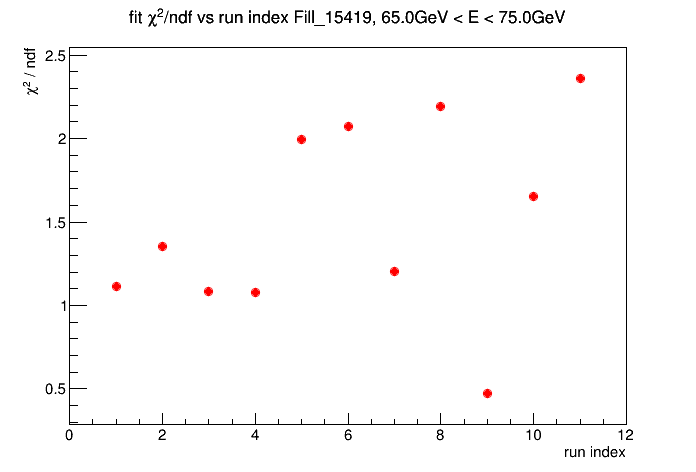
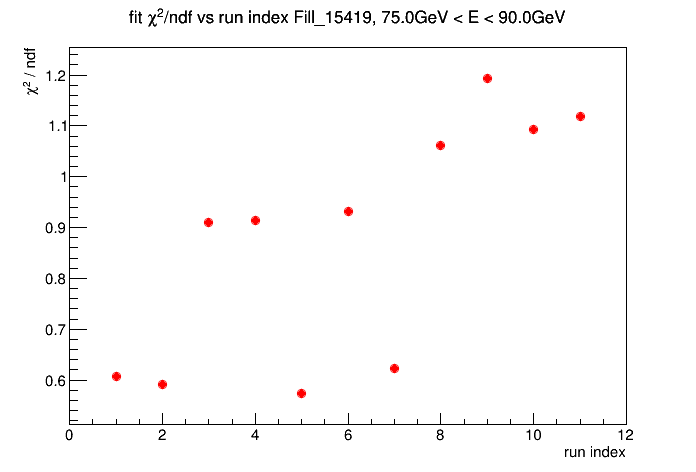
Figure 3. chi2/ndf for all the run from Fill15419, 7 energy bins
Figure 4 shows the pi0 fraction in signal region (0.1 GeV < M < 0.2 GeV ) for all these runs in fill15419
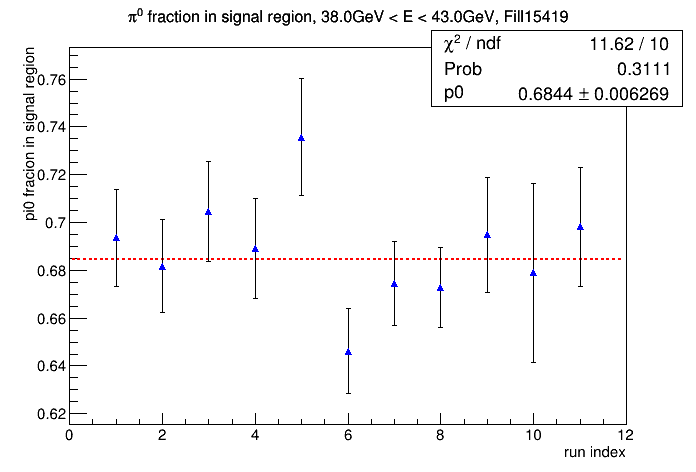
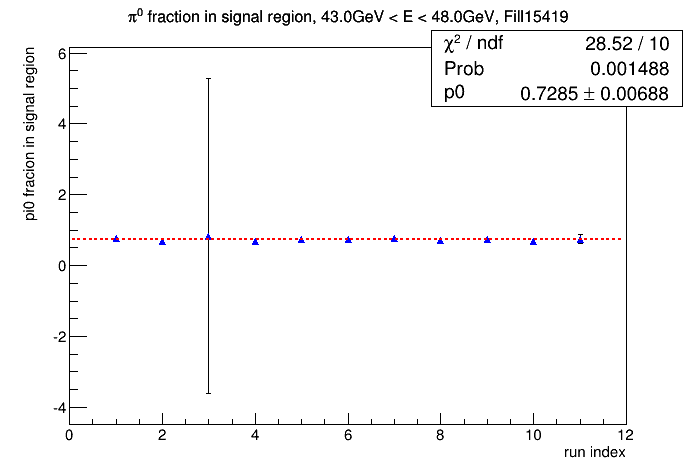
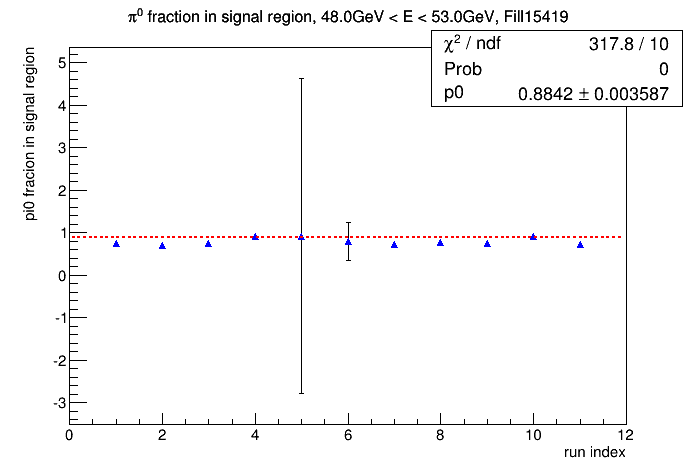
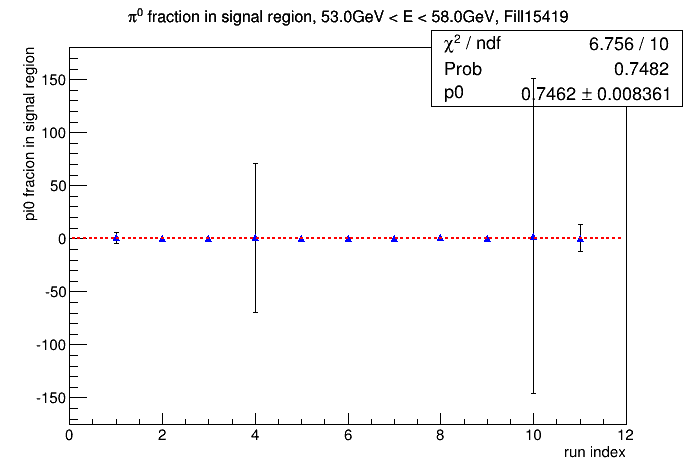
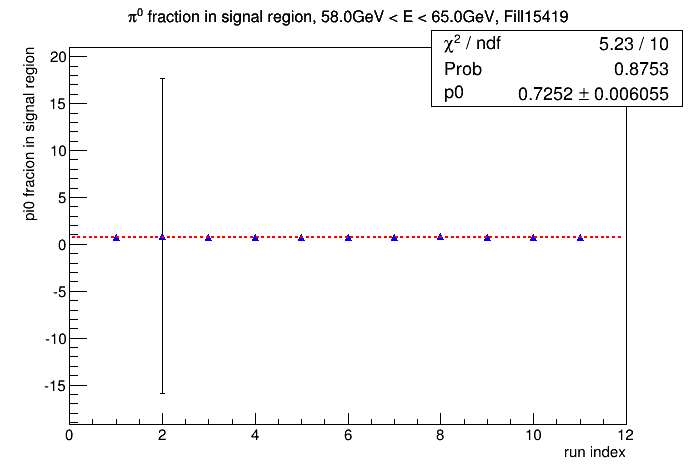
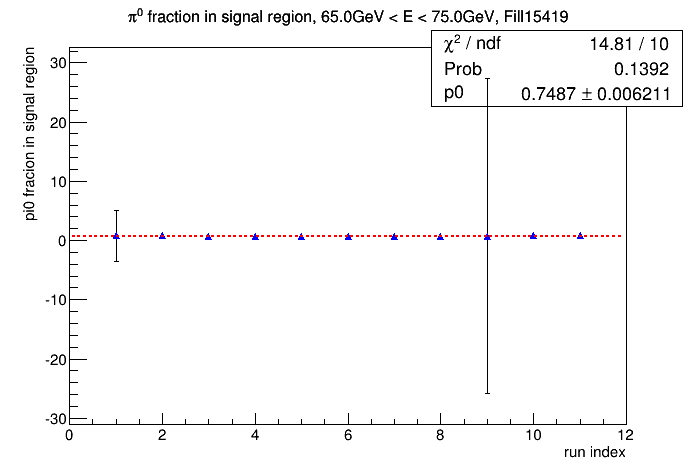
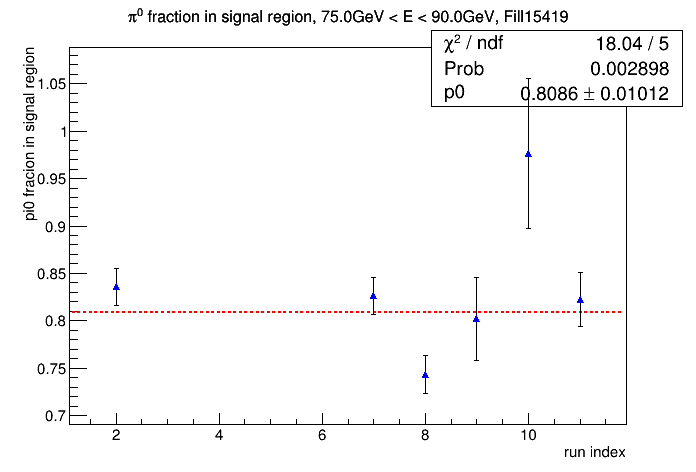
Figure 4. pi0 fractions in signal region ( 0.1 GeV < M < 0.2 GeV)
The large errors associated with some of the runs came from a problem during the toy-MC when I was trying to reproduce the covariance matrix of the fitting parameters.
The precedure of calcuating the uncertainties of signal fraction by a toy-MC can be found in my previous presentation here on slide23. The current problem is that sometimes this method failed to reproduce the errors of the bkg. parameters and the covariance between signal and bkg. parameters.
Update:
After some adjustments in defining the bkg. shape I was able to get better estimate of the errors of the pi0 fractions. Therefore Figure4 should be updated with the following new set of plots.
.gif)
.gif)
.gif)
.gif)
.gif)
.gif)
.gif)
- yuxip's blog
- Login or register to post comments
