BTOW - Calibration Procedure
Here you will find the calibration procedure for the BTOW (as of 2013).
Additional documentation about BTOW gain calibrations in previous years can be found here:
Report from the STAR EMC Calibrations Workshop (2008)
2006 BEMC Tower Calibration Report
2009 BEMC Tower Calibration Report
As well as in BEMC > Calibrations section on Drupal here.
1) Generating Pedestal/Status Tables
Getting Started
The files which are used for this are from L2 and they're stored on the online "starp" network. You will need to request an account on those machines. Following the instructions here, you should request an account on the "onlldap.starp.bnl.gov" host with the "onlmon" username (you should also request an account with your username if you can). After your request is approved you can log in with the commands shown here:
ssh-agent > agent.sh
source agent.sh
ssh-add
ssh -X -A aohlson@rssh.rhic.bnl.gov  % using your own username, of course
ssh -X -A stargw.starp.bnl.gov
ssh -X -A onlmon@onl05.starp.bnl.gov
It is also necessary to set up the proper directory structure and files.
% after logging in you should be in /ldaphome/onlmon/
mkdir emcstatus2013  % make a directory for the appropriate year
cd emcstatus2013
mkdir pp500  % make a directory for the species/energy
cd pp500
cp ../../emcstatus2012/pp500/l2status.py ./  % copy files from a previous year
cp ../../emcstatus2012/pp500/indexWrite.py ./
cp ../../emcstatus2012/pp500/l2status2012.sqlite3 ./l2status2013.sqlite3
cp ../../emcstatus2012/pp500/empty.sqlite3 ./
cp ../../emcstatus2012/pp500/mapping.sqlite3 ./
cp ../../emcstatus2012/pp500/star_env ./
mkdir db
mkdir db/bemc
mkdir db/eemc
mkdir histoFiles
mkdir /onlineweb/www/emcStatus2013  % make the directories where the online files will be written by indexWrite.py
mkdir /onlineweb/www/emcStatus2013/pp500
mkdir /onlineweb/www/emcStatus2013/pp500/pdf
mkdir /onlineweb/www/emcStatus2013/pp500/details
cd /onlineweb/www
ln -s emcStatus2013 emcStatus  % make a softlink from emcStatus to the current year's directory
cd -
Now you should go through l2status.py and indexWrite.py and change each instance of the year and species/energy to the current ones. Also there are some lines in l2status.py which refer to runnumbers, these should be changed as well. I also like to start fresh with the QA every year, and comment out the lines which hard-code bad channels. The variable "minimumMedianCounts" should be changed to a value appropriate for the species/energy that is being run.
Generating Status/Pedestal Tables with L2
In each run, as part of the L2 algorithm, a 2D histogram is filled with (channel# + 160*crate#) vs. (ADC-l2ped+20). This histogram is named "h22" and is contained within the root files located here: /ldaphome/onlmon/L2algo2013/l2ped/output/ The python macro named "l2status.py" takes this histogram as an input, and generates individual 1D histograms of the ADC spectra for every tower. These histograms are analyzed to determine the tower status, the ADC value of the pedestal peak, and the sigma of the pedestal peak. See below for the status code definitions and examples.
To execute the code do:
source star_env
python l2status.py
You can monitor the progress of the script by looking at l2status.log (for example, by opening another terminal and doing 'tail l2status.log -n50' periodically). As the script progresses you will see the summary pdf files posted to the webpage http://online.star.bnl.gov/emcStatus/pp500/ (for the relevant species/energy), the status and pedestal tables will be written as text files into db/bemc and db/eemc, the actual root histograms will be written into the histoFiles directory, and the results will be written into the database file l2status2013.sqlite3. The statuses and pedestals should be generated once for every good fill.
In a perfect world you would run over the code over the entire dataset once and you would have the status tables which are then uploaded to the STAR database. However, its usually not that simple. There are often problems with a handful of channels that aren't caught by the status checking code, or some that are flagged as bad, but shouldn't be. My suggestion would be to run the code over all the files first and then then we can use the information in the pdfs and in l2status2013.sqlite3 to isolate problem channels. Some of the parameters in the code you may need to tweak to improve the status tables, and some channels you may have to hard code as a bad status for a period of time.
If you want to clear everything and start fresh, you can do this: clean out the folders db/bemc/ and db/eemc/, remove the log file, remove runList.list, and do 'cp empty.sqlite3 l2status2013.sqlite3'
So as a first step, let l2status.py run for a while (it will take time, I often run it in screen so that I don't have to keep a terminal open). You should kill it manually (ctrl+c) when it reaches the end of the runs that you want to look at. When you start it running again it should just pick up (approximately) where it left off.
The code only computes status/pedestal tables if there are enough hits to get good-quality calibrations. The median number of hits above the pedestal must surpass some threshold (minimumMedianHits) in a given fill; this parameter should be set to an appropriate value in l2status.py (not too high that we miss a lot of fills, and not too low that we don't get good calibrations -- there are some examples for appropriate values given in the code). When the threshold is reached you will see some messages in the log file like
2012-06-07 00:26:36 PID: 21394 INFO medianHits = 635
2012-06-07 00:26:36 PID: 21394 INFO begin status computation
2012-06-07 00:28:05 PID: 21394 INFO end status computation -- found 122 bad channels
2012-06-07 00:28:05 PID: 21394 INFO begin endcap status computation
2012-06-07 00:28:05 PID: 21394 INFO 04TB07 status=136 nonzerohists=22
2012-06-07 00:28:05 PID: 21394 INFO 06TA07 status=136 nonzerohists=18
2012-06-07 00:28:05 PID: 21394 INFO 08TB07 status=136 nonzerohists=21
2012-06-07 00:28:06 PID: 21394 INFO 11TA12 status=0 nonzerohists=60
2012-06-07 00:28:06 PID: 21394 INFO end status computation -- found 11 bad endcap channels
2012-06-07 00:28:10 PID: 21394 INFO current state has been saved to disk
2012-06-07 00:28:10 PID: 21394 INFO creating PostScript file
2012-06-07 00:29:09 PID: 21394 INFO calling pstopdf
2012-06-07 00:29:42 PID: 21394 INFO removing ps file
2012-06-07 00:29:43 PID: 21394 INFO creating endcap PostScript file
2012-06-07 00:29:52 PID: 21394 INFO calling pstopdf
2012-06-07 00:29:57 PID: 21394 INFO removing ps file
2012-06-07 00:29:58 PID: 21394 INFO Finished writing details webpage for F16732_R13108069_R13108080
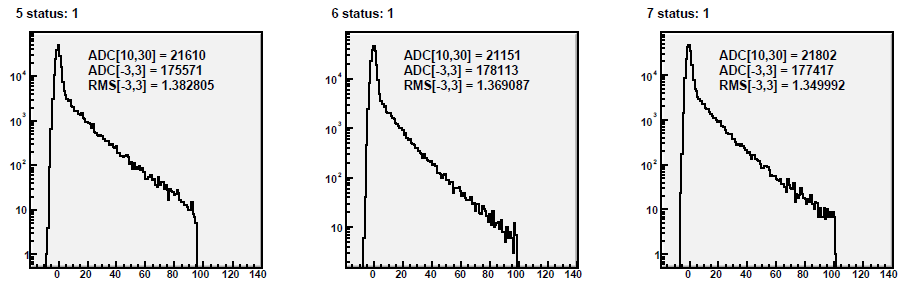
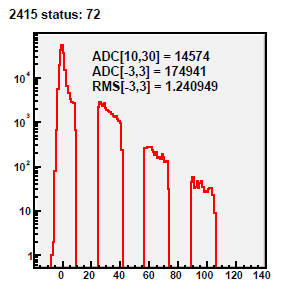
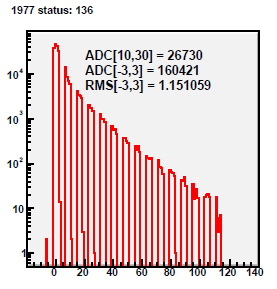
2012-06-07 00:30:00 PID: 21394 INFO goodnight -- going to sleep nowTo evaluate the status of each BEMC tower, its ADC spectrum is tested for various features. If a test fails, then a bit (or multiple bits) is flipped to indicate the nature of the problem with the tower. It is possible for a tower to fail multiple tests and therefore have a status code which indicates multiple problems. I show examples of towers which fail each of the basic tests and are therefore assigned specific status codes.
Status Code Definitions
000 == channel does not exist or is masked in L2ped
001 == channel is good
002 == channel is either hot or cold (see bit 16)
004 == channel has a weird pedestal (see bit 32)
008 == channel has a stuck bit (see bits 64 and 128)
016 == if off, hot (10x as many hits); if on, cold tower (10x fewer hits)
032 == if off, pedestal mean is out of bounds; if on, pedestal width is too large/small
064 == bit stuck on
128 == bit stuck off
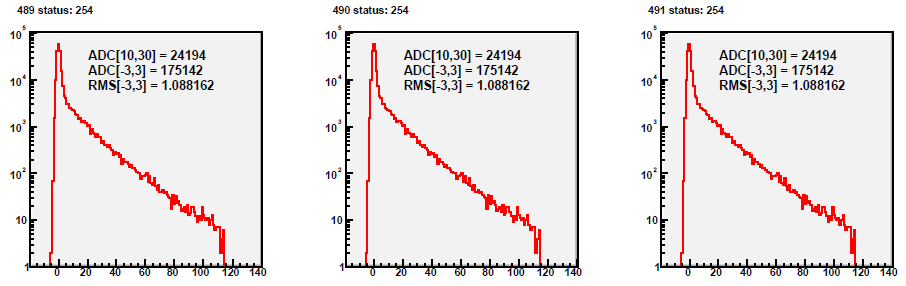
254 == identical channel
These codes can be seen by going to the EMC Status webpage and clicking on any of the Details pages.
I show examples from a heavy ion (U+U) run where the numbers of counts in the histograms are higher than in p+p, for clarity. All these plots come from the pdf here.
status = 1 (normal ADC spectrum)
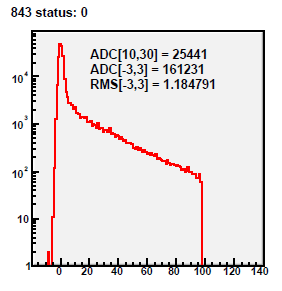
status = 0 (channel is masked out)
Note: MOST of the channels marked with a zero status are (or were) hot channels that were caught and masked out.
status = 2 (hot channel)
Hot channels look like the above plot, and most of them are caught in realtime and masked out, and thus assigned a status of zero. It is unusual to actually catch a really hot channel after the fact.
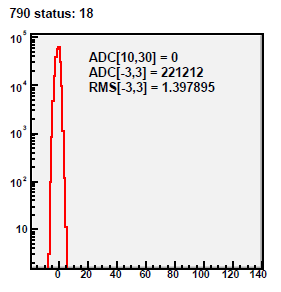
status = 18 = 2+16 (cold channel)
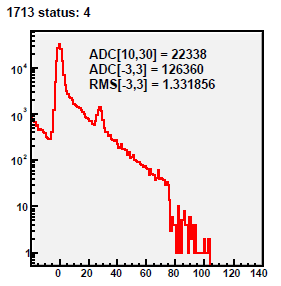
status = 4 or 36 (bad pedestal)
This status catches a range of problems, from weird-looking spectra (like shown here), to wide pedestals, etc.
status = 72 = 8+64 (stuck bit - on)
status = 136 = 8+128 (stuck bit - off)
status = 254 (identical channels)
2) QAing the Pedestal/Status Tables
Once the ped/stat tables have been generated, they must be QAed. I do the QA in two parts:
1) I spot check the pdf files by eye. I pick about 5 or 6 fills evenly spaced throughout the run and go through each page of the pdf files looking for any strange-looking towers (for example, towers with stuck bits are pretty easy to see, and they don't always get caught by the algorithm). Yes, this takes a while, but we don't have to look at the pdfs for every fill!
For examples of the bad channels you are looking for, have a look at Suvarna's nice QA of the tables last year:
https://drupal.star.bnl.gov/STAR/blog/sra233/2012/dec/05/bemc-statuscuau200hard-coded-towers
https://drupal.star.bnl.gov/STAR/blog/sra233/2012/aug/15/bemc-statuspp200towers-with-status-marked-oscillating
2) The status and pedestal information is stored in the sqlite database file, and we can spin over this quickly in order to look at the data over many runs/fills. I have attached a script which is used to analyze the database file l2status2013.sqlite3. The first step is to download l2status2013.sqlite3 somewhere *locally* where you can look at it, and save statusCheckfill2.py in the same place. In statusCheckfill2.py you should change line 27 to the appropriate run range that you are analyzing, and change 2012-->2013 if necessary. Then all you need to do to run the code is something like:
setenv PYTHONPATH $ROOTSYS/lib
python statusCheckfill2.py
This python code allows you to look at the statuses and pedestals from run to run. At the moment I make lists of the statuses and pedestals for each tower (in the variables u and y -- sorry for my horrible naming scheme!), and then I can print these lists to the screen or graph them. At the moment I have the code so that it prints the statuses for any tower that has status 1 some, but not all, of the time (line 138). This script can be used to find channels which change status frequently over the course of the run... for example, sometimes there are channels which are right on the edge of satisfying the criteria for being marked as "cold" and therefore their status alternates 1 18 1 1 18 18 1 1 18 1 18 etc. Then we can look at the pdf files to see if the tower always looks cold, or if its behavior really changes frequently. If it is truly cold, then at that point we can either adjust the criteria for being marked as cold, or hard-code the channel as status 18 (I typically just hard-code it).
Also I can look at the histograms histoPedRatio and histoPedRatioGood (which are saved out in histogramBEMCfill.root), which are plots of the ratio of the pedestal for a given run to the pedestal of the first run as a function of tower id. histoPedRatio is filled for every tower for every run (unless the pedestal for that tower in the first run is zero), and histoPedRatioGood is only filled if the tower's status is 1. I haven't needed to cut out any towers based on these plots, but I think they would be a good way to find any towers whose pedestals are fluctuating wildly over time (or maybe you might want want to plot the difference, not the ratio).
So you can take a look at the code and play around with it so that it allows you to do the QA that you think is best.
If you look at l2status.py, you can see where I've hard-coded a bunch of channels I thought were bad (the lines which hard-code bad channels are commented out right now because I prefer to start from scratch each year). I've pasted the code here too:
## hard code few bad/hot channels
#if int(tower.softId)==939 : ##hard code hot channel
# tower.status |= 2
#if (int(tower.softId)==3481 or int(tower.softId)==3737) : ##hard code wide ped
# tower.status |= 36
#if (int(tower.softId)==220 or int(tower.softId)==2415 or int(tower.softId)==1612 or int(tower.softId)==4059): ##hard code stuck bit
# tower.status |= 72
if (int(tower.softId)==671 or int(tower.softId)==1612 or int(tower.softId)==2415 or int(tower.softId)==4059) : ##hard code stuck bit (not sure which bit, or stuck on/off)
tower.status |= 8
if (int(self.currentFill) > 16664 and (int(tower.softId)==1957 or int(tower.softId)==1958 or int(tower.softId)==1977 or int(tower.softId)==1978 or int(tower.softId)==1979 or int(tower.softId)==1980 or int(tower.softId)==1997 or int(tower.softId)==1998 or int(tower.softId)==1999 or int(tower.softId)==2000 or int(tower.softId)==2017 or int(tower.softId)==2018 or int(tower.softId)==2019 or int(tower.softId)==2020)) : ##hard code stuck bit
tower.status |= 8
if (int(tower.softId)==410 or int(tower.softId)==504 or int(tower.softId)==939 or int(tower.softId)==1221 or int(tower.softId)==1409 or int(tower.softId)==1567 or int(tower.softId)==2092) : ##hard code cold channel
tower.status |= 18
if (int(tower.softId)==875 or int(tower.softId)==2305 or int(tower.softId)==2822 or int(tower.softId)==3668 or int(tower.softId)==629 or int(tower.softId)==2969 or int(tower.softId)==4006) : ##either cold or otherwise looks weird
tower.status |= 18
Some of these channels are persistently problematic, so I expect that your list of bad channels will look similar to mine from previous years.
It may take a few iterations of generating the tables, finding bad towers, tweaking the code or hard-coding the bad channels, regenerating the tables, etc before you are satisfied with the quality of the tables. Once you have run l2status.py one last time and are satisfied with the quality of the tables you have generated, they are ready to be uploaded to the database by the software coordinator.
3) Uploading Pedestal/Status Tables to the Database
Once the ped/stat tables have been QAed satisfactorily, the values need to be uploaded to the database.
First, the files in /db/bemc/ need to be moved to RCF, where the upload will take place. This can be done with the following commands:
ssh-agent > agent.sh
source agent.sh
ssh-add
ssh -X -A aohlson@rssh.rhic.bnl.gov % using your own username
rterm -i
mkdir bemcUpload2013 % make a directory to work in
mkdir bemcUpload2013/tables
cd bemcUpload2013/tables/
scp onlmon@onl05.starp.bnl.gov:'/ldaphome/onlmon/emcstatus2013/pp500/db/bemc/*.txt' ./
cd ../
The scripts bemcPedTxtUpload.C and bemcStatTxtUpload.C are used to perform the upload. They take as input the name of a file which contains a list of the files to be uploaded. To create the file lists:
% in bemcUpload2013/
mkdir lists
cd tables
ls bemcStatus*.txt > ../lists/bemcStatus.list
ls bemcPed*.txt > ../lists/bemcPed.list
cd ../
Once the file lists have been created, the scripts can be run with:
stardev
setenv DB_ACCESS_MODE write
root4star bemcStatTxtUpload.C
root4star bemcPedTxtUpload.C
Important!
1) The upload scripts (bemc*TxtUpload.C) contain return statements to prevent accidental uploads. Make sure everything is working properly by running the scripts with the return statements included (nothing will be uploaded to the db) first. When you are sure that you're ready to upload, then comment out the return statements. After uploading, don't forget to uncomment the return statements!
2) Try uploading one table first, and then check that it is uploaded correctly (see below), before uploading all the tables for the whole run. If a table is uploaded wrongly, it can be disactivated by the software team, but this is not something we want to do often. (In the case of a single table, it may be more efficient to just upload the correct table with a timestamp one second after the incorrect table.)
3) Reminder: this is not a task many people should need to do but should be limited to one or two "experts", who will be given special DB writing priviledges by Dmitry Arkhipkin (arkhipkin@bnl.gov).
Uploaded tables can be viewed with the online BEMC DB browser. I find it helpful to spot-check some tables to make sure they have been uploaded correctly. I find a table with the browser, copy it into an text file, and compare it to the text file I uploaded (in tables/). For the status tables, this can be done with a simple diff command. For the pedestal tables, the script checkPeds.C can be used.
At the beginning of the run (after physics has been declared, L2 is running, etc), it is good to generate a set of ped/stat tables and upload them to the database one second after the initialized values (for example, at 20131220.000001). (Reminder: The procedure for initializing the timeline with ideal values can be found here.) This can be done with the bemc*TxtUpload.C scripts; you will see a commented-out line that shows how to set the timestamp manually. It is good to do this periodically throughout the run, especially if something changes with the detector or beam configuration, so that FastOffline reconstruction can pick up decent DB values. Each time, the tables should be uploaded one second after the previous tables, so that when we upload the fully-QAed tables at the end of the run, the temporary ones will no longer be picked up.
4) Relative Gain Calibration with MIPs
Getting Started
1) The code needed to perform the gain calibrations can be checked out from CVS and compiled. In your working directory, do:
 cvs co StRoot/StEmcPool/StEmcOfflineCalibrationMaker/
cons
You can move the required files to your working directory, or make soft links. You need the following files, which are in the macros/ directory:
-- bemcCalibMacro.C
-- btow_mapping.20030401.0.txt
-- CalibrationHelperFunctions.cxx
-- CalibrationHelperFunctions.h
-- electron_drawfits.C
-- electron_histogram_maker.C
-- electron_master.C
-- electron_master_alt.C
-- electron_tree_maker.C
-- geant_fits.root
-- mip_histogram_fitter.C
-- mip_histogram_maker.C
-- SubmitCalibJobs.pl
-- runMIPjobs.sh
-- runElecJobs.sh
-- runFinalElecJobs.sh
Some of the files have lists of triggers which need to be hard-coded in for each year. In particular, in bemcCalibrationMacro.C you should ensure that the correct trigger list is present, and the trigger IDs for the HT triggers need to be written in StEmcOfflineCalibrationMaker.cxx. (In most cases I have already typed in the values for Run 11, but they are commented out while the Run 9 values are commented in.) If you want to use the TOF information (in Run 11 and beyond), there are some lines of code that need to be commented in in StEmcOfflineCalibrationMaker.cxx.
Generating Trees
2) Generate the list of runs with the following command (for Run 9)
get_file_list.pl -keys "runnumber" -distinct -cond "production=P11id,filetype=daq_reco_MuDst,sanity=1,trgsetupname=production2009_200GeV_Single,filename~st_physics,tpx=1,emc=1,storage!=HPSS" -limit 0 | sort -u > runlist.txt
or similar for other years.
3) Run SubmitCalibJobs.pl, which will execute the bemcCalibMacro.C macro. Make sure that the correct catalog query lines are commented in/out in the submit script. Also ensure that the appropriate directories exist ($workingDir, $schedDir, $outDir, $logDir, $scriptDir) as specified at the top of the submit script.
This macro creates trees which store primary tracks which will be further analyzed for the calibration. For each primary track we write out the track information from the TPC, the EMC information for the 3x3 tower cluster around the track, the TOF information (in Run 11 and beyond), and the trigger information.
The trees created by this step are stored on HPSS here:
Run 9: /home/aohlson/bemcCalib2009_x.tar where x=0,...,9
Run 11: /home/aohlson/bemcCalib2011_05_x.tar where x=0,...,14 and /home/aohlson/bemcCalib2011_07_x.tar where x=0,...,18
MIP calibration
The relative gain calibration is obtained by finding the MIP peak in each of the 4800 BEMC towers.
The MIP energy deposit has the following functional form, which was determined from test beam data and simulations:
MIP = (264 MeV)×(1+0.056η2)/sin(θ)
From this expression we can calculate a calibration constant
C = 0.264×(1+0.056η2)/(ADCMIP×sin(θ))
where ADCMIP is the location of the MIP peak in the ADC spectrum. This allows us to combine towers at the same η and thus find the absolute gain calibration in each crate-slice using electrons (see next section).
The procedure for obtaining the MIP calibration is as follows...
4) Make the MIP histograms with runMIPjobs.sh which executes mip_histogram_maker.C Ensure that the correct output filenames are specified in the submit script.
Events with |vz| < 30 cm are selected, and any towers that have multiple tracks associated with them are excluded. We select tracks with p > 1 GeV/c, and require that they enter and exit the same tower. We require that the towers surrounding the central tower do not contain a large energy deposition. We require that ADC-ped > 1.5*pedRMS. After these track quality cuts we fill histograms with the ADC-ped values for each tower.
5) Make a list of the output files from step (4) called mips.list. Run mip_histogram_fitter.C
We fit each histogram with a gaussian on a pedestal; the histograms and fits are shown in mip.pdf. If the fit values fail basic quality cuts (such as if the mean is < 5), then the tower is assigned a bad status (!=1). These fits are marked as red in mip.pdf. For each tower we record the mean and sigma of the gaussian fit, and the status.
6) Check mip.pdf by eye to look for any other towers which were obviously bad. Write a function like isBadTower2009(int id) (see examples in the code) which identifies these bad towers so that they can be assigned a bad status. You can either put this function in mip_histogram_fitter and re-run it, or you can put it in the electron codes. Note that most of the towers with bad MIP peaks were marked as bad (cold/hot/stuck bit) towers when the status/pedestal tables were originally computed.
5) Absolute Gain Calibration with Electrons
Electron calibration
The absolute gain calibration is done by identifying electrons and finding the E/p peak for small groupings of towers. It is desirable to find the E/p peak for as small groupings as possible. In 2006 the calibration was done in rings in η, while in 2009 it was done for "crate-slices", which are groups of 8 towers in the same crate in the same η ring.
The procedure is as follows...
7) Make the electron trees with runElecJobs.sh which will execute electron_tree_maker.C Ensure that the correct output filenames are specified in the submit script.
The macro electron_tree_maker.C makes slimmer trees of electron candidates which satisfy the following criteria:
-- event vertex |vz| < 60
-- track must come from reconstructed vertex (ranking >= 0)
-- 1.5 < p < 20 GeV/c
-- nhits >= 10
-- matched tower status = 1
-- dE/dx > 3e-6
-- ADC-ped > 1.5*pedRMS
In this macro, if the electron track points towards a HT trigger tower then it is assigned htTrig = 2
8)
In the old calibration: Make a list of the output files from step (5) called electrons.list. Run electron_master.C.
---- OR ----
In the new calibration: Run runFinalElec.sh, which executes electron_master_alt.C (make sure that the input/output filenames and directories are correct). Hadd the resulting output files, and use this file as the input to electron_drawfits.C
In this macro even more stringent cuts are placed on the electron candidates:
-- ADC-ped > 2.5*pedRMS
-- track must enter and exit the same tower
-- p < 6 GeV/c
-- track does not point towards a tower which fired the HT trigger (htTrig != 2)
-- dR < 0.025 (distance from the center of the tower)
-- dE/dx > 3.4e-6
-- the maximum Et in the 3x3 cluster of towers must be in the central tower
-- there are no other tracks pointing to the central tower
The resulting histograms of E/p in each crate-slice are drawn and fit with a Gaussian plus a first-order polynomial. If the calibration is already correct, then the E/p peak should be at 1. The deviation from unity establishes the absolute gain calibration which, combined with the relative gain calibration from the MIP procedure, defines the overall BEMC gain calibration.