HLT Beamline convergence study
In trying to automate the offline montioring of the BeamLine position, I've done some tests of the convergence of the HLT BeamLine calibration code, which uses a BeamLine as input, and thus must iterate to come to a stable solution.
I processed st_physics_13065041_raw_3010001.daq (from the low luminosity fill), using either 1k events, or 10k events. Also, I was told that the code reads in several (up to 50) previous beamline values, which I figured would slow down convergence, so I also ran a 10k event iteration where I made sure only the beamline from the previous event is available (I will refer to this as 10k-single). As a starting point, I used the result of the HLT calibration for run 13067017 of (x,y) = (0.086302,0.061598).
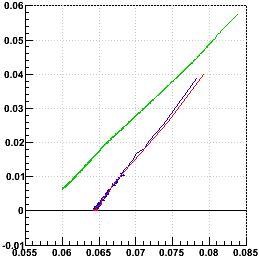
Interestingly, on the very first iteration, all three jobs give very different results of (0.083726,0.057594) for 1k, (0.078282,0.038836) for 10k, and (0.079136,0.040049) for 10k-single (I double-checked this to be true). From there, the three sets of iterative calibration had notably different results. In the following plots, blue is used for the 10k calibration, red is the 10k-single calibration, and green is the 1k calibration.
All axes are in [cm] units, if not unitless.
y vs. x, first iteration is in the upper right, tracking left and down with iterations:
x vs. log10(iteration number), and y vs. log10(iteration number):
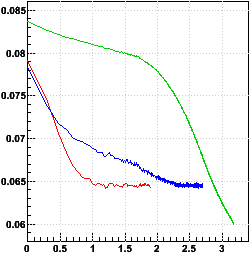
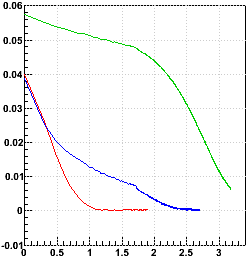
The 10k-event calibrations clearly converge much more quickly than the 1k-event calibration, which had not even converged after 1500 iterations. It even appears that the 1k-event calibration will come to a different convergence result, as the trajectory in y vs. x is significantly different! The 10k-single also does much better than the 10k, converging perhaps an order of magnitude more quickly.
The next question is how to determine one has converged. The obvious metric is the Δx and Δy between the last two iterations. These are plotted here as Δx vs. x-xfinal and Δy vs. y-yfinal:
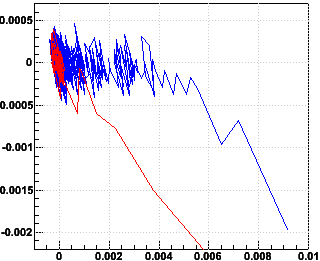
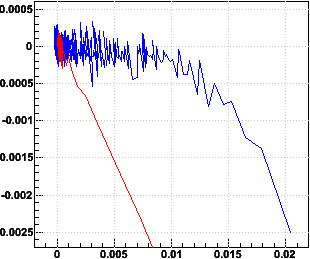
Note that for the 10k calibration, Δx and Δy approach a limiting range of fluctuating values before x and y have converged, with a discrepancy still on the order of 100 μm. However, the 10k-single is much closer to its final values by the time the range of fluctuations is reached. So it is probably sufficient to say that the 10k-single has converged when we reach |Δx| < 0.0003 and |Δy| < 0.0003 (3 μm).
Another question is whether there's any reason to push the system along by considering how quicky the iterations are approaching convergence and modifying the results of the calibration in the same direction it's heading to speed up the convergence. I considered this particularly when I saw how slowly the 1k calibration was taking. But given how quickly the 10k-single converges, I think this is unnecessary. The trick I had considered was to see if the Δx and Δy stayed constant over iterations. The next pair of plots shows the percentage change in Δx and Δy as the x and y approach their final values. The plots are actually log10(100*|(Δxnew/Δxold)-1|) vs. x-xfinal and log10(100*|(Δynew/Δyold)-1|) vs. y-yfinal:
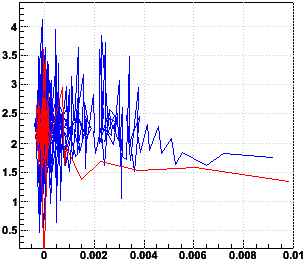
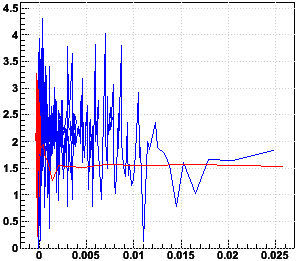
If one wanted to speed up the convergence, there would only be a couple iterations where the Δx and Δy are constant enough to make a difference, and there could then be some penalty for speeding up too much and going past the convergence point. So I have decided against this.
___________
Finally, it should be noted that the result of the 10k and 10k-single calibrations is a beam position of (0.0646,0.0004) with small errors of just a few μm. This takes no z dependence into account and is perhaps better-labeled as (<x>,<y>). The result compares with the a standard offline BeamLine calibration result using the same data of (x0,y0) = (0.0642,0.0613) and dx/dz = 0.001385, dy/dz = 0.000057, also with errors of just a few μm.
The x positions match quite well, but the y positions differ by more than 0.06 cm. I might have expected the lack of z dependence to play a larger role for x than y because dx/dz is much larger than dy/dz (i.e. if <z> is not 0, then <x> and <y> will differ from x0 and y0 by amounts depending on dx/dz, dy/dz), so the disagreement in y, though minor, is not immediately explainable. The agreement in x is rather impressive, but perhaps accidental?
I tried iterating 10k-single calibrations on two other DAQ files from the same run (file sequences 4010001 and 5010001) and found that they converge to similar, but not identical, values: (0.0616,0.0038) and (0.0653,0.0046). So while the method has some intrinsic resolution of about ±3 μm from any sample of 10k events, there is a larger statistical error on the order of ±10-20 μm in using one set of 10k events versus another. This is still not large enogh to explain the ~600 μm discrepancy with the offline calibration.
One last note: in doing this, I have accidentally used different starting values for the beamline before the iteration begins, and the calibrations still arrive at the same final result (within the eventual ±3 μm fluctuations).
____________
Conclusions: Though there may be some offset with respect to the offline calibration, the HLT code can do well at monitoring for changes in the beam position of the order of 100 μm or more in low luminosity data. It will be interesting to watch this with varying luminosity. It is also worth noting that the slope of the BeamLine has rarely changed during past Runs, so using changes in the HLT calibration results to simply shift the intercept of an initial offline calibration while holding slopes steady may work well for a FastOffline beamline calibration.
-Gene
- genevb's blog
- Login or register to post comments
