- jwebb's home page
- Posts
- 2019
- 2018
- 2017
- 2016
- 2015
- 2014
- 2013
- November (1)
- October (1)
- September (1)
- July (1)
- June (1)
- April (1)
- March (3)
- February (1)
- January (1)
- 2012
- 2011
- December (2)
- September (3)
- August (5)
- July (6)
- June (6)
- May (1)
- April (5)
- March (5)
- February (2)
- January (2)
- 2010
- December (3)
- October (3)
- September (2)
- August (2)
- June (2)
- May (4)
- April (4)
- March (2)
- February (4)
- January (10)
- 2009
- 2008
- 2007
- 2006
- July (1)
- My blog
- Post new blog entry
- All blogs
Isolation cut, data vs. MC, take 3
Abstract: We compare data to Monte Carlo for the ratio of single-tower (corrected) ET to the ET summed over R<0.3.
1.0 Data set and cuts
- electrum run list
- select trigger id 137641
- standard definition of gamma candidate (3x3 cluster)
- full EEMC acceptance
2.0 MC event sample
- Pythia event sample (pibero's gamma trees) w/ proper weighting for partonic pT bins
- Simple offline trigger simulation
- full EEMC acceptance
3.0 Comparison of Data to MC in pT bins
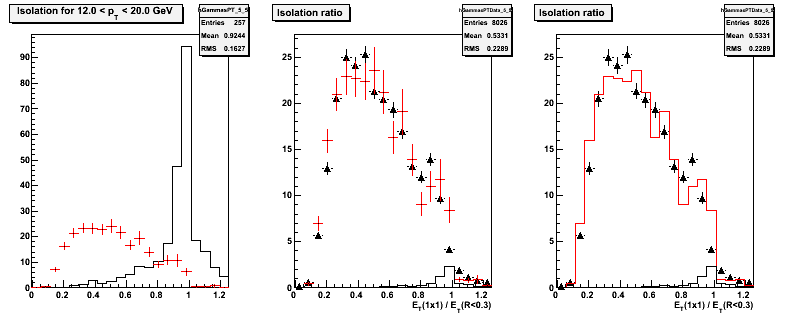
The following plots show three panels:
- Left: MC gammas (black), MC jets (red), with common normalization
- Center: Data (black triangles), MC jet yield+gamma yield (red w/ error bars), gamma yield absolute normalization (black)
- Right: Same as center, except MC is red histogram
Figure 3.1 -- Isolation ratio for 5 < pT < 6 GeV.
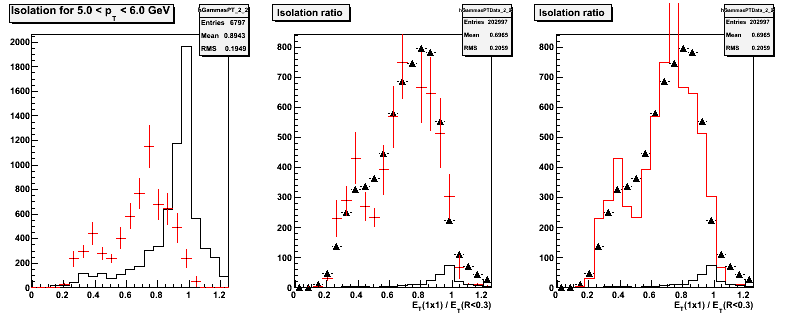
Figure 3.2 -- Isolation ratio for 6 < pT < 8 GeV
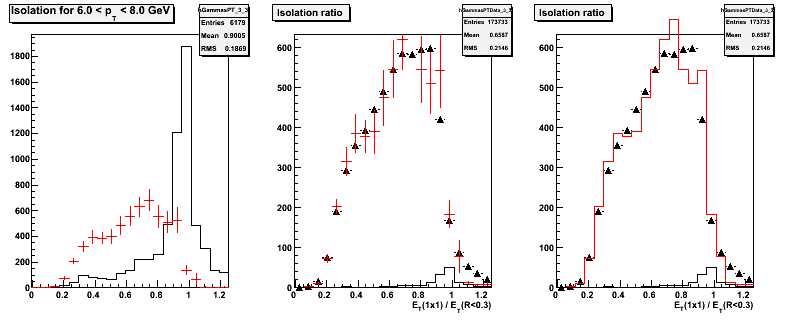
Figure 3.3 -- Isolation ratio for 8 < pT < 12 GeV
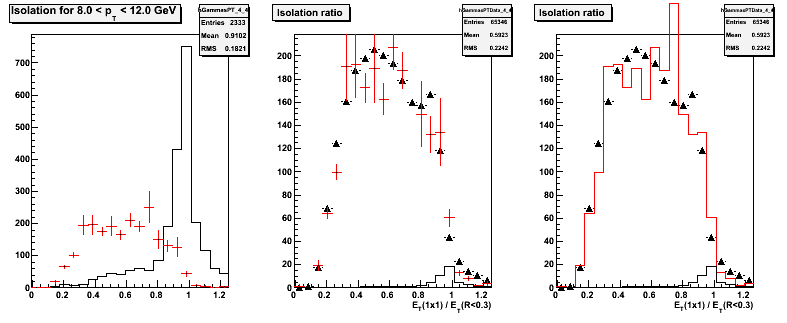
Figure 3.4 -- Isolation ratio for 12 < pT < 20 GeV
4.0 Comparison of Data to MC in 3 sets of eta bins
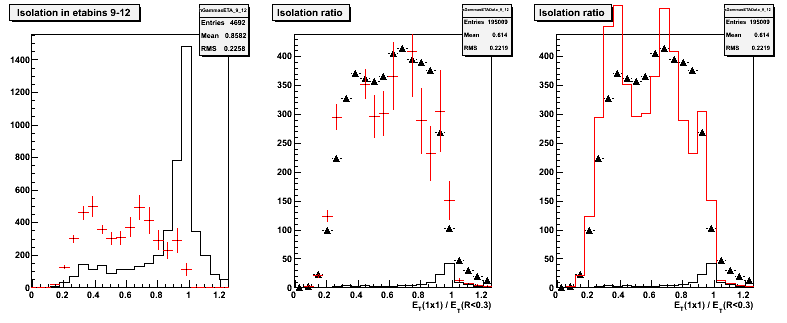
The following plots show three panels:
- Left: MC gammas (black), MC jets (red), with common normalization
- Center: Data (black triangles), MC jet yield+gamma yield (red w/ error bars), gamma yield absolute normalization (black)
- Right: Same as center, except MC is red histogram
Figure 4.1 -- Isolation ratio for etabins 1-4
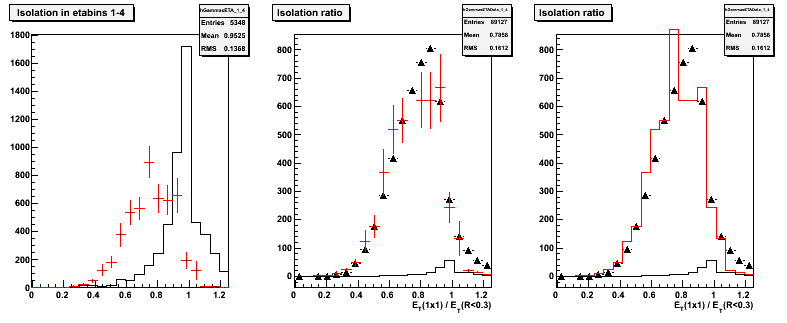
Figure 4.2 -- Isolation ratio for etabins 5-8
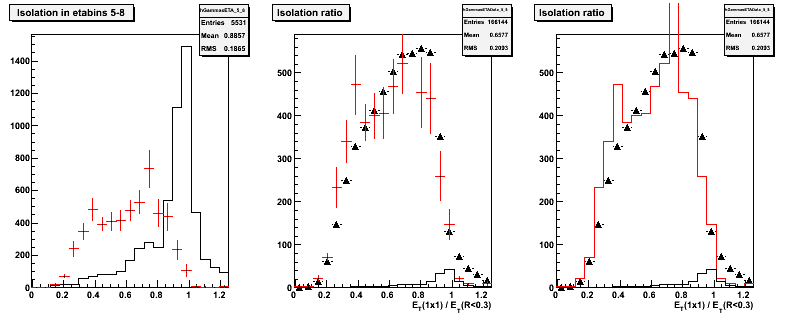
Figure 4.3 -- Isolation ratio for etabins 9-12
5.0 Conclusions
- The Monte Carlo reproduces the isolation ratio well, within the statistical precision of the MC sample
- It is Isolation cut, data vs. MC, take 1 to get detailed agreement between data and MC, below 12 GeV.
- From Checking the isolation cut vs pythia events, the rejection power of the isolation cut was comparable to the rejection power quoted in the endcap proposal.
- Next we need to evaluate the rejection versus efficiency for the combined trigger + isolation cut / but this will be different from the Checking the isolation cut vs pythia events only to the extent that the trigger shows inefficiencies for gamma identification.
08/16/2008
Smeared tower gains by 5% and reran the comparison.
- Agreement between data and MC improved in the 8-12 GeV and 12-20 GeV bins.
- Agreement about the same in the 5-6 GeV and 6-8 GeV bins.
It probably doesn't pay to investigate this further until we have the higher-statistics MC sample.
Groups:
- jwebb's blog
- Login or register to post comments
