- jwebb's home page
- Posts
- 2019
- 2018
- 2017
- 2016
- 2015
- 2014
- 2013
- November (1)
- October (1)
- September (1)
- July (1)
- June (1)
- April (1)
- March (3)
- February (1)
- January (1)
- 2012
- 2011
- December (2)
- September (3)
- August (5)
- July (6)
- June (6)
- May (1)
- April (5)
- March (5)
- February (2)
- January (2)
- 2010
- December (3)
- October (3)
- September (2)
- August (2)
- June (2)
- May (4)
- April (4)
- March (2)
- February (4)
- January (10)
- 2009
- 2008
- 2007
- 2006
- July (1)
- My blog
- Post new blog entry
- All blogs
Isolation cut, rejection and efficiency versus cut value
Updated on Tue, 2008-08-19 15:13. Originally created by jwebb on 2008-08-19 15:13.
Abstract: We show what isolation cut is needed to obtain a given pi0 rejection power in each pT bin.
1.0 MC Event Sample
- Pythia event sample (pibero's gamma trees) w/ proper weighting for partonic pT bins
- No offline trigger simulation
- full EEMC acceptance
2.0 Definition of Isolation Cut
We use an isolation cut, which consists of correcting the ET of the tower which contains the photon candidate based on the position of the candidate within the tower, and dividing that corrected ET by the sum of all towers w/in R < 0.3. The following links summarize the method.
- See Checking the isolation cut vs pythia events for definition of the 1-tower isolation cut and evaluation of rejection versus efficiency based on pythia events.
- See Isolation cut, data vs. MC, take 3 for data vs MC comparison, including trigger simulation.
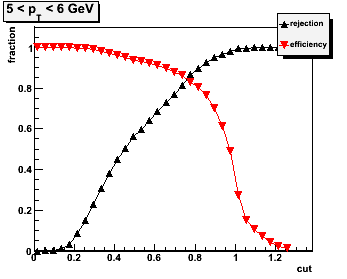
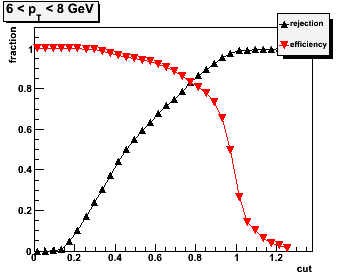
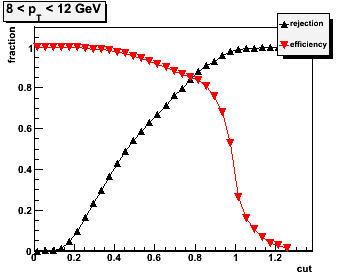
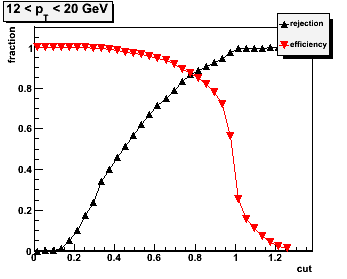
The links above show plots of rejection power vs. efficiency. It is informative to plot rejection vs. applied cut, and efficiency vs. applied cut. See figure 1 below.
Figure 1 -- Rejection power (red) or photon efficiency (black) vs. isolation cut.


3.0 Conclusions
Requiring an isolation ratio > 0.8 will result in rejection power of ~83% at an efficiency of ~83%. This is approximately independent of pT. It may be desirable (necessary) to make harder isolation cuts at lower pT. However, given the poor agreement between data and MC for large neutral-energy jets, it becomes more difficult to quantify the actual rejection power with such tight cuts.
»
- jwebb's blog
- Login or register to post comments
