- dilks's home page
- Posts
- 2019
- 2018
- December (1)
- November (1)
- October (1)
- August (2)
- July (4)
- June (3)
- May (1)
- April (2)
- March (2)
- February (1)
- January (5)
- 2017
- December (3)
- November (1)
- October (2)
- September (3)
- August (2)
- July (2)
- June (1)
- May (2)
- March (3)
- February (3)
- January (3)
- 2016
- November (2)
- September (4)
- August (2)
- July (6)
- June (2)
- May (3)
- April (1)
- March (2)
- February (3)
- January (2)
- 2015
- December (3)
- October (3)
- September (2)
- August (6)
- June (3)
- May (3)
- April (4)
- March (3)
- February (5)
- January (3)
- 2014
- December (1)
- November (1)
- October (3)
- September (4)
- August (3)
- July (3)
- June (2)
- May (2)
- April (2)
- March (1)
- 2013
- 2012
- 2011
- My blog
- Post new blog entry
- All blogs
Run 15 LED Signal Resolutions -- PART 1
NOTE: this blog post defines resolution as (gaussian fit sigma) / (gaussian fit mean); the update to this blog post, found HERE, uses the definition (distribution RMS) / (distribution mean)
============================================================================
Resolution from December 2014:
Run Number: 15353003
- all large cells: 2.38%
- large cells without edges: 1.96%
- russian cells: 3.31%
- yale cells: 21.0%
- If I only look at yale cells which have resolution < 10%, which is about ~75% of them, the average resolution is then 3.07%
- A lot of these high resolution yale cells had TWO ADC peaks; the gaussian fit attempted to fit both of them
============================================================================
Resolution from January 2015:
3 run sets were analysed with varying HV settings:
5 runs on Day 17 -- MAGNET OFF
13 runs on Day 20 -- MAGNET OFF
13 runs on Day 21 -- MAGNET ON
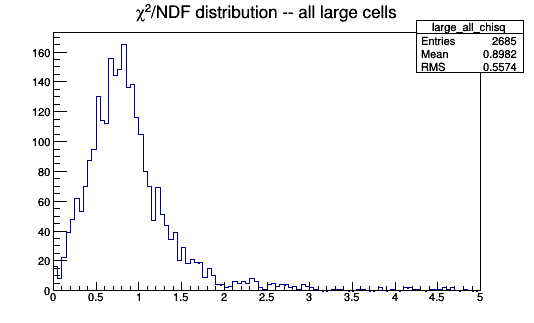
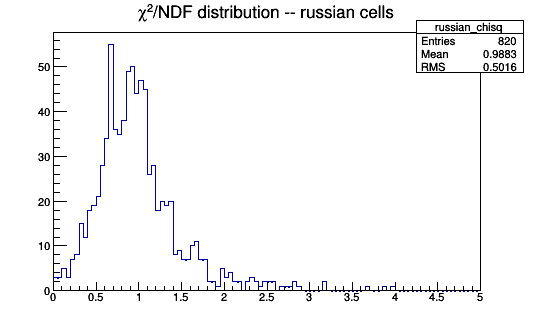
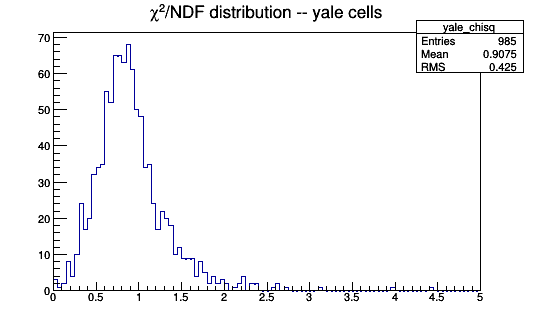
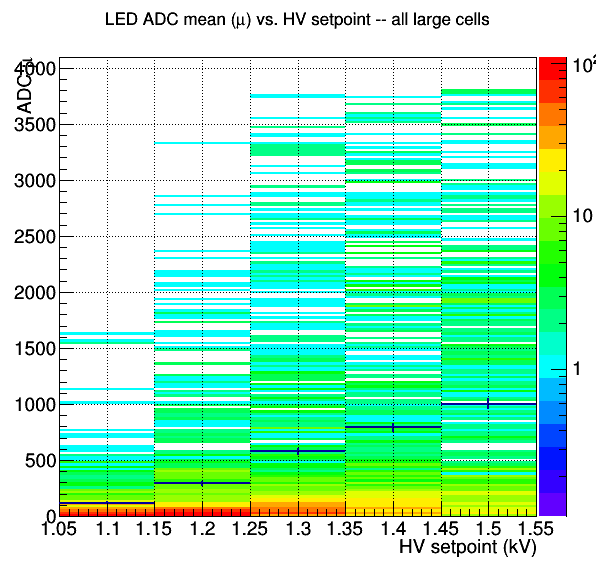
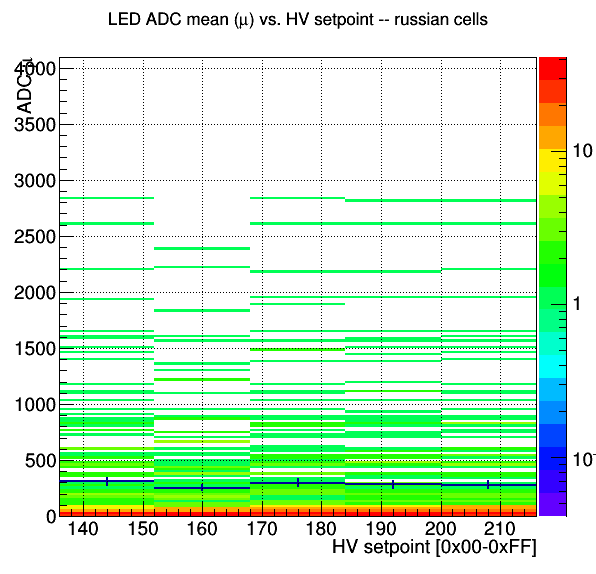
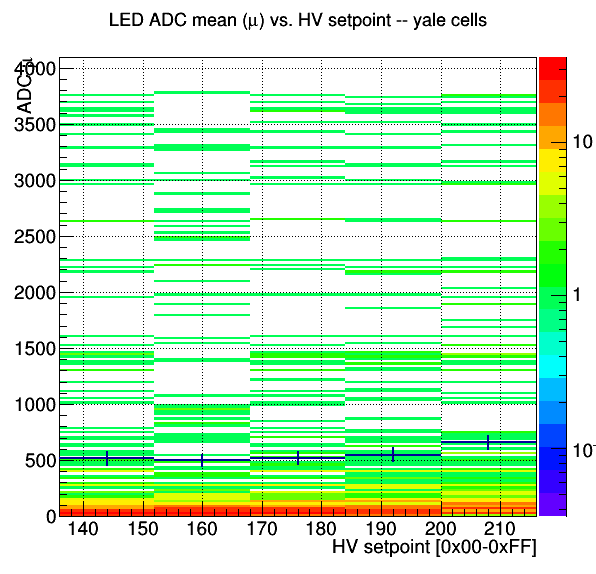
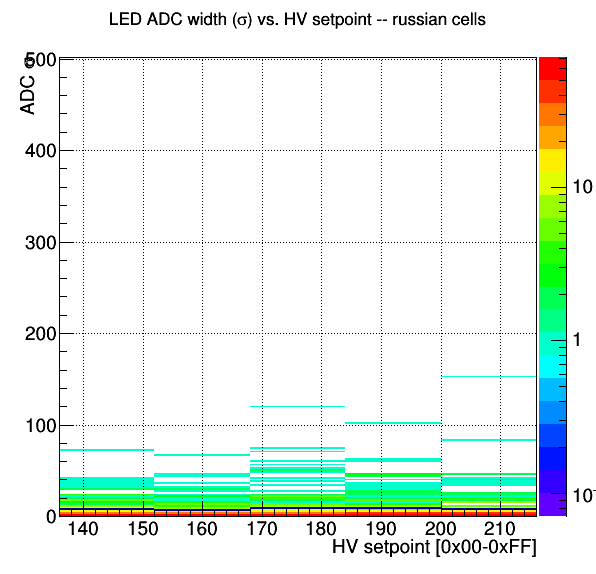
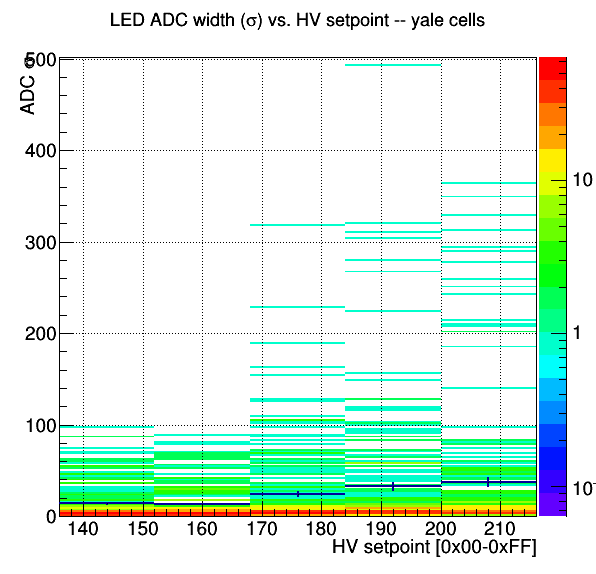
Each row of images is for Day 17, Day 20, Day 21, in order from left to right. Right most image is for when STAR magnet was on
Note for Day 20 runs: last three runs all had large cell HV setpoint 1.6 kV; lost communication with NSTB 4 for small cell HV setpoints {E0,E8,F0,F8,FF};
NSTB 4 for these runs have been filtered out of the distributions below, but the communcation loss may have also messed up NSTB 3, which is not filtered out
.
.
CHISQ/NDF DISTRIBUTIONS
.png)
.png)
.png)
.png)
.png)
.png)
.
.
ADC MEAN vs HV SETPOINT
.png)
.png)
.png)
.png)
.png)
.png)
.
.
ADC WIDTH (sigma from gaussian) vs. HV SETPOINT

.png)
.png)
.png)
.png)
.png)
.png)
.
.
RESOLUTION (sigma/mean) vs. HV SETPOINT
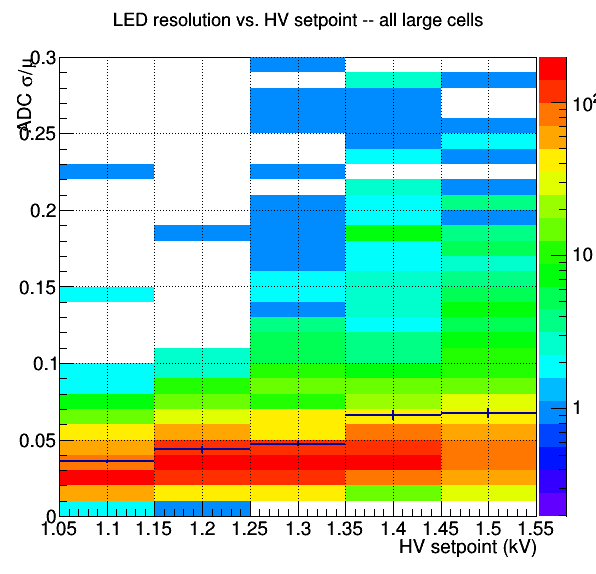
.png)
.png)
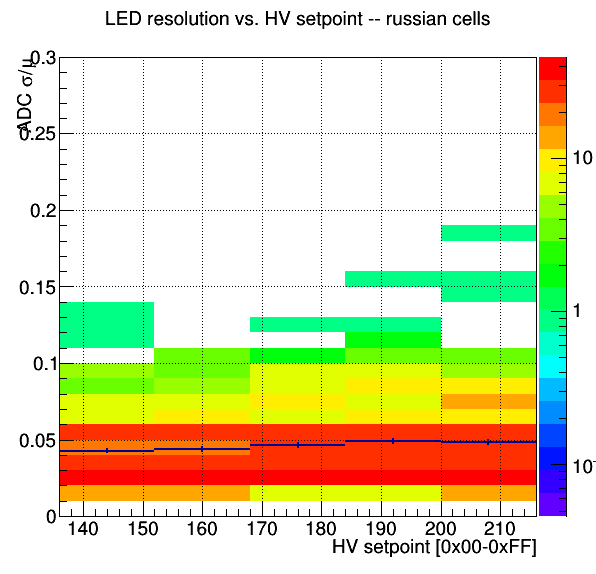
.png)
.png)
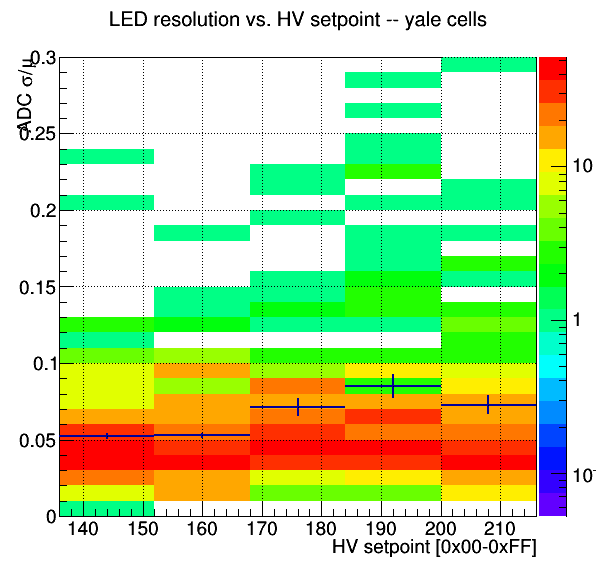
.png)
.png)
.
.
==============================================================================
.
.
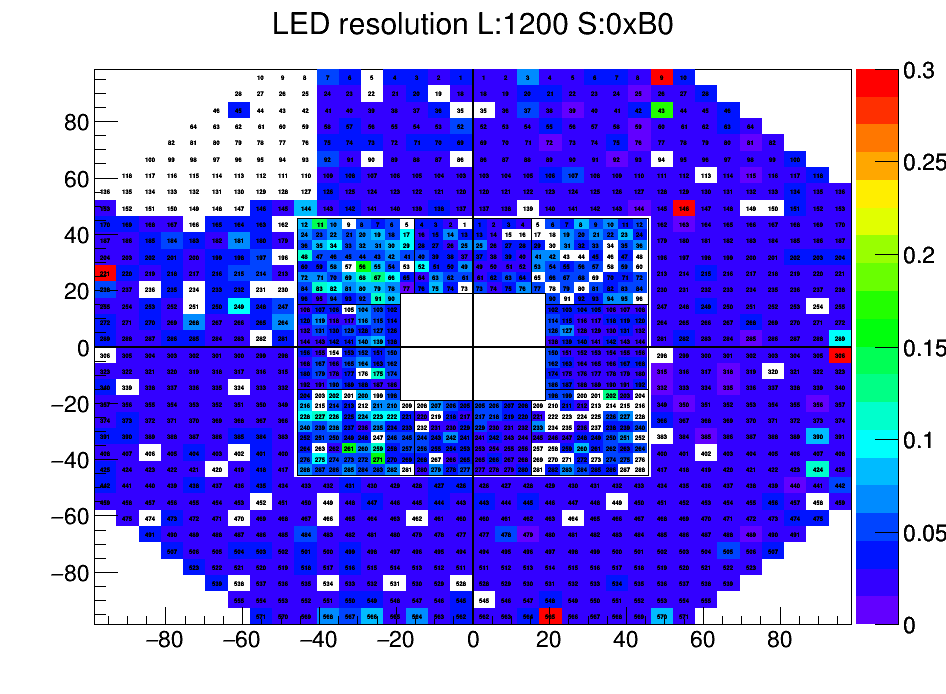
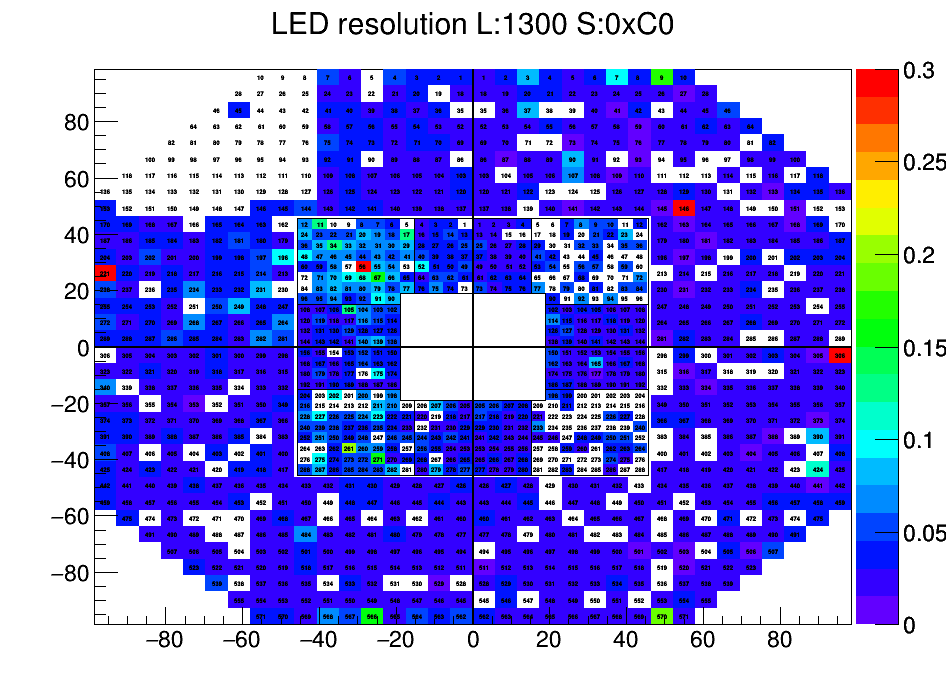
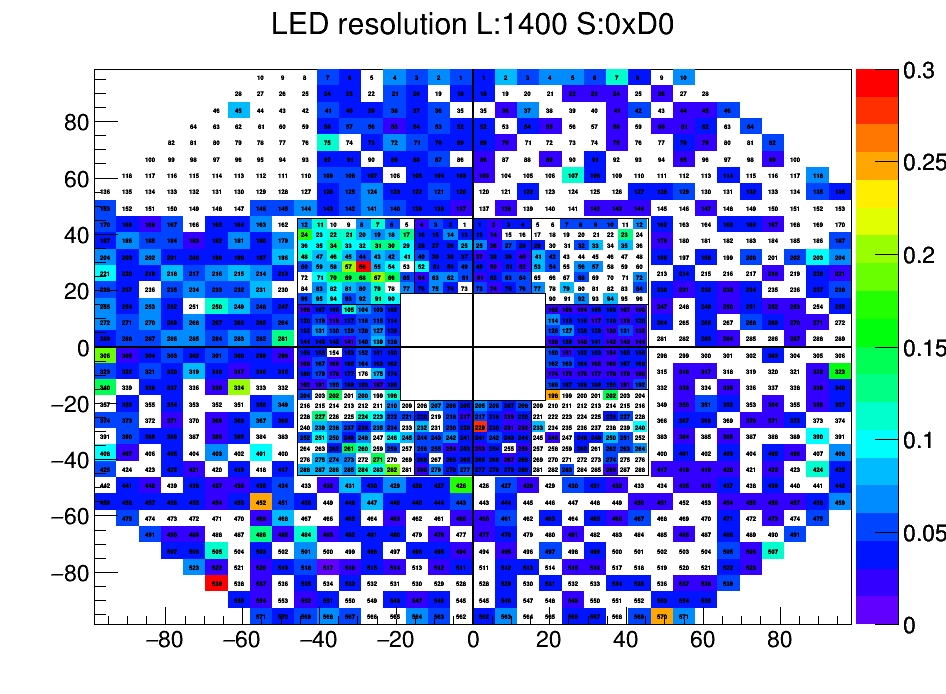
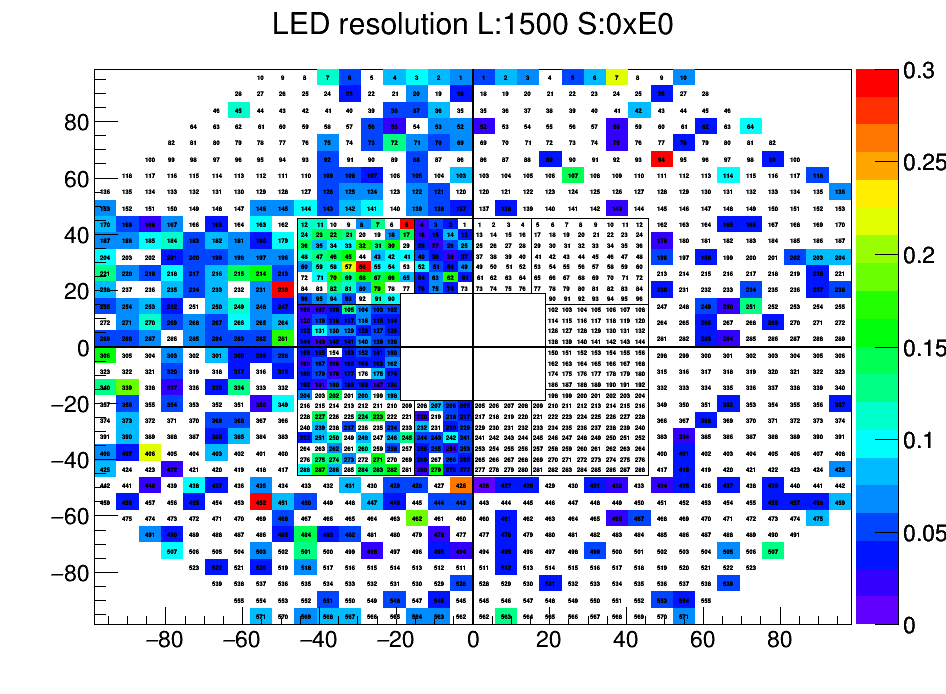
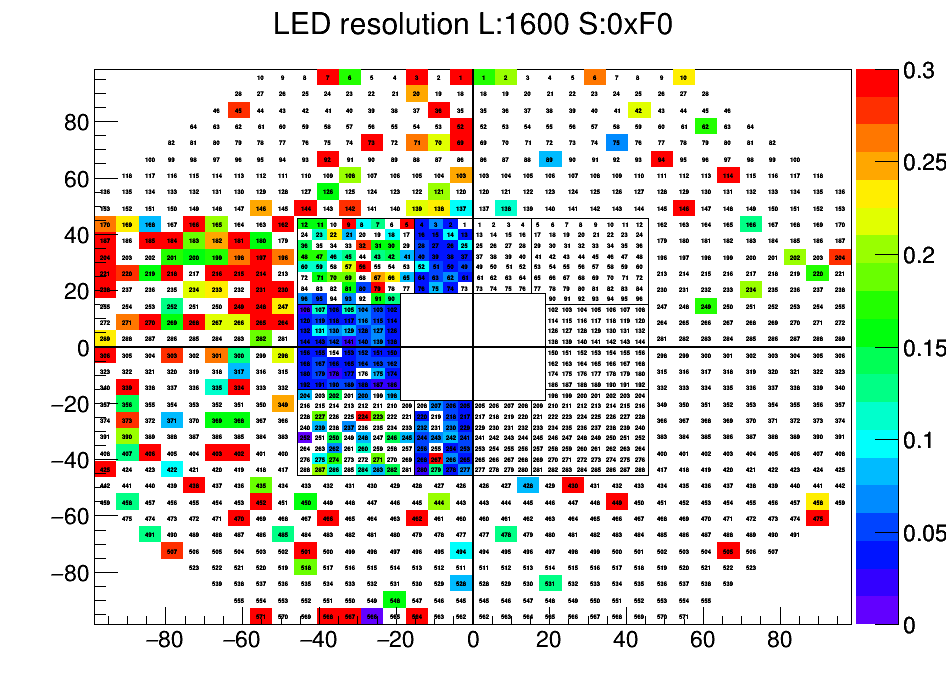
LED resolutions for each channel
[left: Day 20] [right: Day21]
Note: to enlarge these images: Right click --> open image in new tab
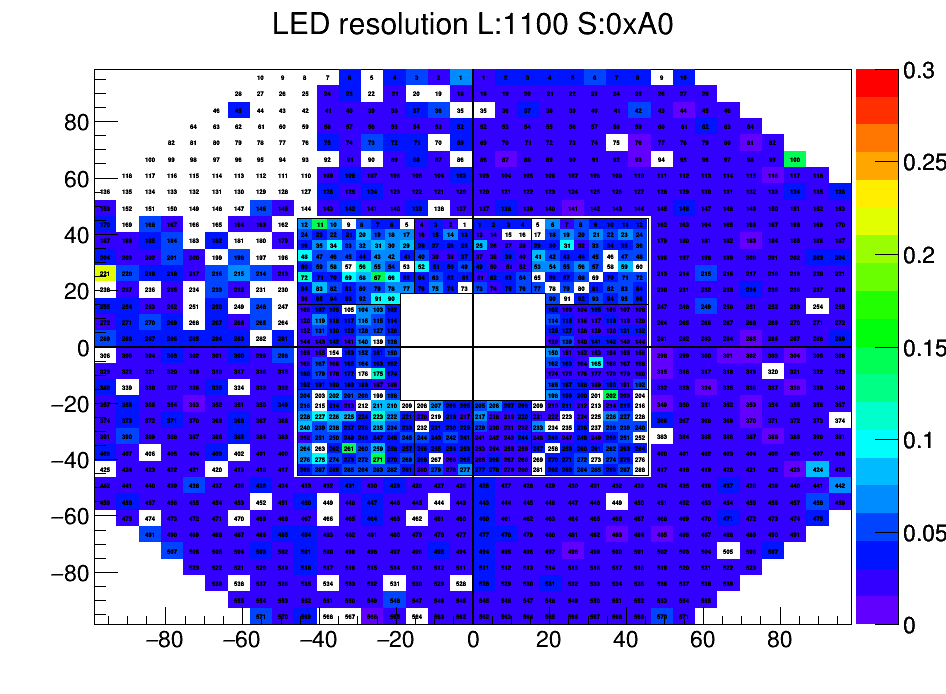
.png)
.png)
.png)
.png)
.png)
.png)
- dilks's blog
- Login or register to post comments
