Sti Geometry Test
This page describes the Sti geometry test with the tool provided by Gene (see the following link).
https://drupal.star.bnl.gov/STAR/blog/genevb/track-track-comparisons-using-trackinfo-mode-spacecharge-code
A) Test with real data
1) Default chain option "P2014a,btof,BEmcChkStat,Corr4,OSpaceZ2,OGridLeak3D,SCScalerCal,goptSCE100051,-hitfilt"
2) Chain without PXL geometry "P2014a,btof,BEMCChkStat,Corr4,OSpaceZ2,OGridLeak3D,SCScalerCal,goptSCE100051,-hitfilt,-StiPxl,-PxlIT"
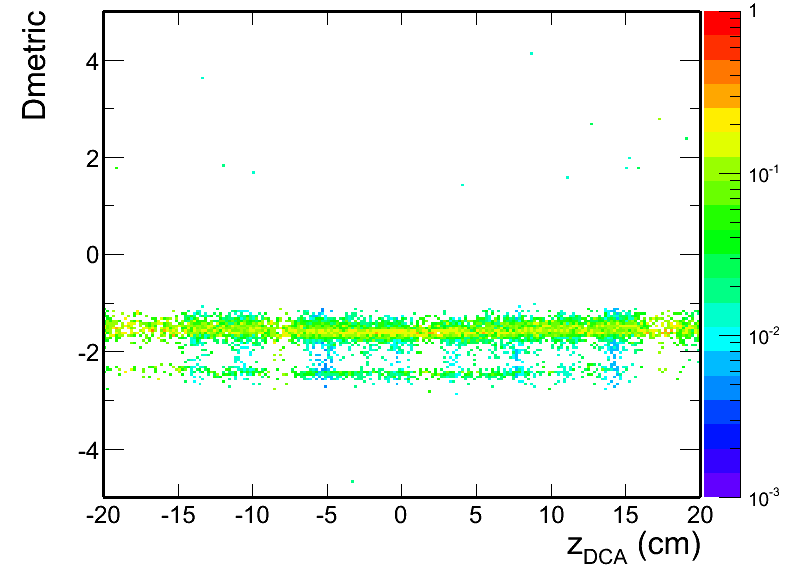
The following plots (with two different z_DCA scales) show the Dmetric parameter vs z_DCA (difference is 1)-2)).
Data is first 1000 events in /star/data03/daq/2014/047/15047100/st_physics_15047100_raw_2500001.daq. Dmetric is defined in Gene's page linked above.
.png)
B) Test with simulation
Here shows some test results with the simple simulation with the Y2014 geometry. 100 pions per events (0-10GeV/c in pT flat, (-1,1) in eta flat), |Vz|<5cm).
2) Chain without PXL geometry
(double checked that the detector groups are enabled/disabled as desired according to the log files)
.png)
Notes:
a) The different signs between data and MC are confirmed to be the magnetic field settings (RFF in data vs FF in simulation).
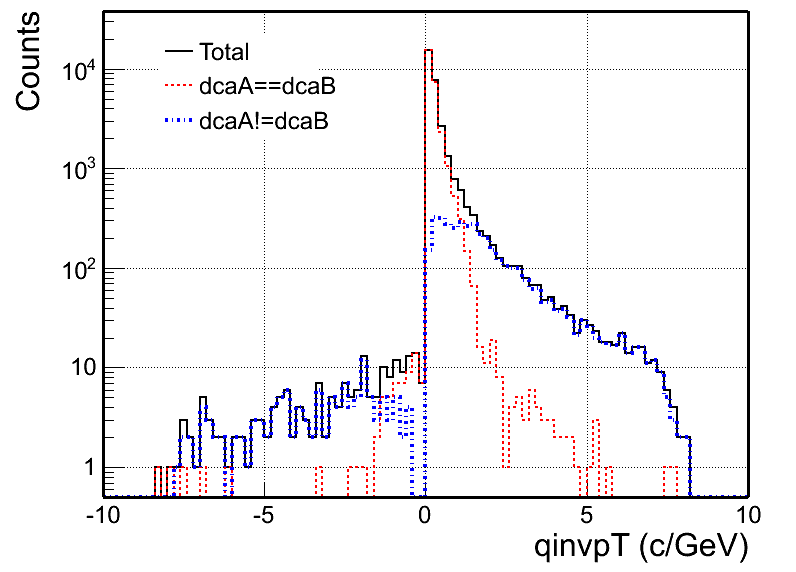
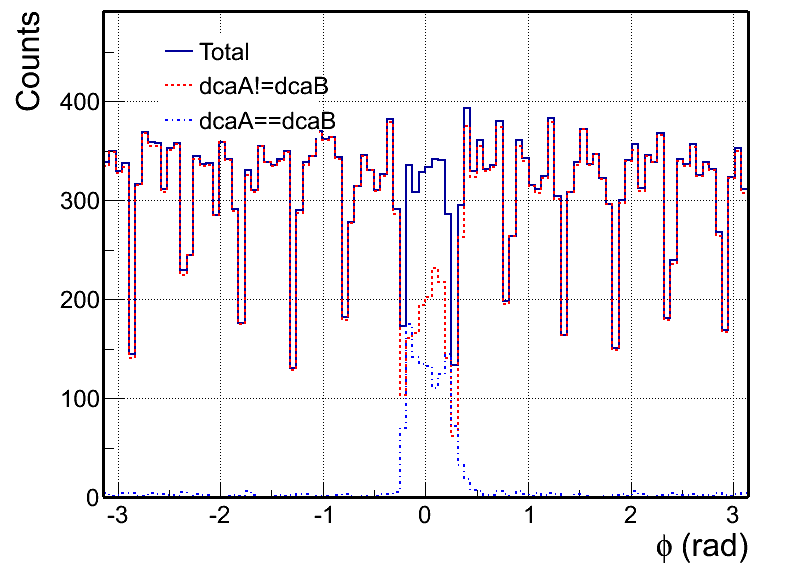
b) The fraction of tracks that have different dca values are significantly lower in this simulation. The reason is because of the input pT distribution in simulation is flat. The dca difference goes with 1/pT^2 and the Dmetric parameter was trying to use the scaled dca (dca*pT^2), but since the dca difference is tiny while in the log file the precision is only stored upto 1 micron level. The recorded dca values will be the same then.
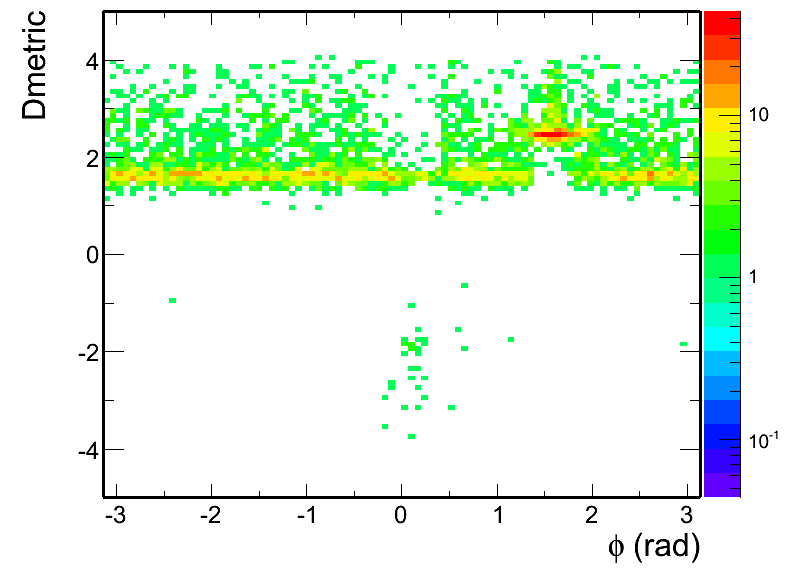
c) One more issue noticed when looking at the phi dependence, here is the plot. There seem to be some access material around Pi/2 (and at phi~0, the material seems to be slighly less counted).
=============
Update on May 15
=============
The small fraction of pairs with dcaA!=dcaB noted above in simulation is now understood. It is because that this simulation sample used a flat pT input while the SC log output in the default version limits the DCA output precision (up to 1 micron).
I modified the StSpaceChargeEbyEMaker output line (line 536) from
to
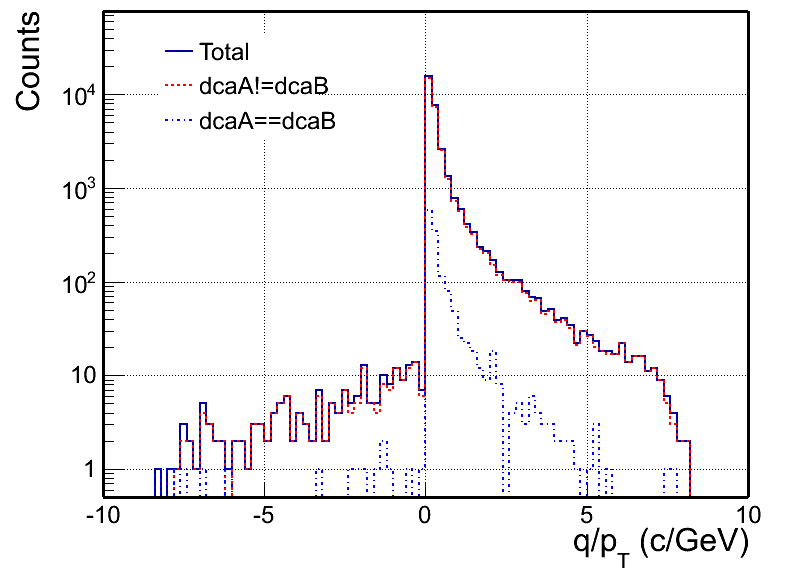
The peak around Pi/2 in phi and depletion around 0 are still there, although looking at the phi 1D distribution, you will not notice the one in Pi/2.
.png)
- dongx's blog
- Login or register to post comments
