- genevb's home page
- Posts
- 2025
- 2024
- 2023
- 2022
- September (1)
- 2021
- 2020
- 2019
- December (1)
- October (4)
- September (2)
- August (6)
- July (1)
- June (2)
- May (4)
- April (2)
- March (3)
- February (3)
- 2018
- 2017
- December (1)
- October (3)
- September (1)
- August (1)
- July (2)
- June (2)
- April (2)
- March (2)
- February (1)
- 2016
- November (2)
- September (1)
- August (2)
- July (1)
- June (2)
- May (2)
- April (1)
- March (5)
- February (2)
- January (1)
- 2015
- December (1)
- October (1)
- September (2)
- June (1)
- May (2)
- April (2)
- March (3)
- February (1)
- January (3)
- 2014
- December (2)
- October (2)
- September (2)
- August (3)
- July (2)
- June (2)
- May (2)
- April (9)
- March (2)
- February (2)
- January (1)
- 2013
- December (5)
- October (3)
- September (3)
- August (1)
- July (1)
- May (4)
- April (4)
- March (7)
- February (1)
- January (2)
- 2012
- December (2)
- November (6)
- October (2)
- September (3)
- August (7)
- July (2)
- June (1)
- May (3)
- April (1)
- March (2)
- February (1)
- 2011
- November (1)
- October (1)
- September (4)
- August (2)
- July (4)
- June (3)
- May (4)
- April (9)
- March (5)
- February (6)
- January (3)
- 2010
- December (3)
- November (6)
- October (3)
- September (1)
- August (5)
- July (1)
- June (4)
- May (1)
- April (2)
- March (2)
- February (4)
- January (2)
- 2009
- November (1)
- October (2)
- September (6)
- August (4)
- July (4)
- June (3)
- May (5)
- April (5)
- March (3)
- February (1)
- 2008
- 2005
- October (1)
- My blog
- Post new blog entry
- All blogs
Residuals of membrane-crossing tracks
This is a comparison of TPC residuals in SL09g vs. the current DEV (as of May 20, somewhere between SL10g and SL10h) using StiPulls, triggered by some Understanding Track <z> Distribution Justin Stevens has done with the Run 9 pp500 data showing a prominent group of tracks which start near the central membrane. I processed one file (with 250 events) in the two libraries:
root4star -b -q -l 'bfc.C(10000,
  "pp2009c ITTF VFPPVnoCTB BEmcChkStat beamLine Corr4 OSpaceZ2 OGridLeak3D -dstout -evout StiPulls",
  "/star/data03/daq/2009/Weve/sampler100/st_W_10090047_raw_7170001.daq")'
I then plotted three quantities versus hit Z for reasonable quality tracks (including some anti-pile-up cuts) crossing the central membrane.
- top: Profile of sqrt(resx2+resz2)
- middle: Spread profile of resx
- bottom: Spread profile of resz
where resx is the residual along the padrows and resz is the residual in the drift (z) direction, and "Spread profile" means error bars represent RMS, not error on the mean, as with "Profile". SL09g is first (left), and DEV is second (right), scales are in [cm]:
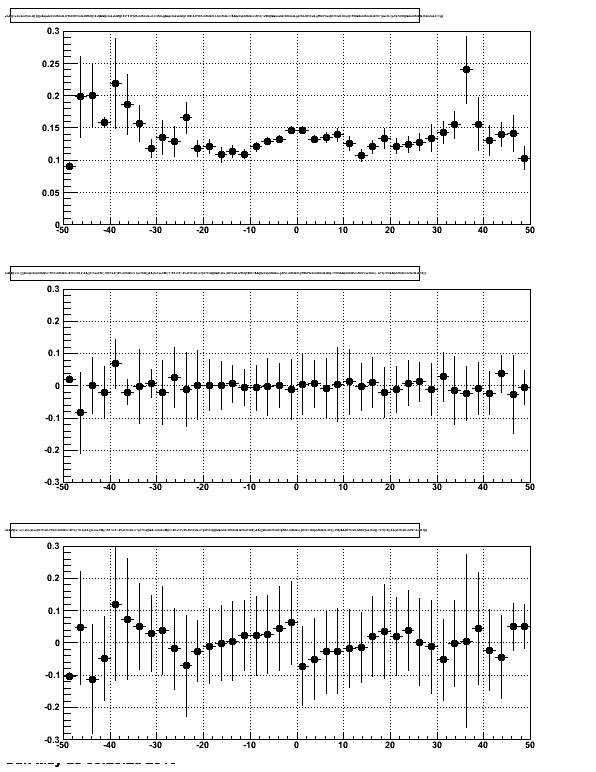
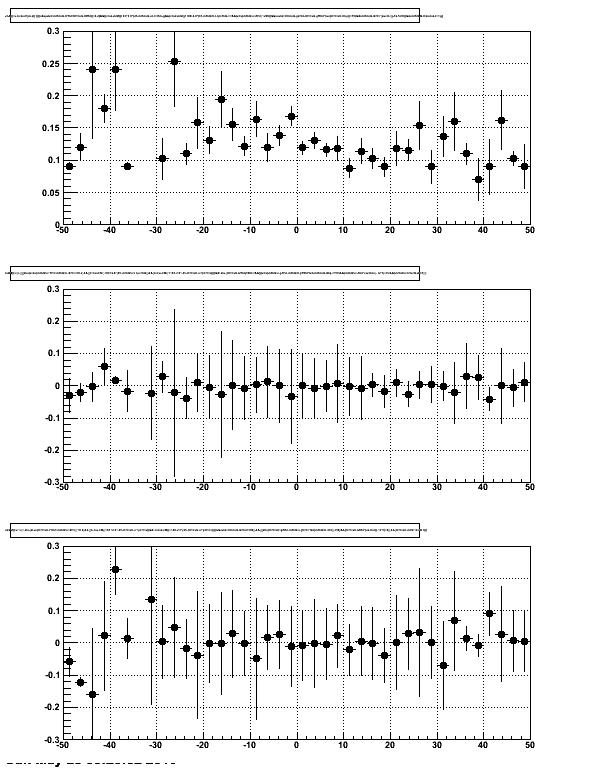
The error bars in the profile plot reveal the fact that many more tracks passed my cuts for SL09g than DEV (2400 vs. 686), leading to a fair bit of scatter in the dev plot. This appears to be mainly a difference in the impact of the "mHitsG.mVertex==1" cut I use to select hits on global tracks which have a primary partner with the highest ranked primary vertex. I am not sure of the reason for this impact. Vertex ordering issues were resolved before SL09g.
But the biggest issue revealed is the over 1 mm difference in resz across the central membrane in SL09g which, for some reason, is not apparent in DEV. This is true for all sectors, but particularly at smaller radii. This is demonstrated by these plots of resz vs. phi and z and vs. padrow and z (here I used only two z bins between -10 and +10 cm to emphasize the region of difference), and then vs. padrow and z again with more z bins.
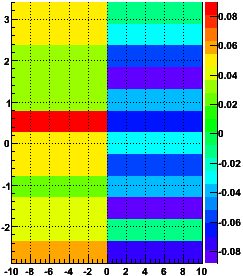
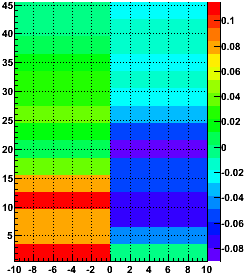
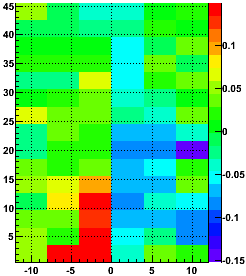
Sector 20 is the red bin in the phi plot and is often a questionable sector. It and the opposing sector 4 are excluded from the padrow plot, but all sectors show an east-west difference anyhow. It is curious that the bigger resz shifts appear further out in radius for the west (z > 0) half than the east (z < 0).
No DbV timestamp was used in my production, so the DB values should be the same. I found that not to be strictly true in that there somehow appear to be default tpcSectorPosition entries for 20081215, one of which ends up being used for sector 11 only (since the calibration of sector 11 was unsuccessful for Run 9 data and a new DB value is not used). However, I have not found any 20081215 entries in either the DB or in the CINT files under $STAR. ??? Regardless, that issue is not affecting all sectors as is the difference in resz.
Drift velocity would be an obvious first guess, but these appear to be the same. Nor do I see any difference in any TPC T0s and clock frequency loaded and listed. StMagUtilities seems to use the same input parameters.
That leaves only code differences. Certainly there was a change for how StMagUtilities handles post-membrane hits, and some other changes for the StTpcHitMover code to be used in simulations. Whatever the changes were, perhaps we're simply getting a better match now with the mVertex cut to the triggered primary vertex and this is giving us less pile-up tracks?
For now it's not clear to me why this difference has gone away....
Meanwhile, there is good news in seeing no significant artifacts in the residuals along the padrows, resx!
-Gene
Groups:
- genevb's blog
- Login or register to post comments