EPD Timing Scan - Comissioning 2025
Updated on Sun, 2025-06-15 15:50. Originally created by lisa on 2025-06-09 12:29.
9 June 2025 - EPD Timing Scan
We are following the standard procedure The 8 things we determine in this scan are the
And the other labels are derived from these according to
15 June 2025
It appears that the beam was poor, with many early hits in the West side, when we did our timing scan one week ago (before RHIC went down for several days), which is described below this section. We decided to go back to the timing for Au+Au 200 GeV that we had last year (specifically run 25295002), and it seems to work well. We are going to go with this. Here are the labels, which have been set as of 15 June 2025.
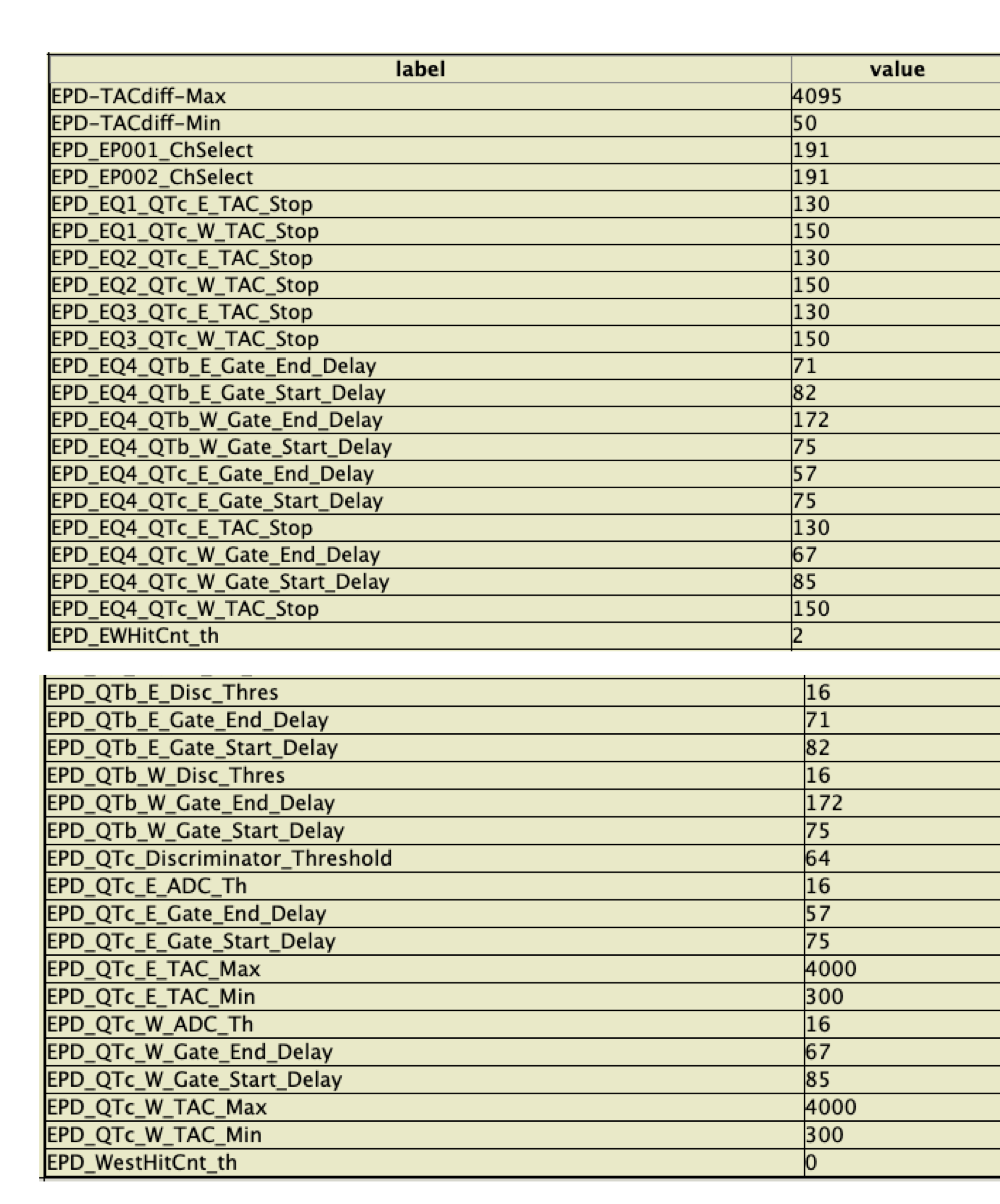
EPD labels taken from last year's Au+Au 200 GeV run (25295002)
This gives good MIP peaks in most tiles. We will chase down outliers. We did the TAC offsets (procedure here) with this as well, and the timing looks reasonable.
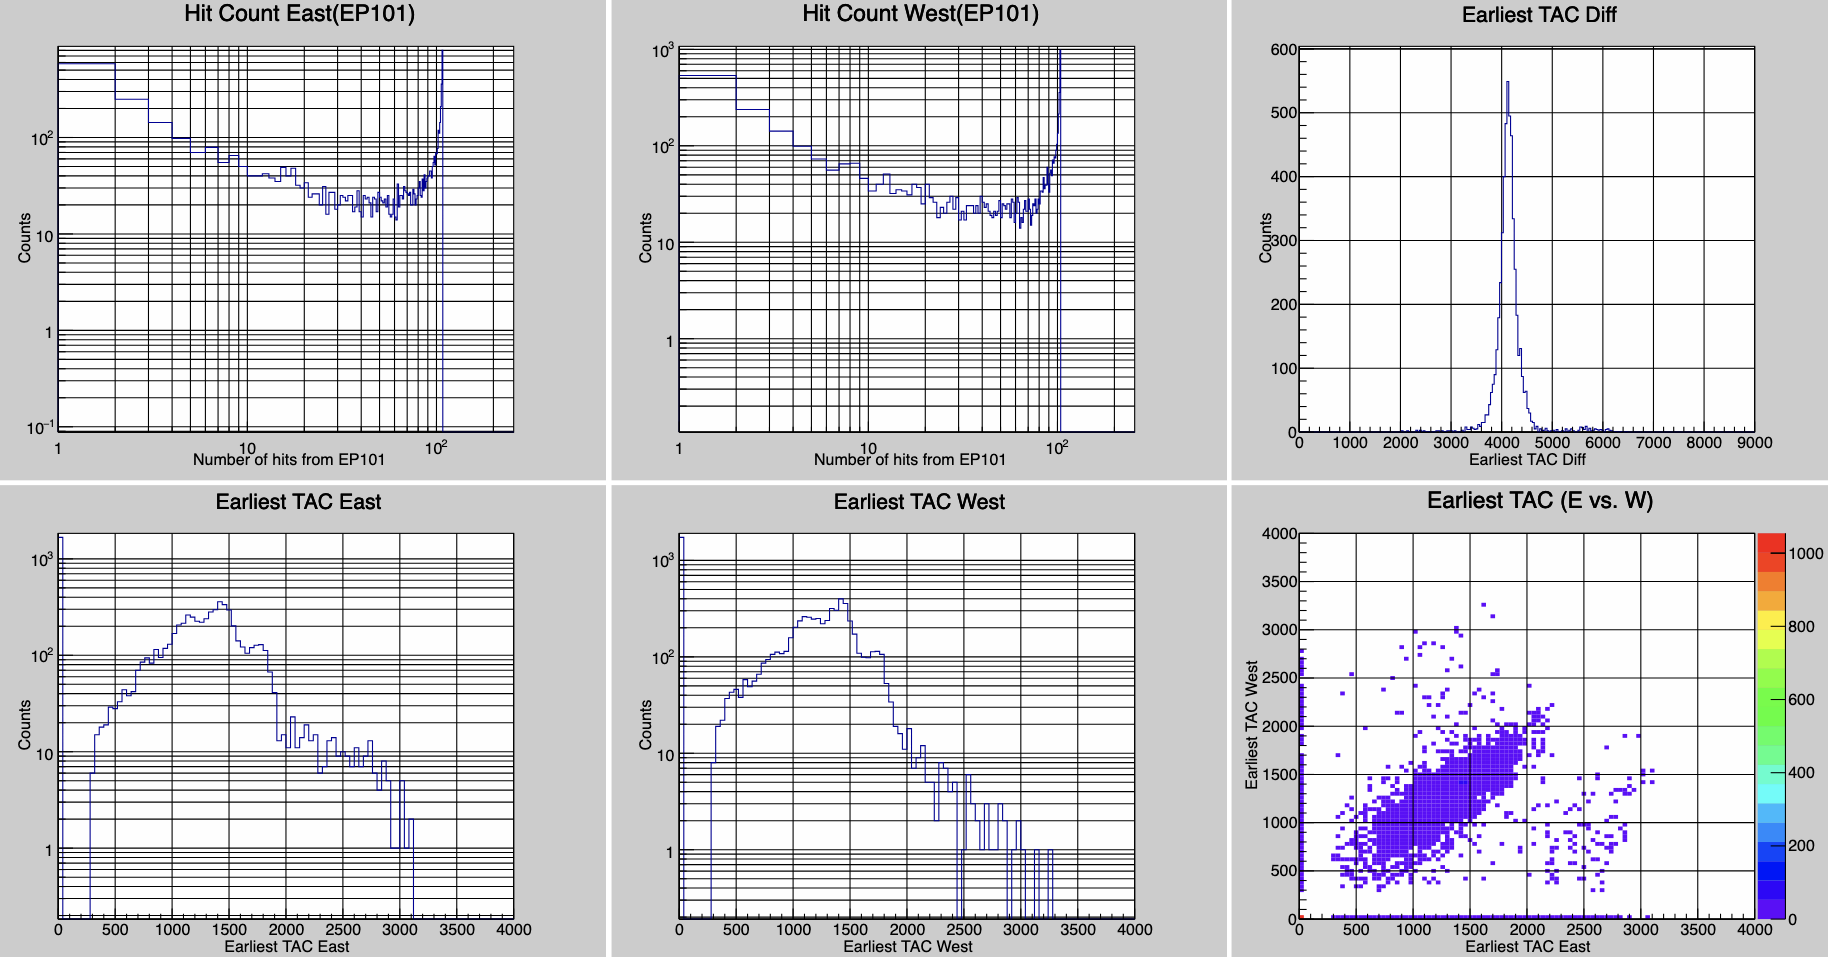
Online plots for run 26166047
https://online.star.bnl.gov/RTS/JEVP/protected/PHP/jevpViewer.php?run=26166047
What lies below this line is obsolete, so I'm making it grey.
Results.
The scan makes a big pdf file, attached at the bottom of this page (or click here). Here's what is shown: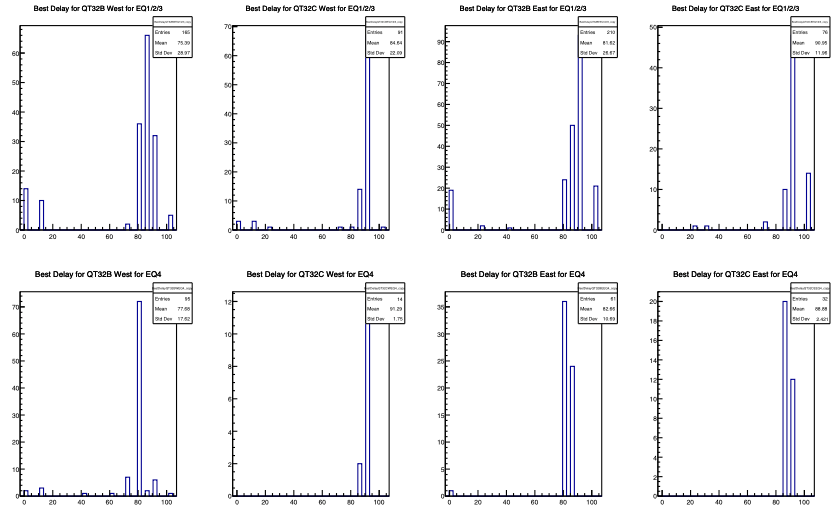
Now, we always want to "err" on the side of choosing a lower delay, since not all channels line exactly up, and if you go too far, you lose everything (see this example). So, this figure above suggests something like:
Crates 1,2,3:
Crate 4:
These results are a bit confusing. Because the West cables are now longer (because they go through a splitter to alllow the DEP electronics readout), we expect the START_DELAY to be larger for the West, by 5-10 ns. This is indeed what we saw last year. But now they look about the same as the East. Akio said today on zoom that there is early-time hits on the West side today, so maybe that is the cause. In any event, we will start with these and maybe adjust later.
There were all sorts of network problems today that really slowed us down. At some mid-point, we set the values as follows. (Note that crate 4 has same values as 1,2,3)
Crates 1,2,3:
Crate 4:
In the Gate Scan pdf you can get here, the final TPad on each page is the spectrum using those values. Basically, you just want to see that the peak using these values looks "fine." Scrolling through all 744 tiles, I'd say it looks about as good as the best, except for one case, which I show below:
That tile looks like crap anyway, so we are going to go with these values and move on to the bias scan, and maybe come back to it later when the beam is cleaner and the network more stable.
We are following the standard procedure The 8 things we determine in this scan are the
EPD_EQ4_QTb_E_Gate_Start_Delay
EPD_EQ4_QTb_W_Gate_Start_Delay
EPD_EQ4_QTc_E_Gate_Start_Delay
EPD_EQ4 QTc_W_Gate_Start_Delay
EPD_QTb_E_Gate_Start_Delay
EPD_QTb_W_Gate_Start_Delay
EPD_QTc_E_Gate_Start_Delay
EPD_QTc_W_Gate_Start_Delay
And the other labels are derived from these according to
- QTB_STOP = QTB_START - 11
- QTC_STOP = QTC_START - 18
- TAC_STOP = 2*START - 20
15 June 2025
It appears that the beam was poor, with many early hits in the West side, when we did our timing scan one week ago (before RHIC went down for several days), which is described below this section. We decided to go back to the timing for Au+Au 200 GeV that we had last year (specifically run 25295002), and it seems to work well. We are going to go with this. Here are the labels, which have been set as of 15 June 2025.
EPD labels taken from last year's Au+Au 200 GeV run (25295002)
This gives good MIP peaks in most tiles. We will chase down outliers. We did the TAC offsets (procedure here) with this as well, and the timing looks reasonable.
Online plots for run 26166047
https://online.star.bnl.gov/RTS/JEVP/protected/PHP/jevpViewer.php?run=26166047
What lies below this line is obsolete, so I'm making it grey.
Results.
The scan makes a big pdf file, attached at the bottom of this page (or click here). Here's what is shown:
- The first page shows what runs are used for the scan
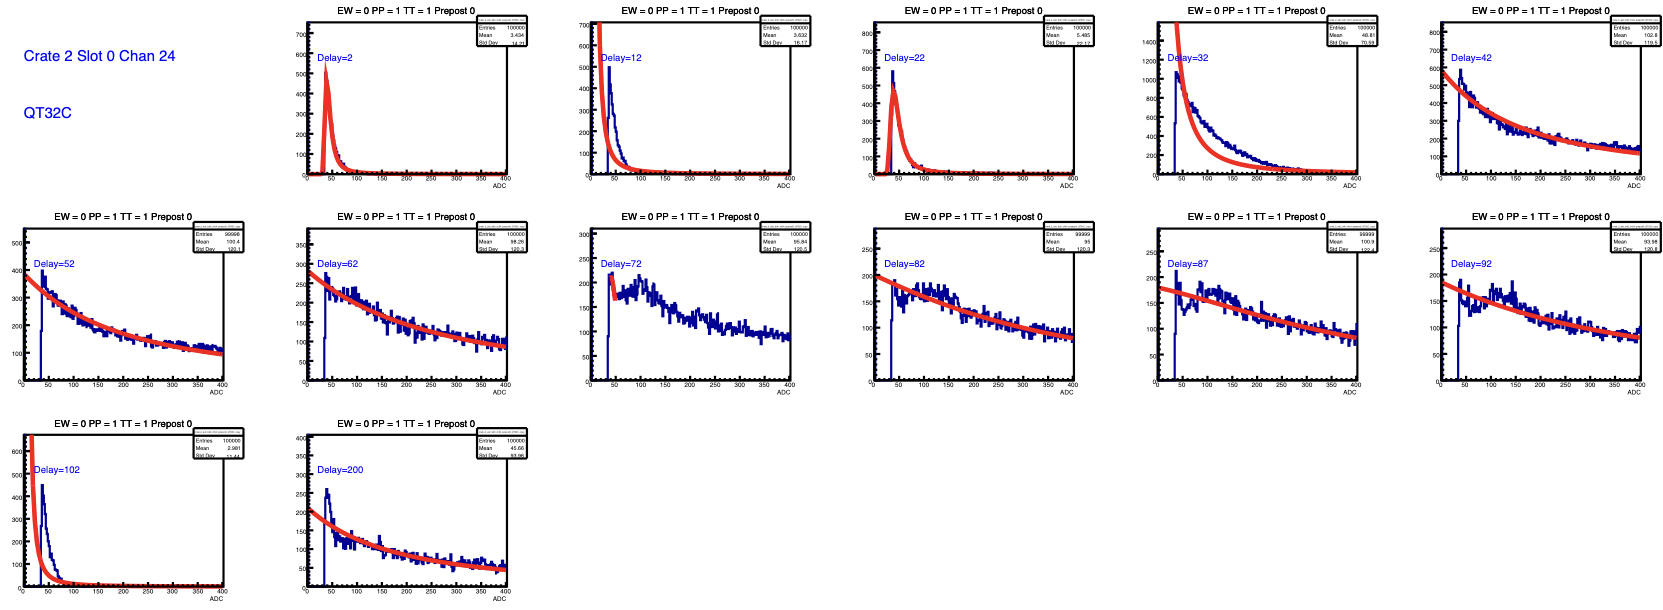
- The next 744 pages shows the ADC spectrum for each tile. There are several panels, each showing the spectrum for a different value of the START time. The MIP peak is fitted with a Landau, which usually works well but not always. (example here)
- The next 96 pages show the ADC value of the MIP peak, as a function of START time, for each channel (tile) in a given QT board (Crate and slot). This can be either 32 channels or 16, depending on whether it is a QTB or QTC. (example here)
- The next page (842) shows histograms of the "best" START value (giving maximum MIP peak ADC value), for each QT board. (example here)
- The last page (843) shows histograms of the "best" START value for the eight different labels (e.g. EPD_QTc_W_Gate_Start_Delay) that we have to set.
Here is what that gives:
Now, we always want to "err" on the side of choosing a lower delay, since not all channels line exactly up, and if you go too far, you lose everything (see this example). So, this figure above suggests something like:
Crates 1,2,3:
- B West - 78
- C West - 84
- B East - 78
- C East - 84
Crate 4:
- B West - 75
- C West - 84
- B East - 78
- C East - 82
These results are a bit confusing. Because the West cables are now longer (because they go through a splitter to alllow the DEP electronics readout), we expect the START_DELAY to be larger for the West, by 5-10 ns. This is indeed what we saw last year. But now they look about the same as the East. Akio said today on zoom that there is early-time hits on the West side today, so maybe that is the cause. In any event, we will start with these and maybe adjust later.
There were all sorts of network problems today that really slowed us down. At some mid-point, we set the values as follows. (Note that crate 4 has same values as 1,2,3)
Crates 1,2,3:
- B West -82
- C West -90
- B East -82
- C East -87
Crate 4:
- B West -82
- C West -90
- B East -82
- C East -87
In the Gate Scan pdf you can get here, the final TPad on each page is the spectrum using those values. Basically, you just want to see that the peak using these values looks "fine." Scrolling through all 744 tiles, I'd say it looks about as good as the best, except for one case, which I show below:
That tile looks like crap anyway, so we are going to go with these values and move on to the bias scan, and maybe come back to it later when the beam is cleaner and the network more stable.
»
- lisa's blog
- Login or register to post comments