Comparing ADC distributions from the Isobar and Au+Au data - 2018 run
Updated on Fri, 2018-05-11 14:13. Originally created by lisa on 2018-05-11 12:58.
Executive summary:
There had been a question whether the wider collision trains at low energies might be causing ~5% shifts in ADC spectra in the EPD. Here I show that even this small effect is not present, and that the response of the system, all the way to the ADC values, is completely the same for Isobar collisions at 200 GeV and Au+Au collisions at 27 GeV.
Some details
Yesterday, I posted an observation that the MIP peak positions (in particular, MPV values of single-MIP Landau fits) seemed to be about 5% lower in the Au+Au setup at 27 GeV, as compared to their values in the isobar run that just finished. We speculated that this could be caused by event-to-event gate timing that varies much more at the lower collision energies, so that some of our signal falls outside the gate.
It wasn't a big deal, but I decided to investigate. Below I show the ADC spectra from the two collision systems for the the odd-numbered tiles from West Position 1 (EW1PP01). This is one tile from each of the 16 "rings" of the EPD.
Clearly, the only difference is the higher multi-MIP probability in the Isobar run, due to the physics of higher energy collisions. The individual MIP peak itself is absolutely identical between the two systems. This is true for all tiles in all positions on both wheels, as you may see in this pdf file.
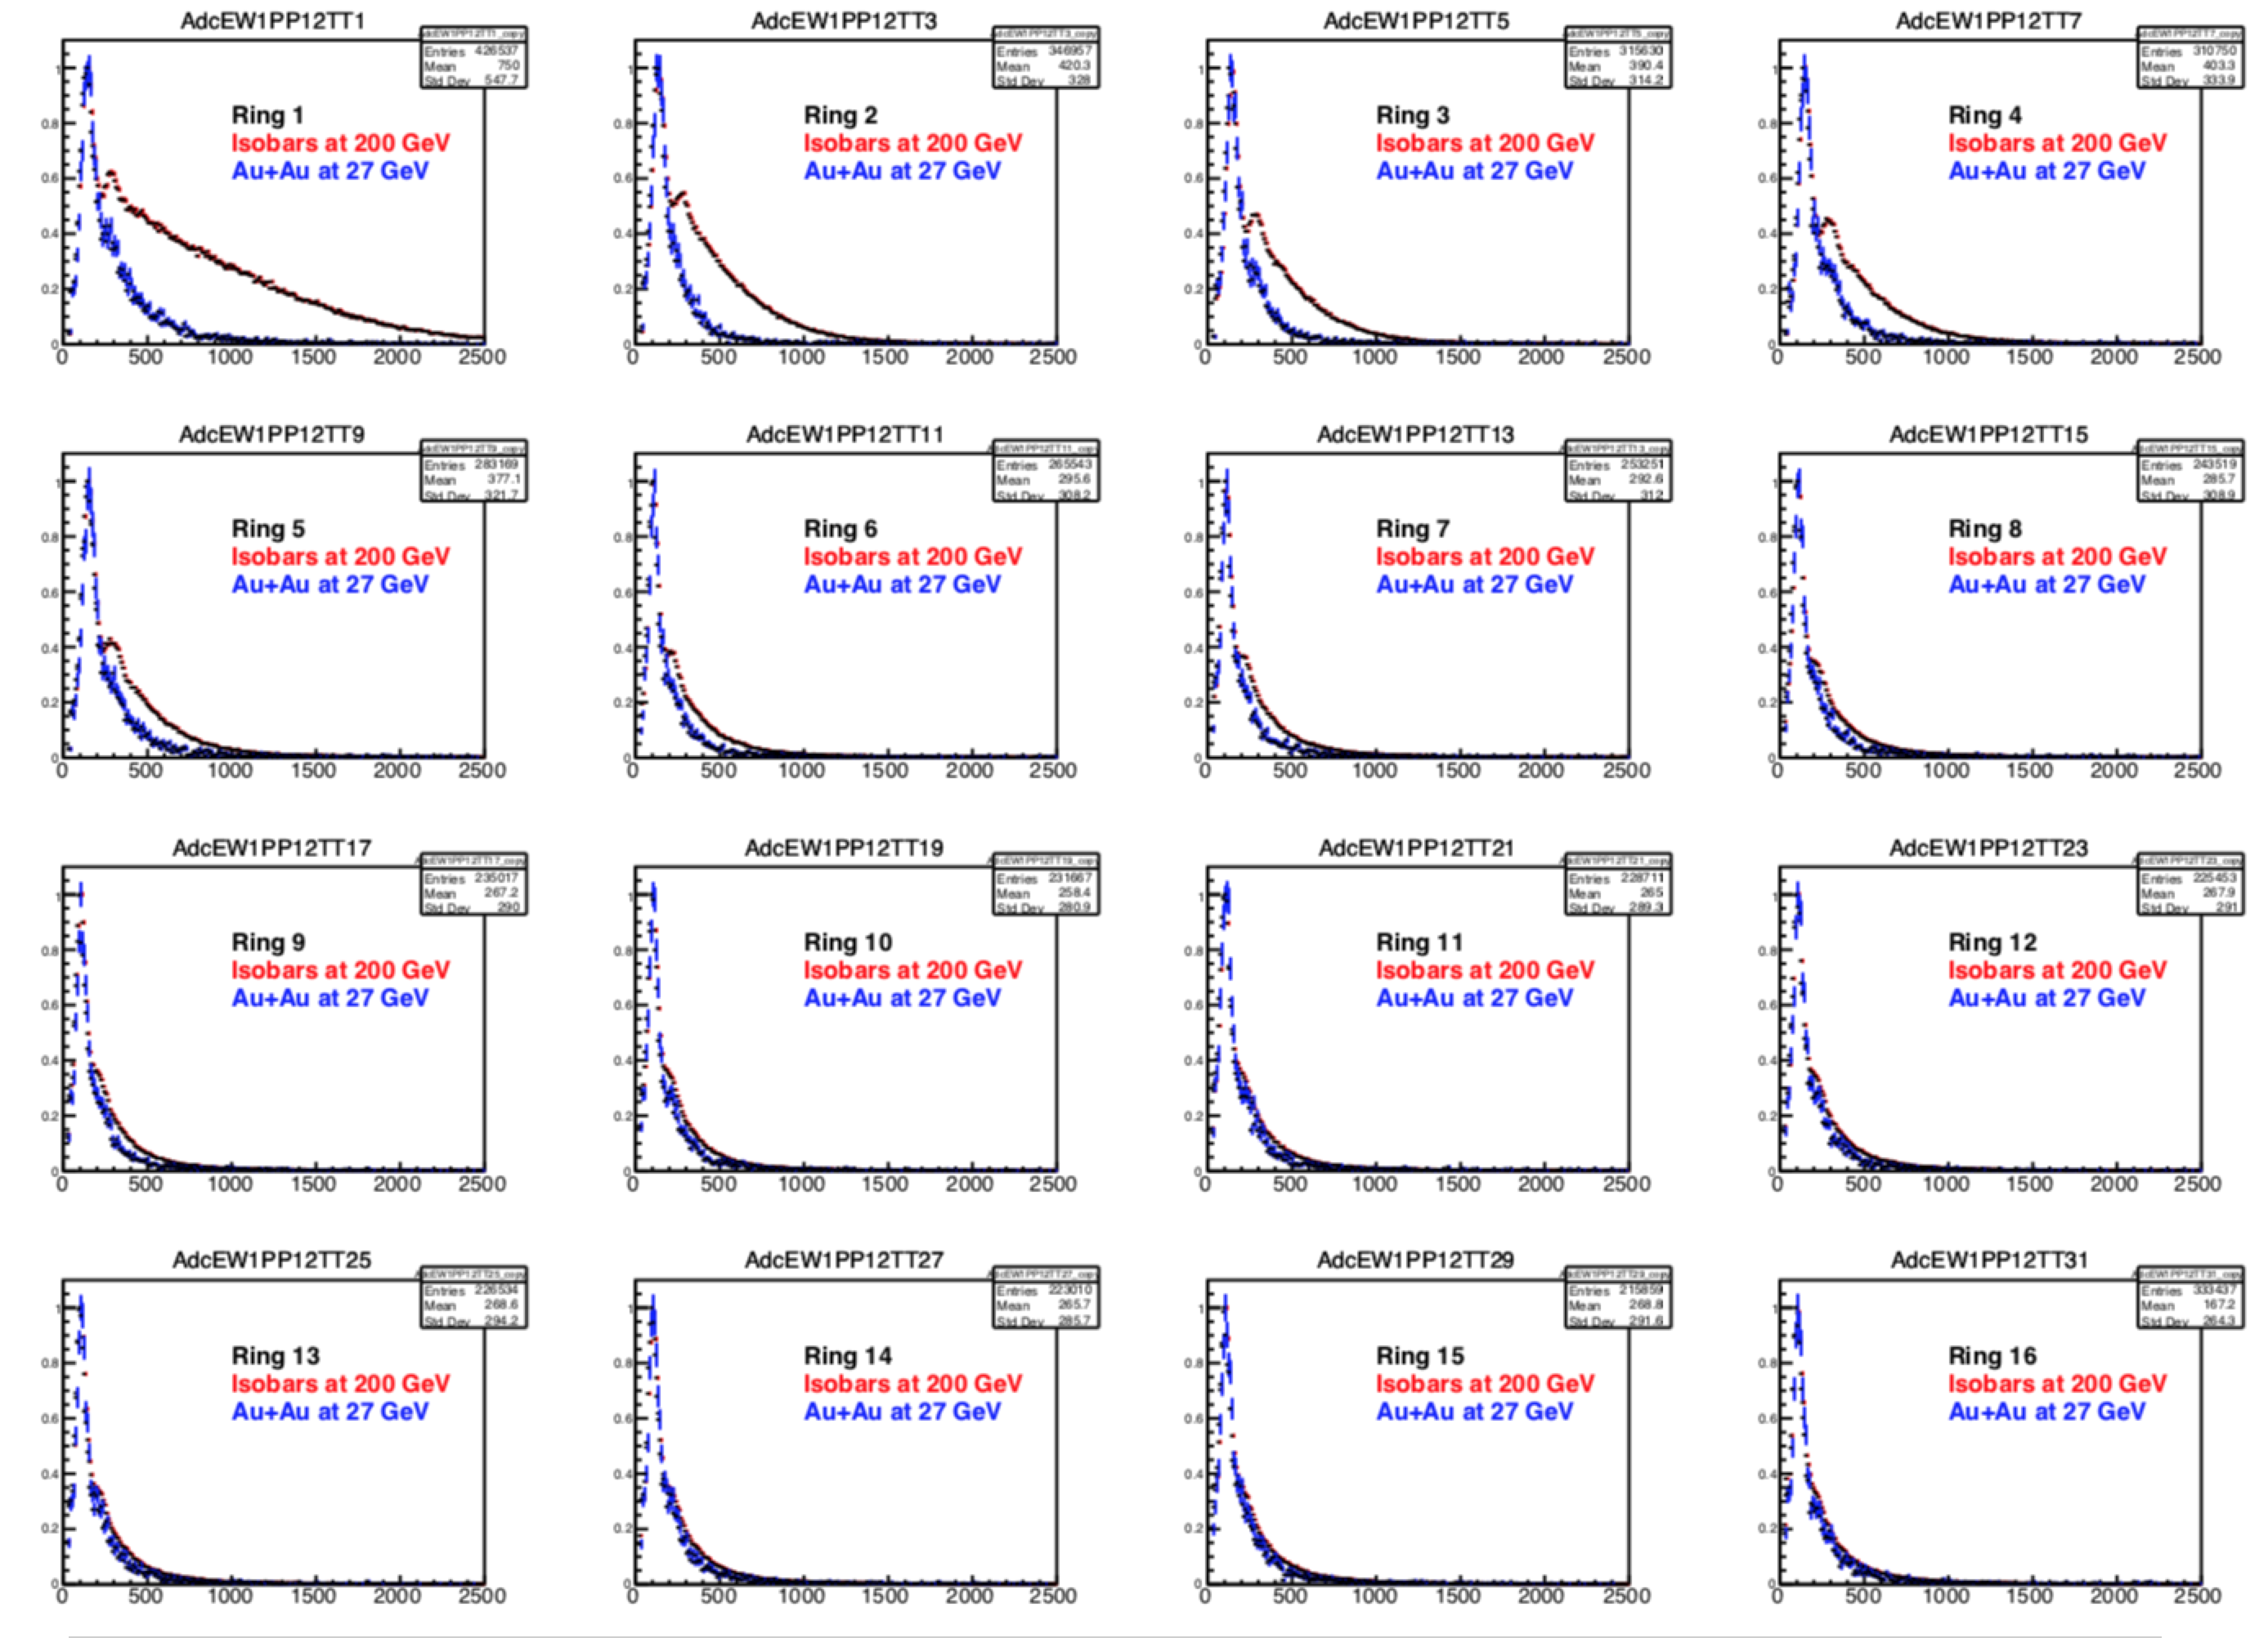
Figure 1 - Minimum bias ADC distributions for the odd-numbered tiles from West PP01. Isobar collisions (days 120-125) and Au+Au collisions (days 130-131) show identical response to a MIP (see figure 2 for zoomed-in view). The only difference is the increased probability for a multi-MIP event in the higher-energy collisions.
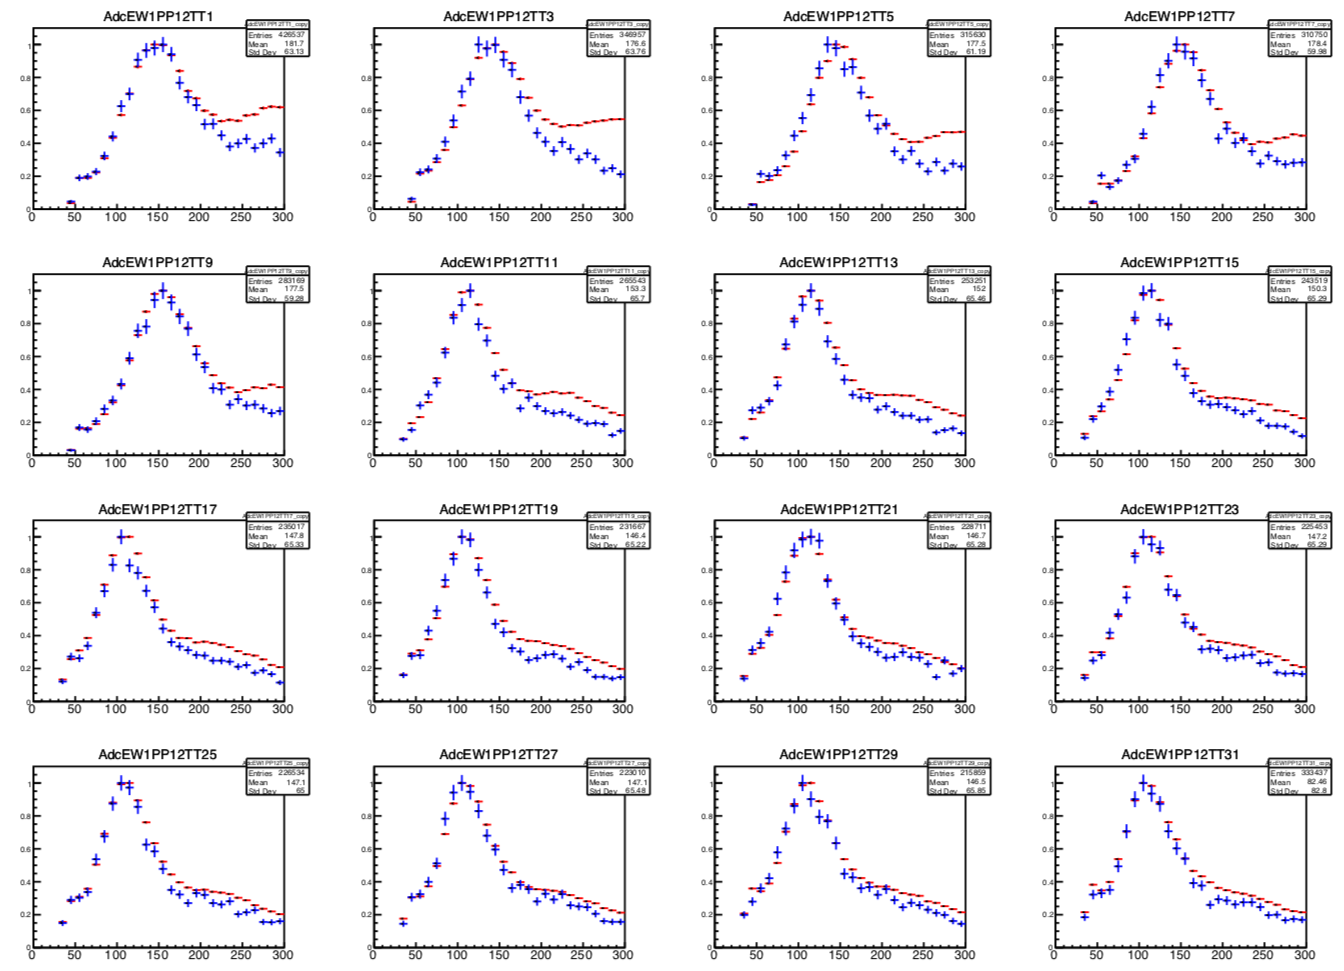
Figure 2 - Same as figure 1, except zoomed in to see the single-MIP peak in detail. As in figure 1, the red (blue) histogram is from isobar @ 200 GeV (Au+Au at 27 GeV).
Question: So, if everything is so rock-solid, what was the concern yesterday?
Answer: The apparent 5% reduction in peak position was due to (1) the increased multi-MIP probability in the isobar collisions, coupled with (2) the fact that I estimated the MIP position by fitting a single Landau function to a limited region around the peak. The increased yield at high ADC values "pulled" the fit to return a larger MPV for the isobar collisions. An example of the single-Landau fit over a limited range is shown in figure 3. Clearly, the peak position is captured only to some precision.
.png)
Figure 3 - One (of thousands) example of using a single Landau to fit the ADC distribution in a limited range around the peak. It works fine as an approximation to extract the peak position, as long as you don't need high precision.
Using single-Landau fits to extract tens of thousands (yes, with all the scans!) of peak positions is fast and perfectly fine for the precision required to determine bias voltages and have a rough online calibration, but you shouldn't be surprised at few-percent-level artifacts.
The real calibration will be done in the offline, through the database, in which case full multi-Landau fits will be used. These take a bit more tender loving care, but are straightforward. Figure 4 shows one such fit from the 2017 Au+Au data at 54 GeV:
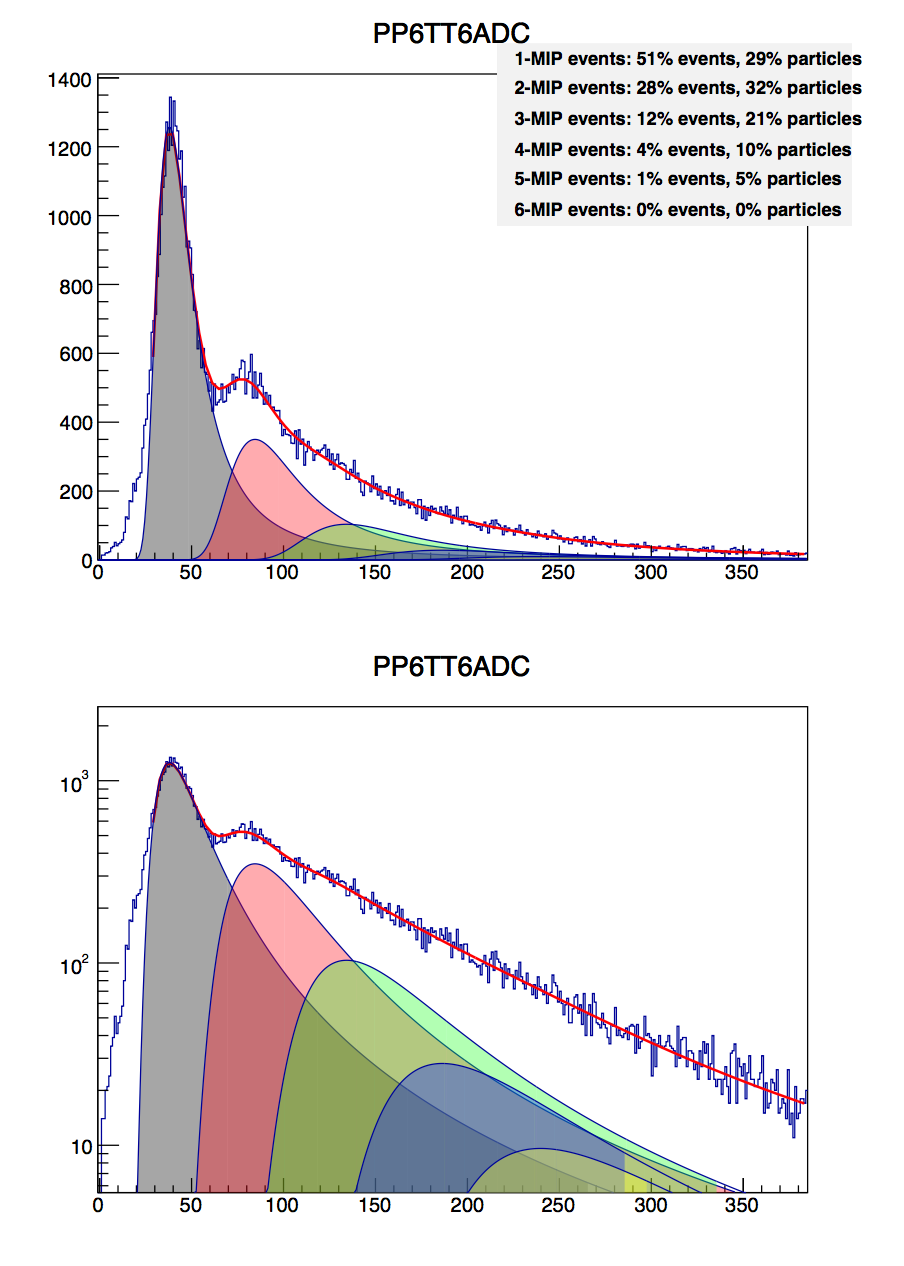
Figure 4 - ADC distribution from position 6, tile 6 of the quarter wheel installed in 2017, from Au+Au collisions at 54 GeV. Aside from the relative yields of the 1-, 2-, ... N-MIP events (of course), the only fit parameters are the value of the MPV and its width (WID). (WID/MPV is expected to be about 0.15 for 1.2-cm-thick plastic, and it is.) The 2-, 3-... N-MIP distributions (shown in colors) are trivial convolutions of the 1-MIP distribution.
There had been a question whether the wider collision trains at low energies might be causing ~5% shifts in ADC spectra in the EPD. Here I show that even this small effect is not present, and that the response of the system, all the way to the ADC values, is completely the same for Isobar collisions at 200 GeV and Au+Au collisions at 27 GeV.
Some details
Yesterday, I posted an observation that the MIP peak positions (in particular, MPV values of single-MIP Landau fits) seemed to be about 5% lower in the Au+Au setup at 27 GeV, as compared to their values in the isobar run that just finished. We speculated that this could be caused by event-to-event gate timing that varies much more at the lower collision energies, so that some of our signal falls outside the gate.
It wasn't a big deal, but I decided to investigate. Below I show the ADC spectra from the two collision systems for the the odd-numbered tiles from West Position 1 (EW1PP01). This is one tile from each of the 16 "rings" of the EPD.
Clearly, the only difference is the higher multi-MIP probability in the Isobar run, due to the physics of higher energy collisions. The individual MIP peak itself is absolutely identical between the two systems. This is true for all tiles in all positions on both wheels, as you may see in this pdf file.
Figure 1 - Minimum bias ADC distributions for the odd-numbered tiles from West PP01. Isobar collisions (days 120-125) and Au+Au collisions (days 130-131) show identical response to a MIP (see figure 2 for zoomed-in view). The only difference is the increased probability for a multi-MIP event in the higher-energy collisions.
Figure 2 - Same as figure 1, except zoomed in to see the single-MIP peak in detail. As in figure 1, the red (blue) histogram is from isobar @ 200 GeV (Au+Au at 27 GeV).
Question: So, if everything is so rock-solid, what was the concern yesterday?
Answer: The apparent 5% reduction in peak position was due to (1) the increased multi-MIP probability in the isobar collisions, coupled with (2) the fact that I estimated the MIP position by fitting a single Landau function to a limited region around the peak. The increased yield at high ADC values "pulled" the fit to return a larger MPV for the isobar collisions. An example of the single-Landau fit over a limited range is shown in figure 3. Clearly, the peak position is captured only to some precision.
Figure 3 - One (of thousands) example of using a single Landau to fit the ADC distribution in a limited range around the peak. It works fine as an approximation to extract the peak position, as long as you don't need high precision.
Using single-Landau fits to extract tens of thousands (yes, with all the scans!) of peak positions is fast and perfectly fine for the precision required to determine bias voltages and have a rough online calibration, but you shouldn't be surprised at few-percent-level artifacts.
The real calibration will be done in the offline, through the database, in which case full multi-Landau fits will be used. These take a bit more tender loving care, but are straightforward. Figure 4 shows one such fit from the 2017 Au+Au data at 54 GeV:
Figure 4 - ADC distribution from position 6, tile 6 of the quarter wheel installed in 2017, from Au+Au collisions at 54 GeV. Aside from the relative yields of the 1-, 2-, ... N-MIP events (of course), the only fit parameters are the value of the MPV and its width (WID). (WID/MPV is expected to be about 0.15 for 1.2-cm-thick plastic, and it is.) The 2-, 3-... N-MIP distributions (shown in colors) are trivial convolutions of the 1-MIP distribution.
»
- lisa's blog
- Login or register to post comments