Gate timing for the 2018 Au+Au 27 GeV run
Updated on Fri, 2018-05-11 14:55. Originally created by lisa on 2018-05-10 12:15.
Executive summary:
The single-MIP peaks for the Au27Au settings are at a ~7% lower ADC value than they were for the 200 GeV isobar running, even though the bias voltages are the same.
The peaks are all still aligned with each other to the 2-3% level, so no need to re-adjust bias voltages.
Update 11 May 2018: While the apparent peak (as extracted from a single-Landau fit) is lower in the Au+Au, this is an artifact of the fit. Examining the ADC spectra themselves, in detail, reveals that they are rock solid, with no partial-integration effect. See this page.
Explanation:
The reason is the gate timing. At the lower energies, putting beam bunches into tight buckets does not work, and the events happen over a longer time period-- 7-10 ns sigma, as compared to 2-3 ns (numbers TBC). This is true even if one would/could select on events that occur exactly at the middle of the TPC. On top of this, the diamond (spatial distribution) is larger, leading to arrival-time fluctuations at the two EPD wheels.
Because of this, our signal may fall partially out of the "beginning" of the ADC gate, and partially out of the "end" of the gate. In either case, the integrated signal (the ADC value) is reduced as compared to the fully-integrated case where the gate completely surrounds the pulse. This is a generic effect, but gets worse when the arrival-time distribution gets wider.
Update 11 May 2018: While the above is a plausible explanation (there will be larger fluctuations in the relative timing between gate and signal at these energies, after all), I now believe that there is no such partial-integration effect. See this page.
Some background from the isobar timing and bias setting:
In our original gate timing scan for the isobars (see here for gory details), we systematically varied the delay of the gate and found values (one for the QT32B and one for the QT32C, as these devices have slightly different internal delays) that maximized the one-MIP peak positions. These delay values (in strange units) were 53 and 43 for the B's and C's, respectively.
However as pointed out by Akio and discussed on this page, while these values represented the "best compromise" delays, they sometimes allowed the pulse to begin before the gate opened. This means that the discriminator in the QTs would be disabled and would not fire, screwing up potential trigger and timing capabilities. Therefore, we reduced the gate delays to 32 and 23 for the B's and C's, respectively.
These "fine delay units" are in 0.5 ns quanta, so this means we delayed the gate delay we used in the isobar run was 10 ns different than the value that maximizes the position of the 1-MIP peak. The result was that the 1-MIP peak is about 80% what it "could be" with the greater delays.
With the gate delays set, we found the bias voltage that aligned all the 1-MIP peaks (gory details here), and set them such that the 1-MIP peak is at 115 and 160 for the B's and C's, respectively.
Settings for the 27 GeV Au+Au running
When Bill and Akio found the "optimum" global timing for the 27 GeV run ("fine delay" of 146 in runs 19130009 and 19130015), I looked at our MIP peaks. Rather than being at 115 and 160, they were about 10% lower: 106 and 141.
Increasing the gate delay by 2 ns ("fine delay" of 150 in run 19130021) increased the peak positions to 107 and 143.
Increasing the gate by 5 ns ("fine delay" of 156 in run 19130018) increased the peak positions to 109 and 146.
So, from a "maximize the peak value" point of view, the settings in run 19130018 are best. However, this gate delay again leads to clipping of the TAC values (look at the plots in the fourth column on this page), so is too much.
My conclusion is that we will live with the reduced peak positions.
Update 10 May 2018 18:30
The timing has been more or less finalized, so that the global "fine delay" is set to 150. This is the same value as I mentioned from run 19130021 above, except now (e.g. run 19130061) the 1-MIP MPV is at 109.2 and 145.3 for B's and C's, respectively. Why the improvement over run 19130021? Unclear. The machine people did something to clean up the Yellow ring etc etc. Anyway it doesn't matter. We are now within 5% and 9% of our nominal values from the isobar running.
Furthermore, as seen from figure 1 below, the 1-MIP MPV from one tile to the next are within 2-3% of each other. This tells me that there is no point to re-adjust the bias voltages to line up the peaks. They have remained aligned.
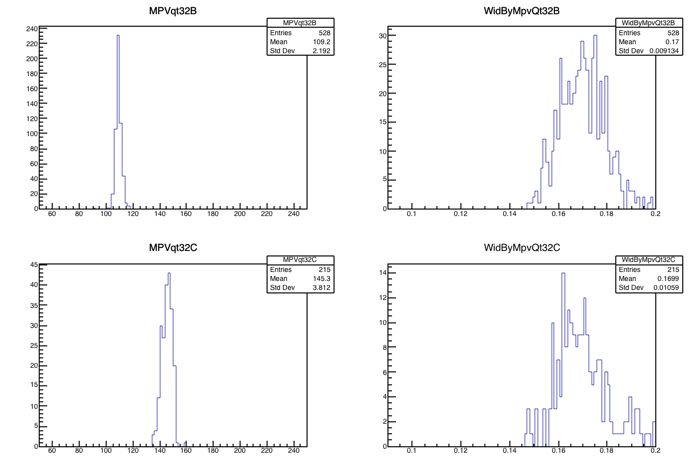
Figure 1 - From run 19130061. Left panels: Distributions of 1-MIP MPV from the QT32B's and QT32C's. They are pretty tightly clustered about the averages of of 109.2 and 145.3. Right panels: the WID/MPV from the Landau fits to the single-MIP peak.
You can see the ADC spectra and fits that gave rise to these parameters in this very large pdf file. It's kind of a strange format, but on each page there are two ADC distributions. The one on the left is from run 19130061, the one we're talking about here, for Au+Au 27 GeV, taken today, 10 May 2018. The one on the right is from run 19072050, which was what we used in the original timing scan. You will see that the peak on the left is always at the same place (as I said above), while the one on the right moves around. That's because in run 19072050, we had not yet adjusted the bias voltage to line up the peaks. So, I'm just showing this to demonstrate the peaks and fits.
Questions to address and plots to post:
I'm quite busy so cannot do everything right now, but wanted to get this out there ASAP, for folks to think about. But there is more to do and answer:
Questions to answer:
Plots to post
The single-MIP peaks for the Au27Au settings are at a ~7% lower ADC value than they were for the 200 GeV isobar running, even though the bias voltages are the same.
The peaks are all still aligned with each other to the 2-3% level, so no need to re-adjust bias voltages.
Update 11 May 2018: While the apparent peak (as extracted from a single-Landau fit) is lower in the Au+Au, this is an artifact of the fit. Examining the ADC spectra themselves, in detail, reveals that they are rock solid, with no partial-integration effect. See this page.
Explanation:
The reason is the gate timing. At the lower energies, putting beam bunches into tight buckets does not work, and the events happen over a longer time period-- 7-10 ns sigma, as compared to 2-3 ns (numbers TBC). This is true even if one would/could select on events that occur exactly at the middle of the TPC. On top of this, the diamond (spatial distribution) is larger, leading to arrival-time fluctuations at the two EPD wheels.
Because of this, our signal may fall partially out of the "beginning" of the ADC gate, and partially out of the "end" of the gate. In either case, the integrated signal (the ADC value) is reduced as compared to the fully-integrated case where the gate completely surrounds the pulse. This is a generic effect, but gets worse when the arrival-time distribution gets wider.
Update 11 May 2018: While the above is a plausible explanation (there will be larger fluctuations in the relative timing between gate and signal at these energies, after all), I now believe that there is no such partial-integration effect. See this page.
Some background from the isobar timing and bias setting:
In our original gate timing scan for the isobars (see here for gory details), we systematically varied the delay of the gate and found values (one for the QT32B and one for the QT32C, as these devices have slightly different internal delays) that maximized the one-MIP peak positions. These delay values (in strange units) were 53 and 43 for the B's and C's, respectively.
However as pointed out by Akio and discussed on this page, while these values represented the "best compromise" delays, they sometimes allowed the pulse to begin before the gate opened. This means that the discriminator in the QTs would be disabled and would not fire, screwing up potential trigger and timing capabilities. Therefore, we reduced the gate delays to 32 and 23 for the B's and C's, respectively.
These "fine delay units" are in 0.5 ns quanta, so this means we delayed the gate delay we used in the isobar run was 10 ns different than the value that maximizes the position of the 1-MIP peak. The result was that the 1-MIP peak is about 80% what it "could be" with the greater delays.
With the gate delays set, we found the bias voltage that aligned all the 1-MIP peaks (gory details here), and set them such that the 1-MIP peak is at 115 and 160 for the B's and C's, respectively.
Settings for the 27 GeV Au+Au running
When Bill and Akio found the "optimum" global timing for the 27 GeV run ("fine delay" of 146 in runs 19130009 and 19130015), I looked at our MIP peaks. Rather than being at 115 and 160, they were about 10% lower: 106 and 141.
Increasing the gate delay by 2 ns ("fine delay" of 150 in run 19130021) increased the peak positions to 107 and 143.
Increasing the gate by 5 ns ("fine delay" of 156 in run 19130018) increased the peak positions to 109 and 146.
So, from a "maximize the peak value" point of view, the settings in run 19130018 are best. However, this gate delay again leads to clipping of the TAC values (look at the plots in the fourth column on this page), so is too much.
My conclusion is that we will live with the reduced peak positions.
Update 10 May 2018 18:30
The timing has been more or less finalized, so that the global "fine delay" is set to 150. This is the same value as I mentioned from run 19130021 above, except now (e.g. run 19130061) the 1-MIP MPV is at 109.2 and 145.3 for B's and C's, respectively. Why the improvement over run 19130021? Unclear. The machine people did something to clean up the Yellow ring etc etc. Anyway it doesn't matter. We are now within 5% and 9% of our nominal values from the isobar running.
Furthermore, as seen from figure 1 below, the 1-MIP MPV from one tile to the next are within 2-3% of each other. This tells me that there is no point to re-adjust the bias voltages to line up the peaks. They have remained aligned.
Figure 1 - From run 19130061. Left panels: Distributions of 1-MIP MPV from the QT32B's and QT32C's. They are pretty tightly clustered about the averages of of 109.2 and 145.3. Right panels: the WID/MPV from the Landau fits to the single-MIP peak.
You can see the ADC spectra and fits that gave rise to these parameters in this very large pdf file. It's kind of a strange format, but on each page there are two ADC distributions. The one on the left is from run 19130061, the one we're talking about here, for Au+Au 27 GeV, taken today, 10 May 2018. The one on the right is from run 19072050, which was what we used in the original timing scan. You will see that the peak on the left is always at the same place (as I said above), while the one on the right moves around. That's because in run 19072050, we had not yet adjusted the bias voltage to line up the peaks. So, I'm just showing this to demonstrate the peaks and fits.
Questions to address and plots to post:
I'm quite busy so cannot do everything right now, but wanted to get this out there ASAP, for folks to think about. But there is more to do and answer:
Questions to answer:
- Are we happy with these gates? My thought: sure.
- Is there a reason to do a further gate scan, delaying the gate more to see "the other side of the plateau," even though we are sure that we are not going to use these increased delays. My thought: it would be nice and I'll do it if I get time and it doesn't disrupt things or delay going to physics running. But it's not crucial.
- Should we go through another bias scan, to line up the peaks, perhaps setting them back to the 115 and 160 values? My thought: No, do this in offline calibration.
- something else?
Plots to post
- ADC distributions with fits to the 1-MIP peaks, and comparing them to the isobar ones.
- distribution of MPV values-- is it wider than for the isobar case? (I expect so. This might argue for a bias adjustment.)
- width of the MIP peaks-- are they wider than for the isobar case? (I've looked and the answer is no, though one might expect some widening.)
- anything else folks want?
»
- lisa's blog
- Login or register to post comments