December 2019 - EPD East and West timing is now different
Updated on Tue, 2019-12-10 16:36. Originally created by lisa on 2019-12-10 14:08.
This could be explained by one of these:
Joey took several runs, in which he changed the labels for the QT32B and QT32C Gate_Start_Delay values, for both east and west QT boards. He always made the respective Gate_End_Delay to be 16 larger than the Start_Delay, as we've discussed before and recommended by Steve. In steps of 10, he varied the Start_Delay from 0 to 70. The idea is to find the Start_Delay value that leads to the maximum value of the single-MIP peak; that corresponds to integrating the most charge. You can read all about our timing scan procedure at this link from Run 18.
Below we compare timing scans from Run 18, 19 and 20. We look at a pair of QT32B boards, a pair of QT32C boards, and then summary plots.
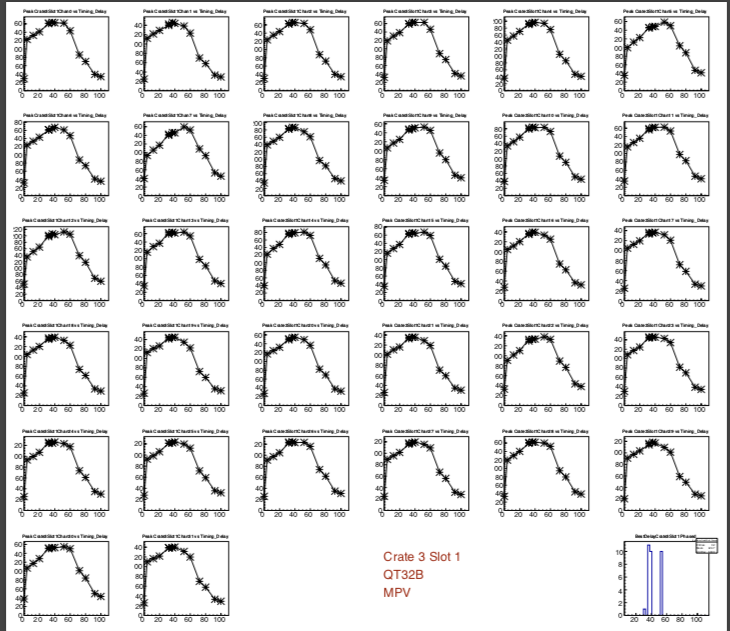
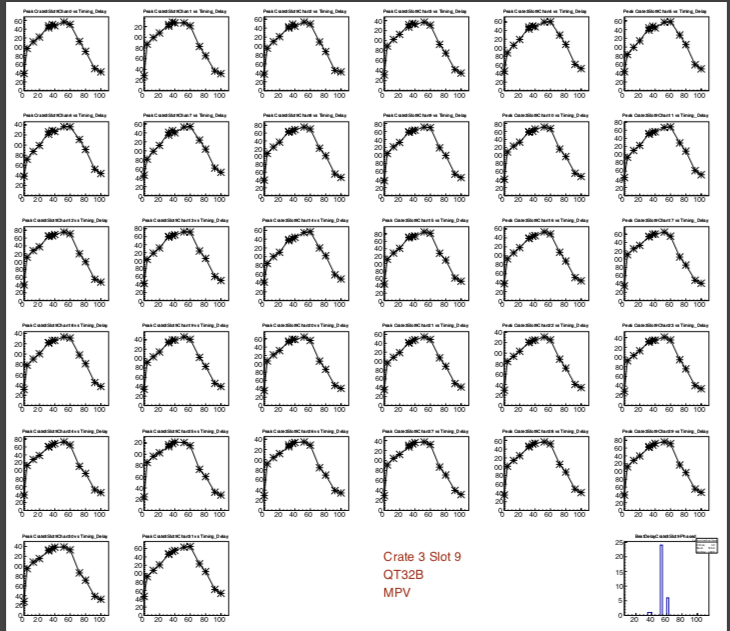
Figure 1, above. From Run 18. Two QT32B boards from EQ3. Slot 1 (left) serves the East EPD wheel, and slot 9 (right) serves the West. This figure part of a larger study found at this link.
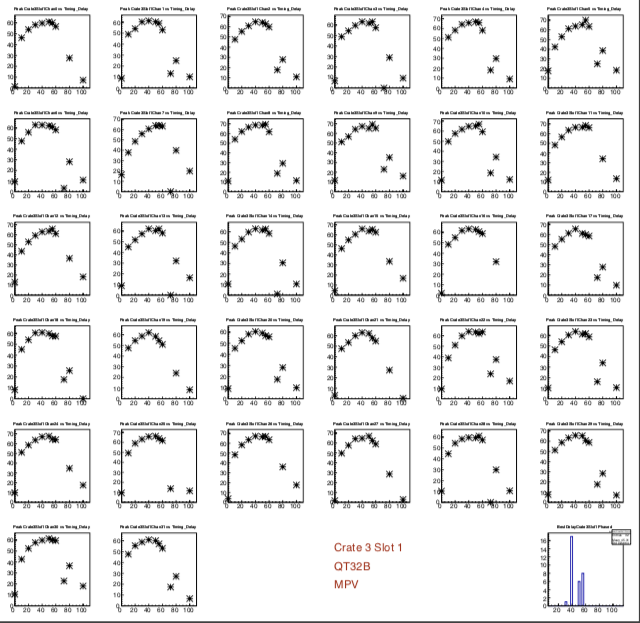
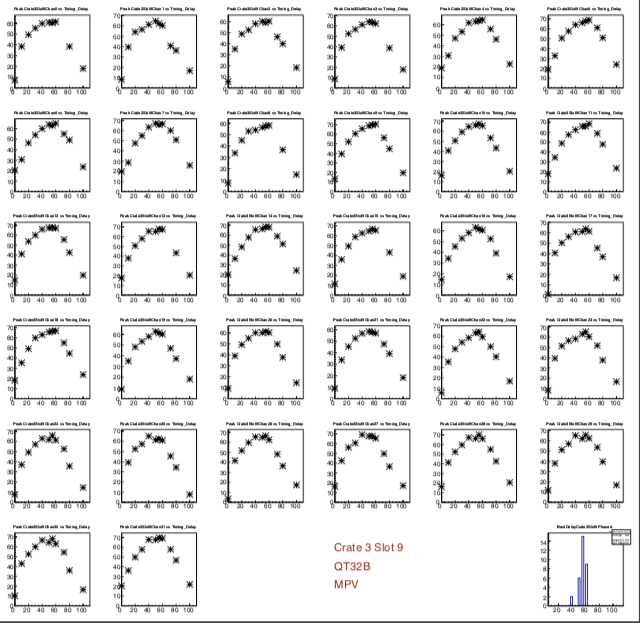
Figure 2, above. Same as figure 1, but now from Run 19. This figure part of a larger study found at this link.
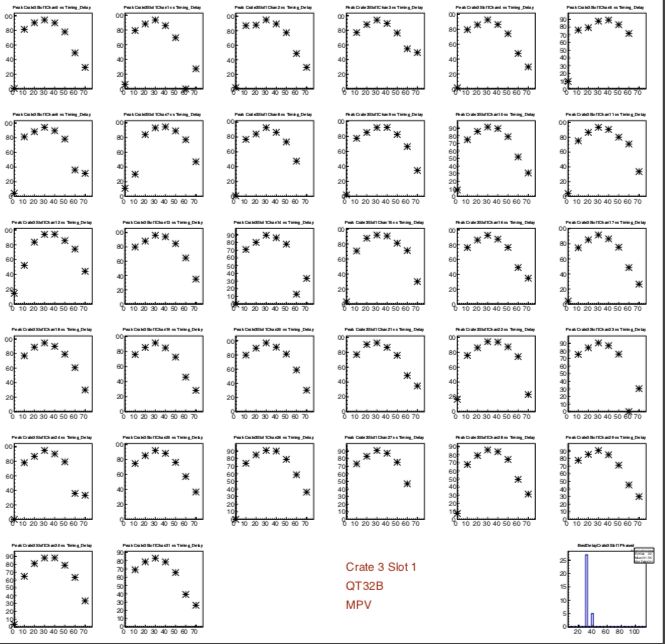
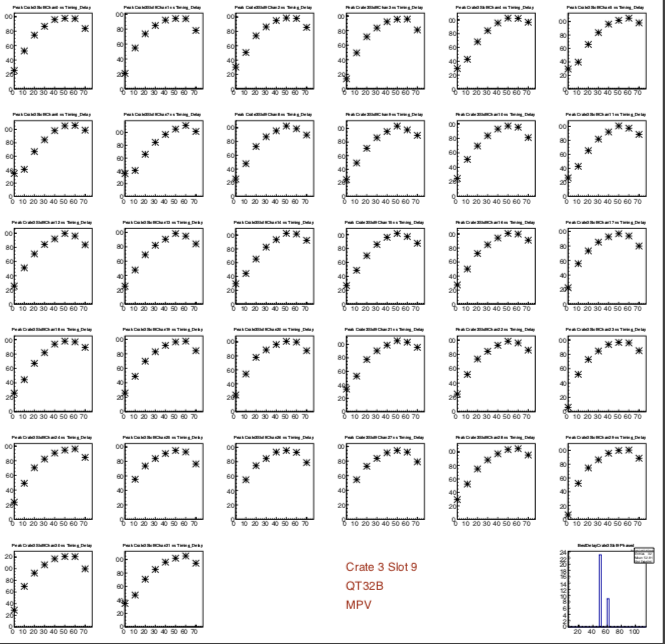
Figure 3, above. Same as figures 1 and 2, but now from Run 20.
Discussion: The curves for slot 1 and slot 9 are never identical, for a given year, but the difference is stronger for Run 20. It should be noted that the horizontal scale is more "blown up" for figure 3, but that does not change the conclusion.) The same is true for the QT32Cs, as I show next.
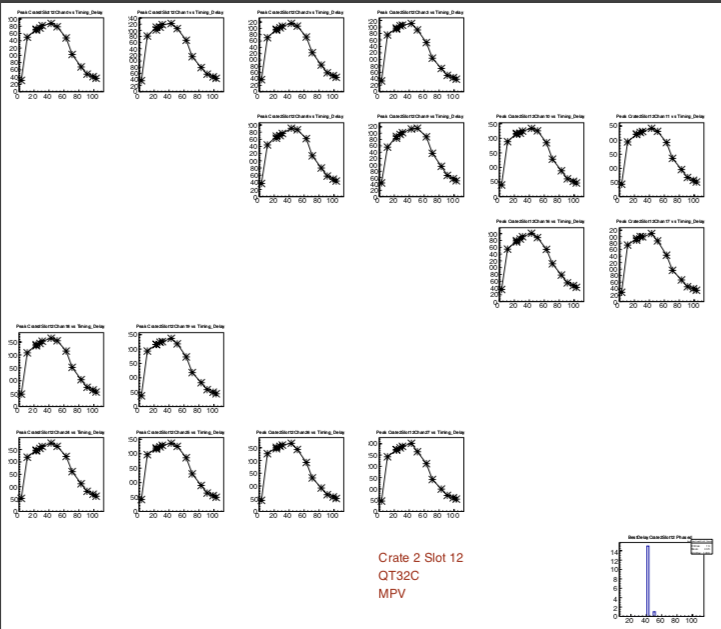
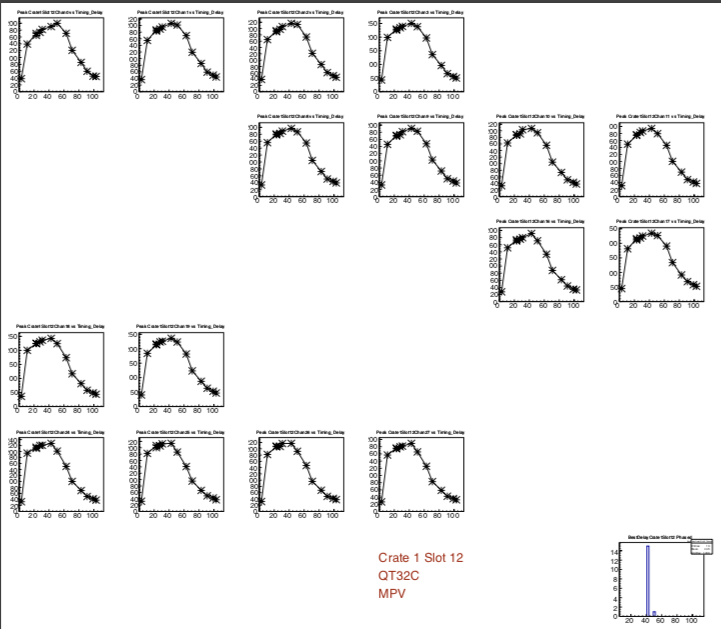
Figure 4, above. From Run 18. Two QT32C boards. Slot 12 Crate 2 (left) serves the East EPD wheel, and Slot 12 Crate 1 (right) serves the West. This figure part of a larger study found at this link.
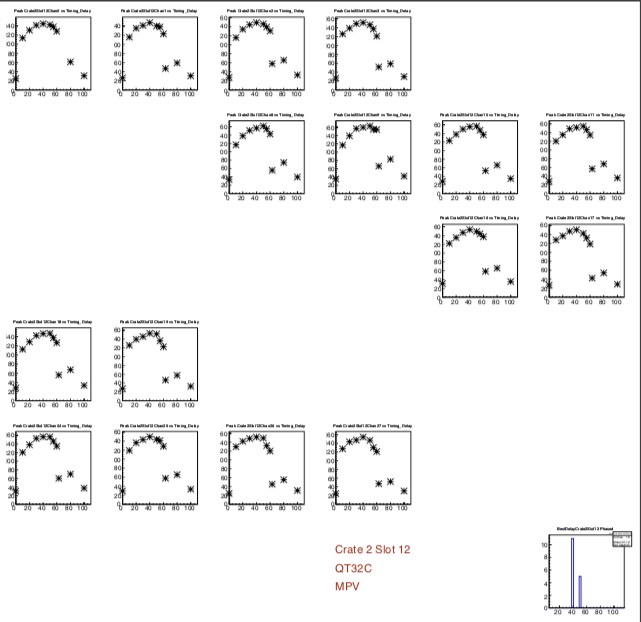
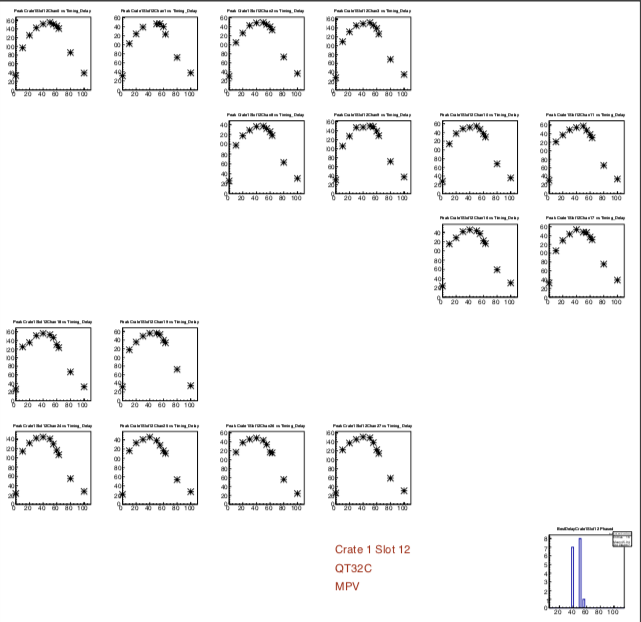
Figure 5, above. Same as figure 4, but now from Run 19. This figure part of a larger study found at this link.
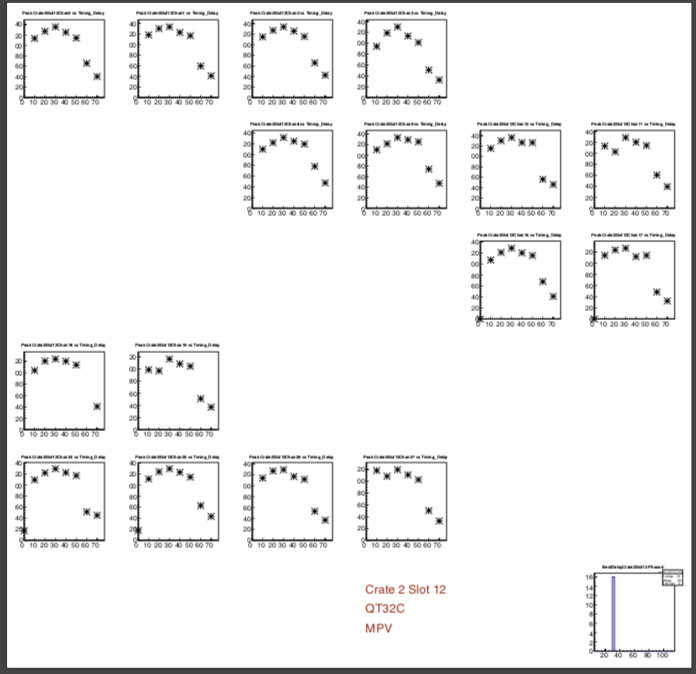
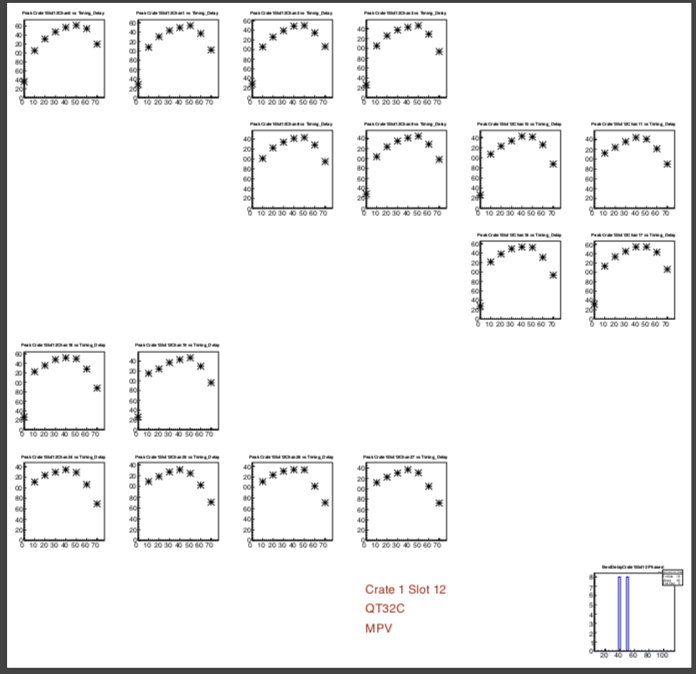
Figure 6, above. Same as figures 4 and 5, but now from Run 20.
Discussion: Just like the QT32B boards, the QT32C boards have different timing curves for East and West. East peaks earlier. This set in for this run (run 20). Again, the horizontal (time) axis is expanded in the run-20 plots, but this does not change the conclusion.
Summary plots.
The summary plots, found below, show, for every board in the three crates, the distribution of the "optimum gate delays" for all channels in the board.
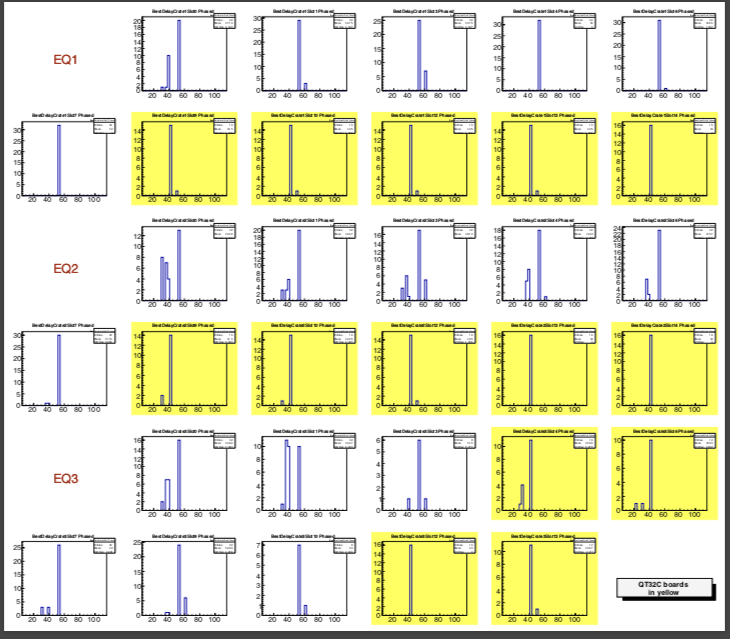
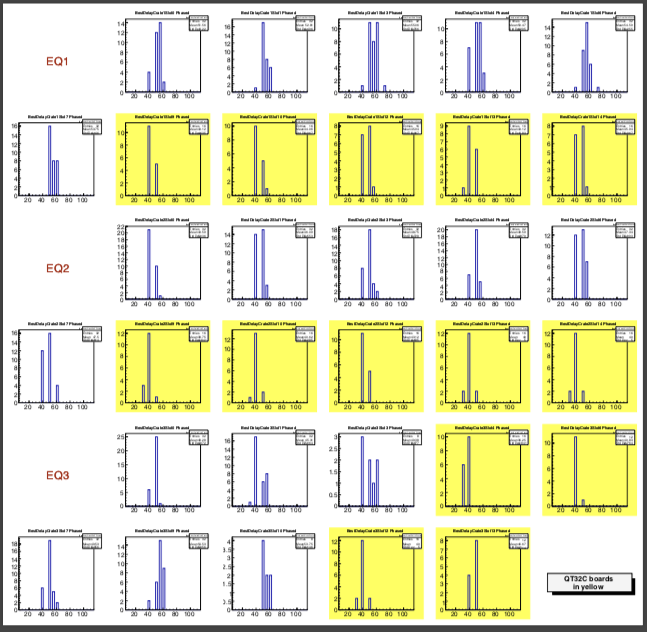
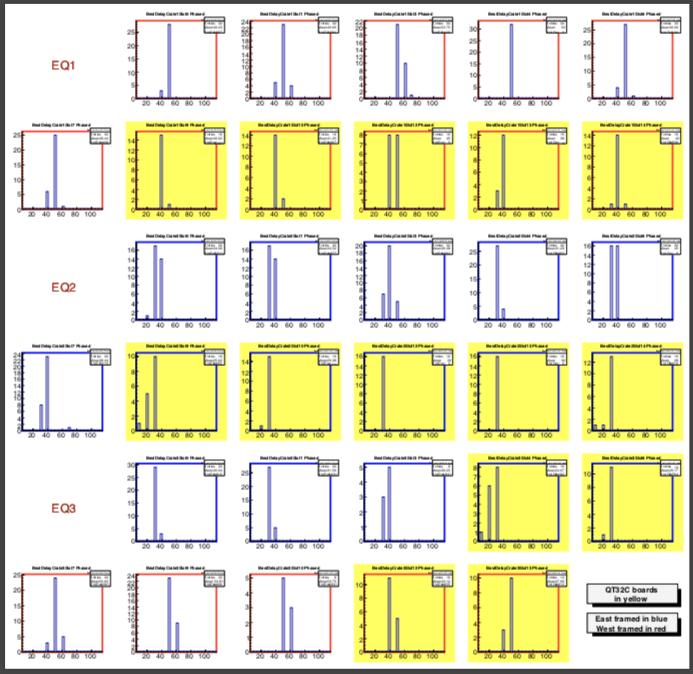
Figure 7 - Summary plots from the gate timing scan. See this link for a discussion. Left/middle/right is run 18/19/20. In the Run-20 plot, the color of the border of a pad tells whether it is East or West.
Discussion: The rightmost plot from figure 7 shows the run-20 summary. Yellow background means QT32C. Red/border means West/East. (Runs 18 and 19 don't have the colored borders.) It is pretty clear that the East signal is peaking earlier in the gate (which probably means, in reality, that the gate is arriving later on the East, even though it has the same Gate_Start_Delay label value), even if it is not clear why this should be so. It must be a trigger hardware thing.
The west curves and "optimum" values are similar to those from Runs 18 and 19.
We will move the East gate delays back by 10 ns.
EPD_QTb_East_Gate_Stop_Delay:48 --> 38
EPD_QTb_East_Gate_Start_Delay:32 --> 22
EPD_QTc_East_Gate_Stop_Delay:39 --> 29
EPD_QTc_East_Gate_Start_Delay:23 --> 13
EPD_QTb_West_Gate_Stop_Delay: 48
EPD_QTb_West_Gate_Start_Delay: 32
EPD_QTc_West_Gate_Stop_Delay: 39
EPD_QTc_West_Gate_Start_Delay: 23
EPD_QTc_W_TAC_Stop: 64
EPD_QTc_E_TAC_Stop:64 --> 44
Thanks to Rosi for the point about the TAC_Stop, which should always be set 18+2*Gate_Start_Delay.
Go to Executive summary
Go to Evidence and discussion
Go to implication and course of action
Executive Summary
In Runs 18 and 19, the EPD East and West EPD had the same timing as each other, and now they apparently do not. In particular:- Timing scan from Run 18 shows similar curves for QT32B East and West and similar curves for QT32C East and West, but now the maximum value (maximum charge integration) for West occurs at a later time than for East.
East and West "earliest TAC" distributions peaked at the same place in Run 19, but now East peaks earlier. Nevermind; Rosi thinks this is unrelated and I'll leave it to the side for now.- The East side now has more out-of-time hits than the West. This seems to be something of a moving target, unfortunately.
This could be explained by one of these:
- The particles from the collision reach the East wheel before the West wheel. - not true, since we look at collisions from a symmetric vZ distribution, according to online plots.
- The signal from the FEE reaches the QTs earlier for the East wheel. (E.g. the MDR cables suddenly became shorter for the East than the West) - definitely not true!
- The signal from the trigger reaches the QTs later for the East wheel. (E.g. the cable could be longer, or some other aspect of the trigger signal has a delay for East.)
Evidence and discussion
Joey took several runs, in which he changed the labels for the QT32B and QT32C Gate_Start_Delay values, for both east and west QT boards. He always made the respective Gate_End_Delay to be 16 larger than the Start_Delay, as we've discussed before and recommended by Steve. In steps of 10, he varied the Start_Delay from 0 to 70. The idea is to find the Start_Delay value that leads to the maximum value of the single-MIP peak; that corresponds to integrating the most charge. You can read all about our timing scan procedure at this link from Run 18.
Below we compare timing scans from Run 18, 19 and 20. We look at a pair of QT32B boards, a pair of QT32C boards, and then summary plots.
A pair of QT32B boards
Figure 1, above. From Run 18. Two QT32B boards from EQ3. Slot 1 (left) serves the East EPD wheel, and slot 9 (right) serves the West. This figure part of a larger study found at this link.
Figure 2, above. Same as figure 1, but now from Run 19. This figure part of a larger study found at this link.
Figure 3, above. Same as figures 1 and 2, but now from Run 20.
Discussion: The curves for slot 1 and slot 9 are never identical, for a given year, but the difference is stronger for Run 20. It should be noted that the horizontal scale is more "blown up" for figure 3, but that does not change the conclusion.) The same is true for the QT32Cs, as I show next.
A pair of QT32C boards
Figure 4, above. From Run 18. Two QT32C boards. Slot 12 Crate 2 (left) serves the East EPD wheel, and Slot 12 Crate 1 (right) serves the West. This figure part of a larger study found at this link.
Figure 5, above. Same as figure 4, but now from Run 19. This figure part of a larger study found at this link.
Figure 6, above. Same as figures 4 and 5, but now from Run 20.
Discussion: Just like the QT32B boards, the QT32C boards have different timing curves for East and West. East peaks earlier. This set in for this run (run 20). Again, the horizontal (time) axis is expanded in the run-20 plots, but this does not change the conclusion.
Summary plots.
The summary plots, found below, show, for every board in the three crates, the distribution of the "optimum gate delays" for all channels in the board.Figure 7 - Summary plots from the gate timing scan. See this link for a discussion. Left/middle/right is run 18/19/20. In the Run-20 plot, the color of the border of a pad tells whether it is East or West.
Discussion: The rightmost plot from figure 7 shows the run-20 summary. Yellow background means QT32C. Red/border means West/East. (Runs 18 and 19 don't have the colored borders.) It is pretty clear that the East signal is peaking earlier in the gate (which probably means, in reality, that the gate is arriving later on the East, even though it has the same Gate_Start_Delay label value), even if it is not clear why this should be so. It must be a trigger hardware thing.
The west curves and "optimum" values are similar to those from Runs 18 and 19.
Implication
We will move the East gate delays back by 10 ns.
EPD_QTb_East_Gate_Stop_Delay:
EPD_QTb_East_Gate_Start_Delay:
EPD_QTc_East_Gate_Stop_Delay:
EPD_QTc_East_Gate_Start_Delay:
EPD_QTb_West_Gate_Stop_Delay: 48
EPD_QTb_West_Gate_Start_Delay: 32
EPD_QTc_West_Gate_Stop_Delay: 39
EPD_QTc_West_Gate_Start_Delay: 23
EPD_QTc_W_TAC_Stop: 64
EPD_QTc_E_TAC_Stop:
Thanks to Rosi for the point about the TAC_Stop, which should always be set 18+2*Gate_Start_Delay.
»
- lisa's blog
- Login or register to post comments