EPD Timing Scan for run 2019
Updated on Tue, 2019-02-26 16:52. Originally created by lisa on 2019-02-24 22:39.
The EPD was configured for the 2019 run over the weekend 23-24 February, 2019. Rosi, Justin, and Cat were physically in the control room, and Mike joined them by perpetual Skype.
Update at bottom of page: scope picture of the gates for QT32B and QT32C
Having confirmed that the EPD is roughly in time with the BBC, by viewing EPD-BBC coincidences with cosmics, we did a timing scan. This amounts to measuring the position of the MIP peak, as a function of "Gate delay." When the ADC gate maximally integrates the signal, then the MIP peak will be highest. If we were only interested in optimally integrating the signal, this would define our preferred gate delay. However, we want to be extra sure to capture the first part of the signal (falling edge), since we are using this for discriminating and timing. Therefore, we back off and don't delay the gate quite as much as our scan plots might suggest.
The timing scan is documented in full detail here https://drupal.star.bnl.gov/STAR/blog/lisa/epd-timing-scan-run-2018
For the 2019 scan, the beam intensity was very poor, meaning limited number of gate delay samples, and low statistics for each sample. Nevertheless, we took 10 samples with decent statistics. The signal-versus-delay curves looked extremely similar in details. Mike made the judgement call that they were essentially identical (which is not really so surprising) and hence we are keeping the same gate delays that we had for 2018. (This is subject to revision.) In particular:
The 2019 timing scan was performed while the SiPMs were at nominal bias voltages from the 2018 run. (See txt file at bottom of this page, for actual numbers.)
There are a lot of graphs, sorry. You can see the whole bloody mess here.
To give some context, here are the peaks I was using for the scan of (Crate/Slot/Channel)=(1/1/20) in 2018, followed by the same channel in 2019. There are 744 sets of these peaks and fits, in the study.
.png)
Figure 1. Above, the spectra used for the 2018 scan for Crate 1 Slot 1 Channel 20.
.png)
Figure 2. Above, the spectra used for the 2019 scan for the same channel: Crate 1 Slot 1 Channel 20.
Note: pay attention to the delay in each panel. They are not the same in the 2018 and 2019 figure. Also, the bias voltage was lower for 2019. So they cannot be directly compared. But I wanted to make clear that (1) the spectra are much lower statistics and crappy (2) there are fewer such samples, but still (3) you can extract peaks and make systematics.
Below see the timing curves for the 32 channels of the QT32B in Crate 1 Slot 1. This is the MIP MPV versus gate delay. First is the 2018 scan, followed by the 2019 scan. There are 33 such pages of this, in the study.
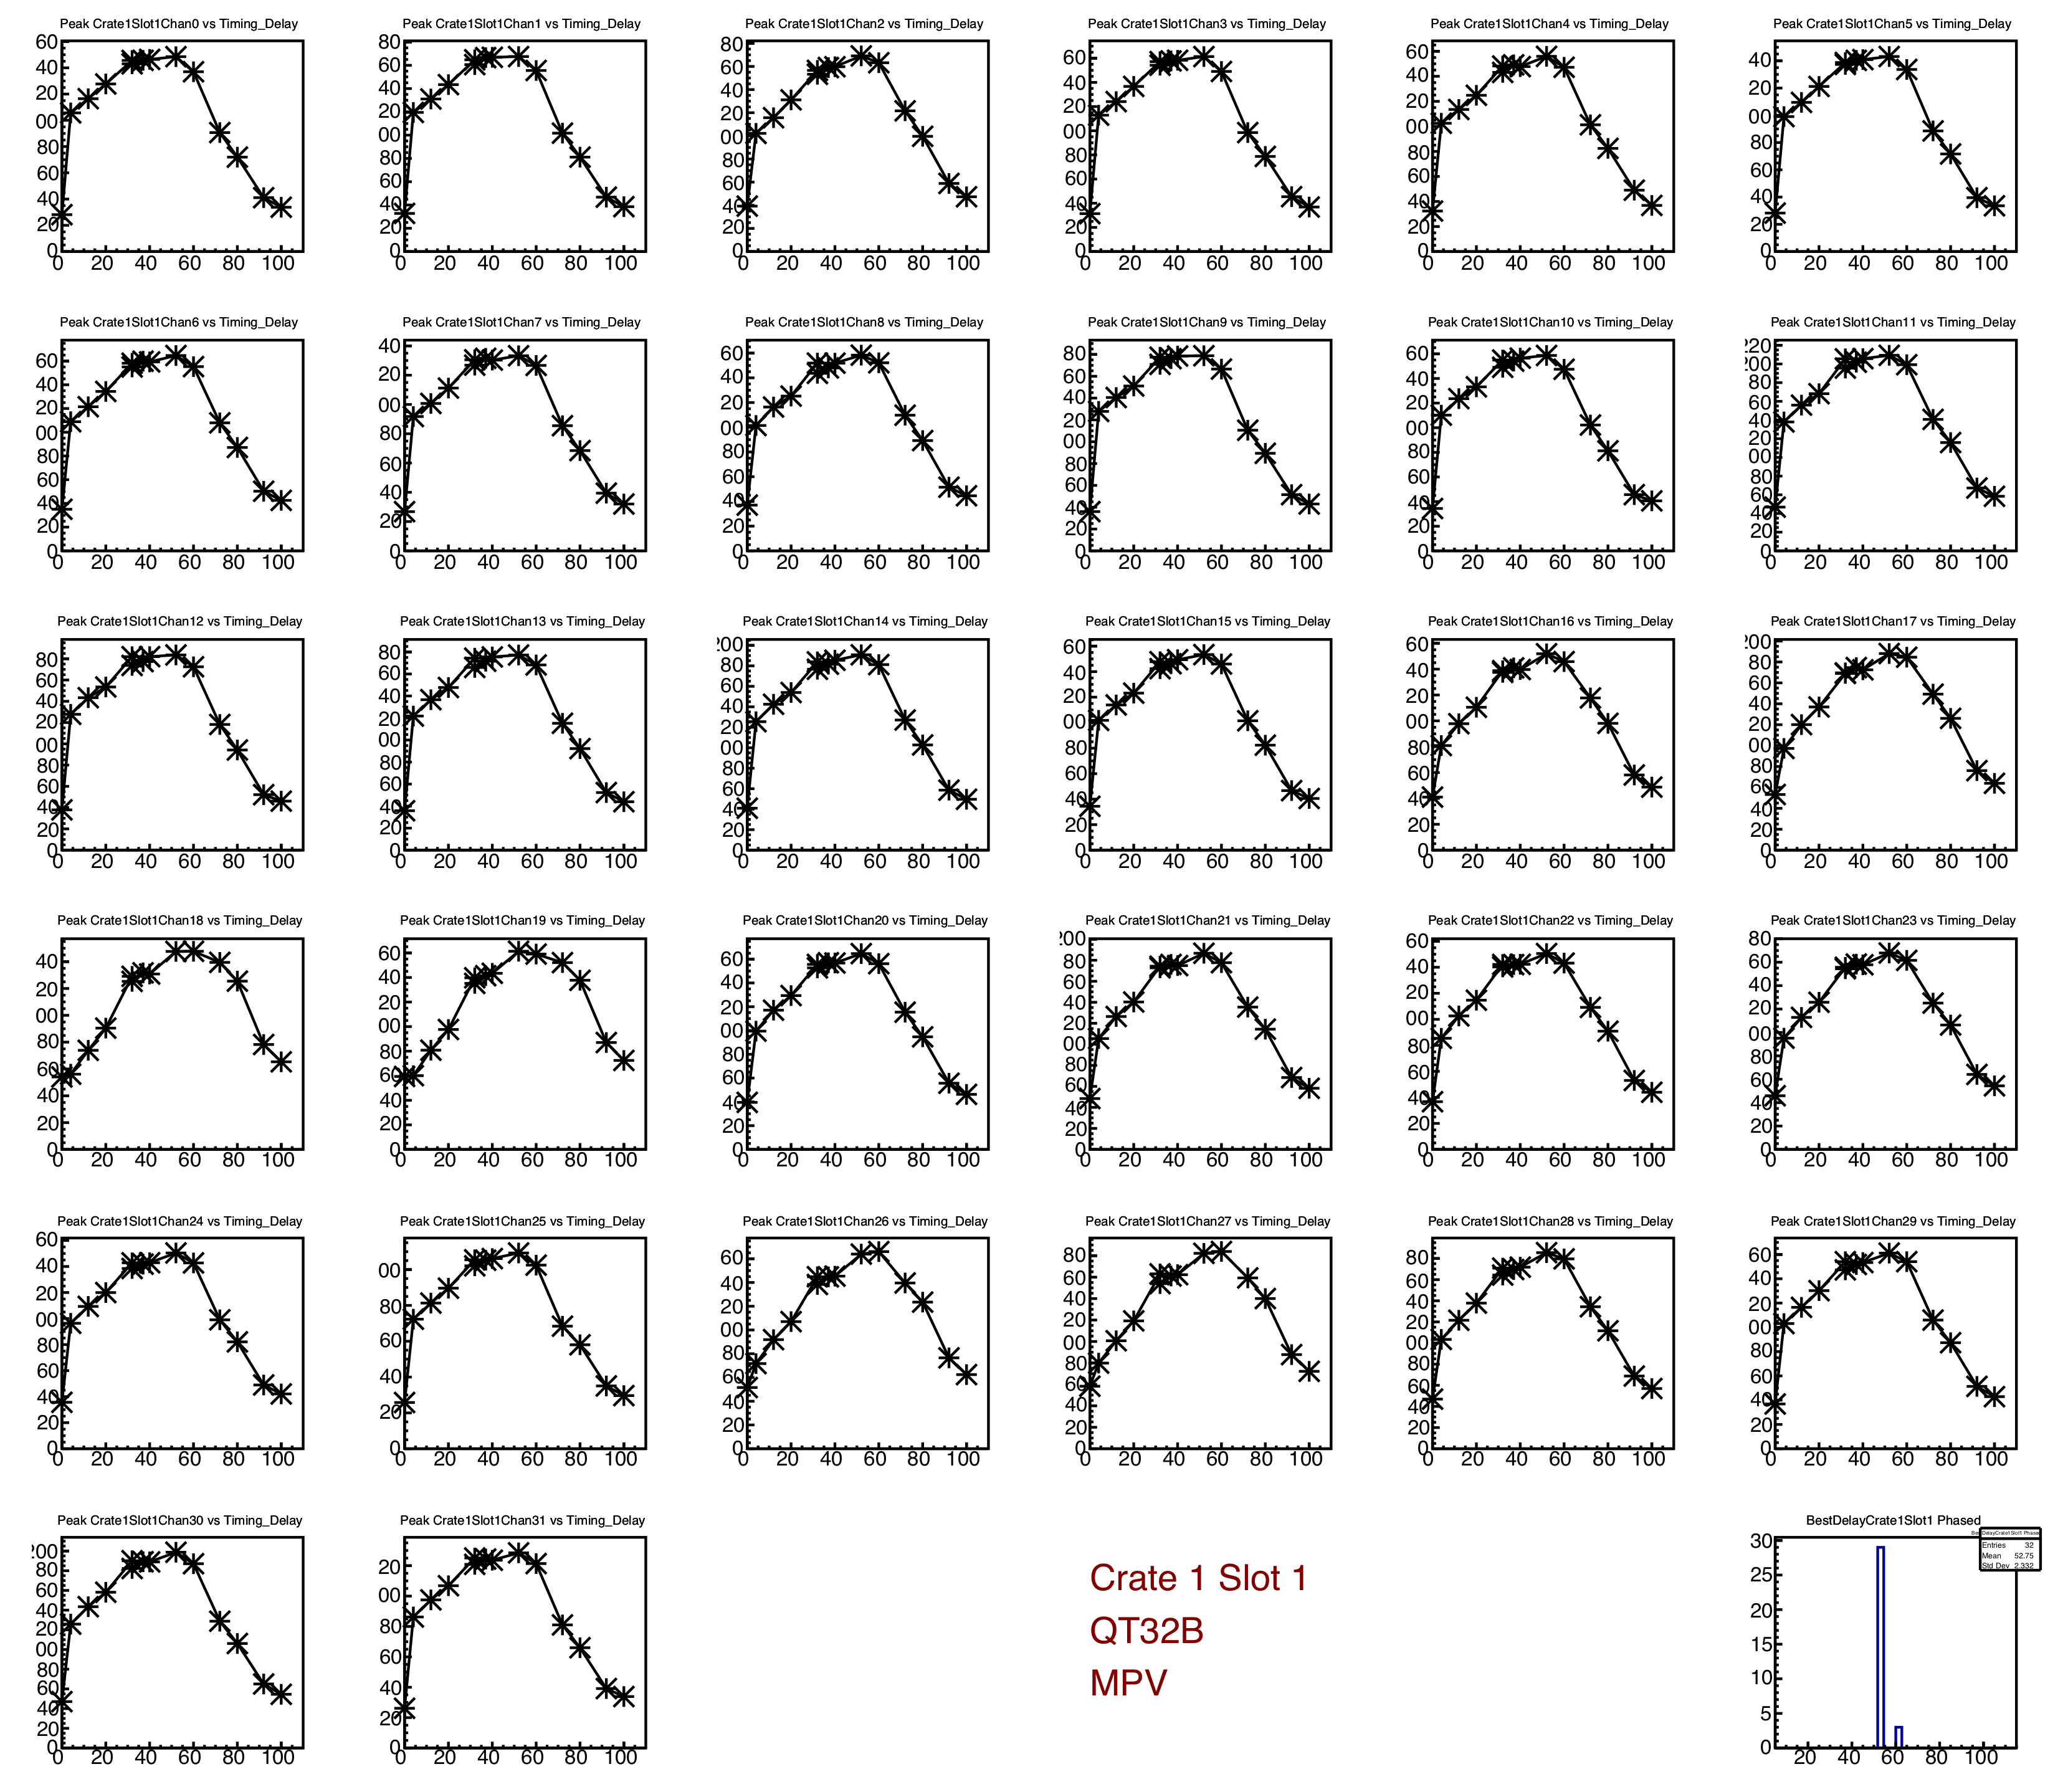
Figure 3. For the 2018 run, the MIP MPV versus timing scan, for the 32 channels in the QT32B in Crate 1 slot 1. Lower right is a histogram of the gate delay that maximizes the MIP MPV.

Figure 4. For the 2019 run, the MIP MPV versus timing scan, for the 32 channels in the QT32B in Crate 1 slot 1. Lower right is a histogram of the gate delay that maximizes the MIP MPV.
Again, the bias voltage for the two runs are different, so don't compare the numbers on the y-axis. The shapes, however, can be compared, and they are similar.
The final level of "data summary" is the one-page summary that shows, the preferred gate delay for each slot in each crate. Below I show the summary for 2018, followed by the one for 2019.
.png)
Figure 5 - The "timing executive summary" page for 2018.
.png)
Figure 6 - The "timing executive summary" page for 2019.
As we compare these two figures, it is clear that the lower number and lower statistics of the 2019 scan leads to noise that finds its way into this summary.
Mike's judgement that the timing parameters for 2019 should be the same as for 2018 comes from
Update 25 Feb 2019
Akio and Prashanth went in during an access and took the following photo of the gates that go into QT32B (Ch2 blue) and QT32C (Ch3 magenta) boards. The yellow trace is a random cosmic from the EPD. It is unrelated in time to the gates, but is shown just to remind the timescale of the signal.
As seen, the gates are wide open-- almost 80 ns, as expected. So, this makes sense...

Further update 26 Feb:
Prashanth has also posted traces from an e-scope showing analog signal from one tile, together with the gates, during beam time. In that case, the timing of the signal and the gates ARE meaningful, and they look good. His post is here:
https://drupal.star.bnl.gov/STAR/subsys/epd/operations-2019/escope-traces
Update at bottom of page: scope picture of the gates for QT32B and QT32C
Having confirmed that the EPD is roughly in time with the BBC, by viewing EPD-BBC coincidences with cosmics, we did a timing scan. This amounts to measuring the position of the MIP peak, as a function of "Gate delay." When the ADC gate maximally integrates the signal, then the MIP peak will be highest. If we were only interested in optimally integrating the signal, this would define our preferred gate delay. However, we want to be extra sure to capture the first part of the signal (falling edge), since we are using this for discriminating and timing. Therefore, we back off and don't delay the gate quite as much as our scan plots might suggest.
The timing scan is documented in full detail here https://drupal.star.bnl.gov/STAR/blog/lisa/epd-timing-scan-run-2018
For the 2019 scan, the beam intensity was very poor, meaning limited number of gate delay samples, and low statistics for each sample. Nevertheless, we took 10 samples with decent statistics. The signal-versus-delay curves looked extremely similar in details. Mike made the judgement call that they were essentially identical (which is not really so surprising) and hence we are keeping the same gate delays that we had for 2018. (This is subject to revision.) In particular:
- EPD_QT_Gate_Start_delay=32
- EPD_QT_Gate_Stop_delay=48
- EPD_QTc_Gate_Start_delay=23.
- EPD_QTc_Gate_Stop_delay=39
- EPD_QTc_Gate_TAC_Stop=64
The 2019 timing scan was performed while the SiPMs were at nominal bias voltages from the 2018 run. (See txt file at bottom of this page, for actual numbers.)
There are a lot of graphs, sorry. You can see the whole bloody mess here.
To give some context, here are the peaks I was using for the scan of (Crate/Slot/Channel)=(1/1/20) in 2018, followed by the same channel in 2019. There are 744 sets of these peaks and fits, in the study.
Figure 1. Above, the spectra used for the 2018 scan for Crate 1 Slot 1 Channel 20.
Figure 2. Above, the spectra used for the 2019 scan for the same channel: Crate 1 Slot 1 Channel 20.
Note: pay attention to the delay in each panel. They are not the same in the 2018 and 2019 figure. Also, the bias voltage was lower for 2019. So they cannot be directly compared. But I wanted to make clear that (1) the spectra are much lower statistics and crappy (2) there are fewer such samples, but still (3) you can extract peaks and make systematics.
Below see the timing curves for the 32 channels of the QT32B in Crate 1 Slot 1. This is the MIP MPV versus gate delay. First is the 2018 scan, followed by the 2019 scan. There are 33 such pages of this, in the study.
Figure 3. For the 2018 run, the MIP MPV versus timing scan, for the 32 channels in the QT32B in Crate 1 slot 1. Lower right is a histogram of the gate delay that maximizes the MIP MPV.
Figure 4. For the 2019 run, the MIP MPV versus timing scan, for the 32 channels in the QT32B in Crate 1 slot 1. Lower right is a histogram of the gate delay that maximizes the MIP MPV.
Again, the bias voltage for the two runs are different, so don't compare the numbers on the y-axis. The shapes, however, can be compared, and they are similar.
The final level of "data summary" is the one-page summary that shows, the preferred gate delay for each slot in each crate. Below I show the summary for 2018, followed by the one for 2019.
Figure 5 - The "timing executive summary" page for 2018.
Figure 6 - The "timing executive summary" page for 2019.
As we compare these two figures, it is clear that the lower number and lower statistics of the 2019 scan leads to noise that finds its way into this summary.
Mike's judgement that the timing parameters for 2019 should be the same as for 2018 comes from
- Figures 5 and 6 are broadly consistent, though Fig 6 is "noisier", consistent with the relative quality of the data shown in figures 1 and 2
- The detailed timing curves shown in figures 4 and 5 are essentially the same
- If the master trigger clock has been optimized in 2018 and in 2019, it is not unexpected (or???) that the gate delays would be the same.
Update 25 Feb 2019
Akio and Prashanth went in during an access and took the following photo of the gates that go into QT32B (Ch2 blue) and QT32C (Ch3 magenta) boards. The yellow trace is a random cosmic from the EPD. It is unrelated in time to the gates, but is shown just to remind the timescale of the signal.
As seen, the gates are wide open-- almost 80 ns, as expected. So, this makes sense...
Further update 26 Feb:
Prashanth has also posted traces from an e-scope showing analog signal from one tile, together with the gates, during beam time. In that case, the timing of the signal and the gates ARE meaningful, and they look good. His post is here:
https://drupal.star.bnl.gov/STAR/subsys/epd/operations-2019/escope-traces
»
- lisa's blog
- Login or register to post comments