Setting bias voltages or 2019
Updated on Tue, 2019-02-26 08:40. Originally created by lisa on 2019-02-25 00:03.
This story about the bias voltages in the 2019 run is getting a little longer, and this page has been updated now several times. Here is something of a "Table of Contents"
The EPD was configured for the 2019 run over the weekend 23-24 February, 2019. Rosi, Justin, and Cat were physically in the control room, and Mike joined them by perpetual Skype.
The gate timing was first adjusted as described here: https://drupal.star.bnl.gov/STAR/blog/lisa/epd-timing-scan-run-2019
Then, we performed a bias scan, whereby we varied Vset (Vset ~ Vbias-2V) and mapped out the evolution of the MIP MPV. The goal is that all the tiles that are read out by QT32Bs have their MIP peaks at 115 ADC counts, and the QT32Cs at 160 ADC counts. We followed the same procedure as in 2018, which is documented here.
Whereas the beam was total crap for the 2019 timing scan, it got a lot better for the bias scan, so we could extract the peaks fine. The only problem is...... they are so low!! As shown below, in order to keep the MIP peaks where they were last year, the bias voltages must be much higher. It is NOT clear why, though perhaps we have to revisit the gate timing.
The entire study pdf file and the macro that produced it are attached to the bottom of this page. The resulting Vset values are also there.
First, let's compare peaks for a given tile. First from 2018, then 2019
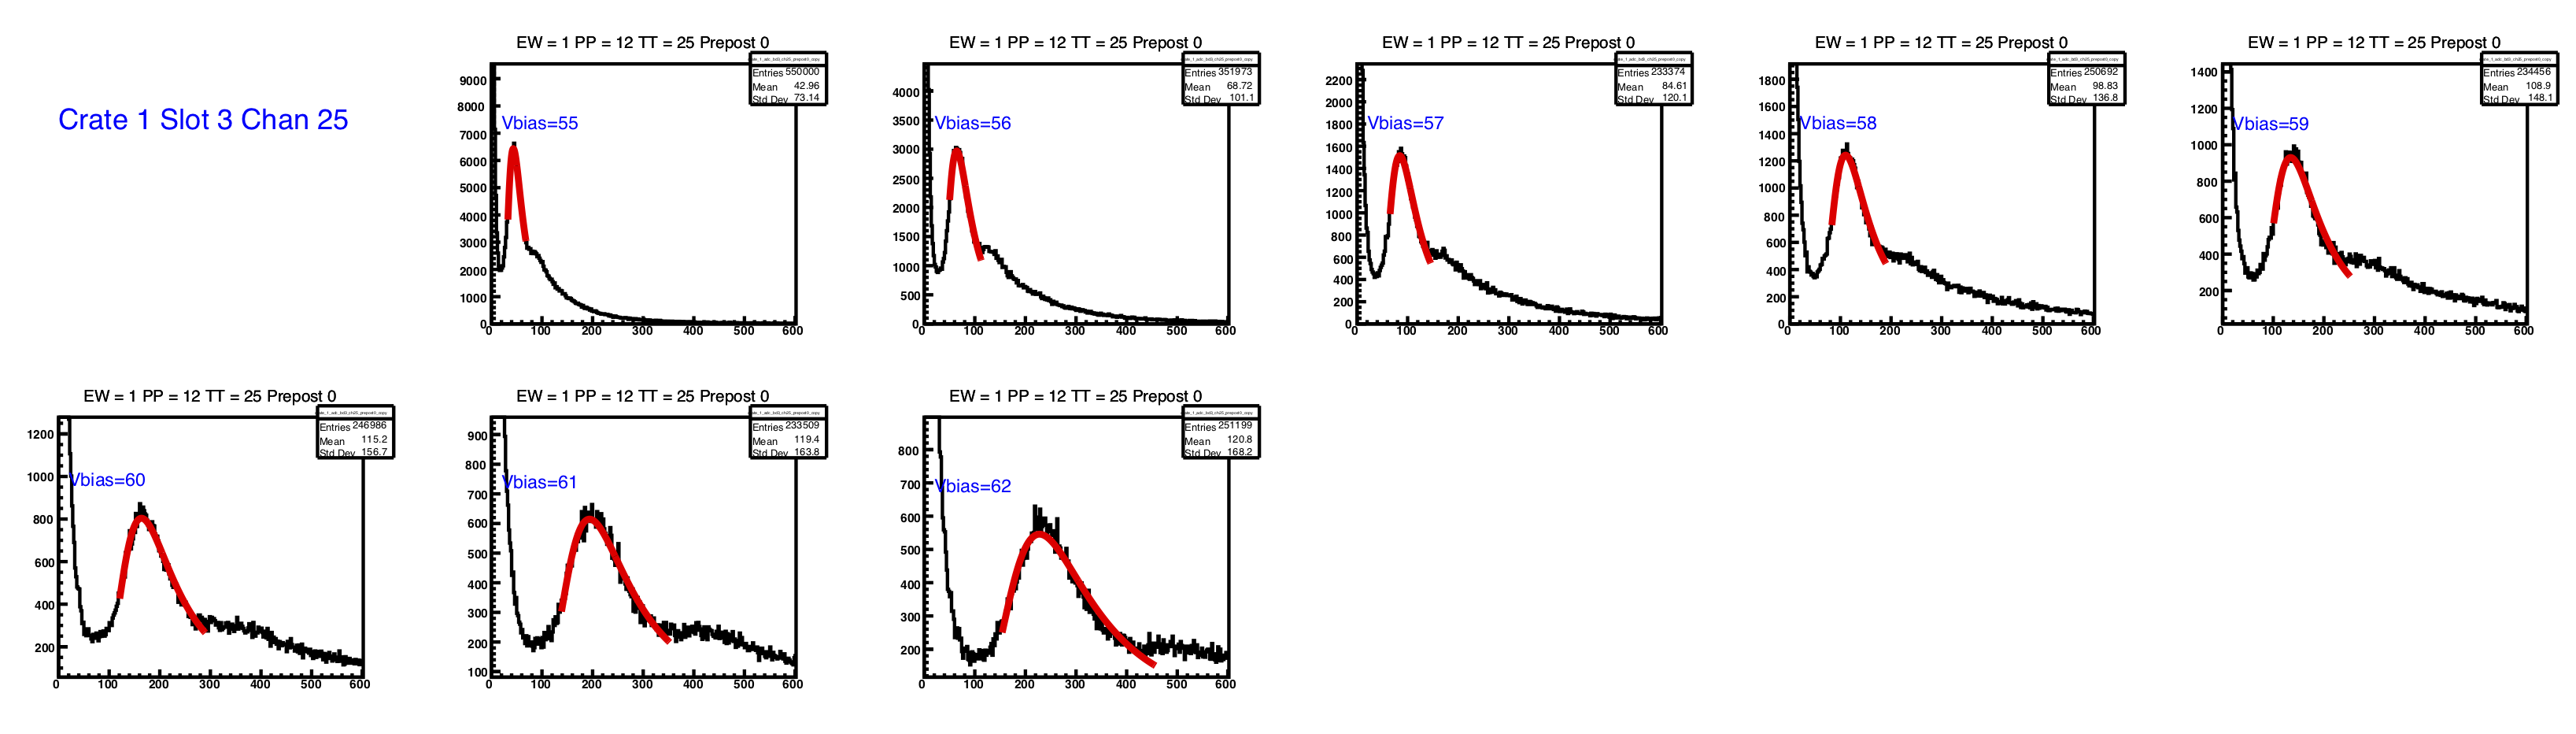
Figure 1 - MIP peaks from one channel, for different values of Vset (even though the figure says "Vbias", it is "Vset"), for the 2018 bias scan.
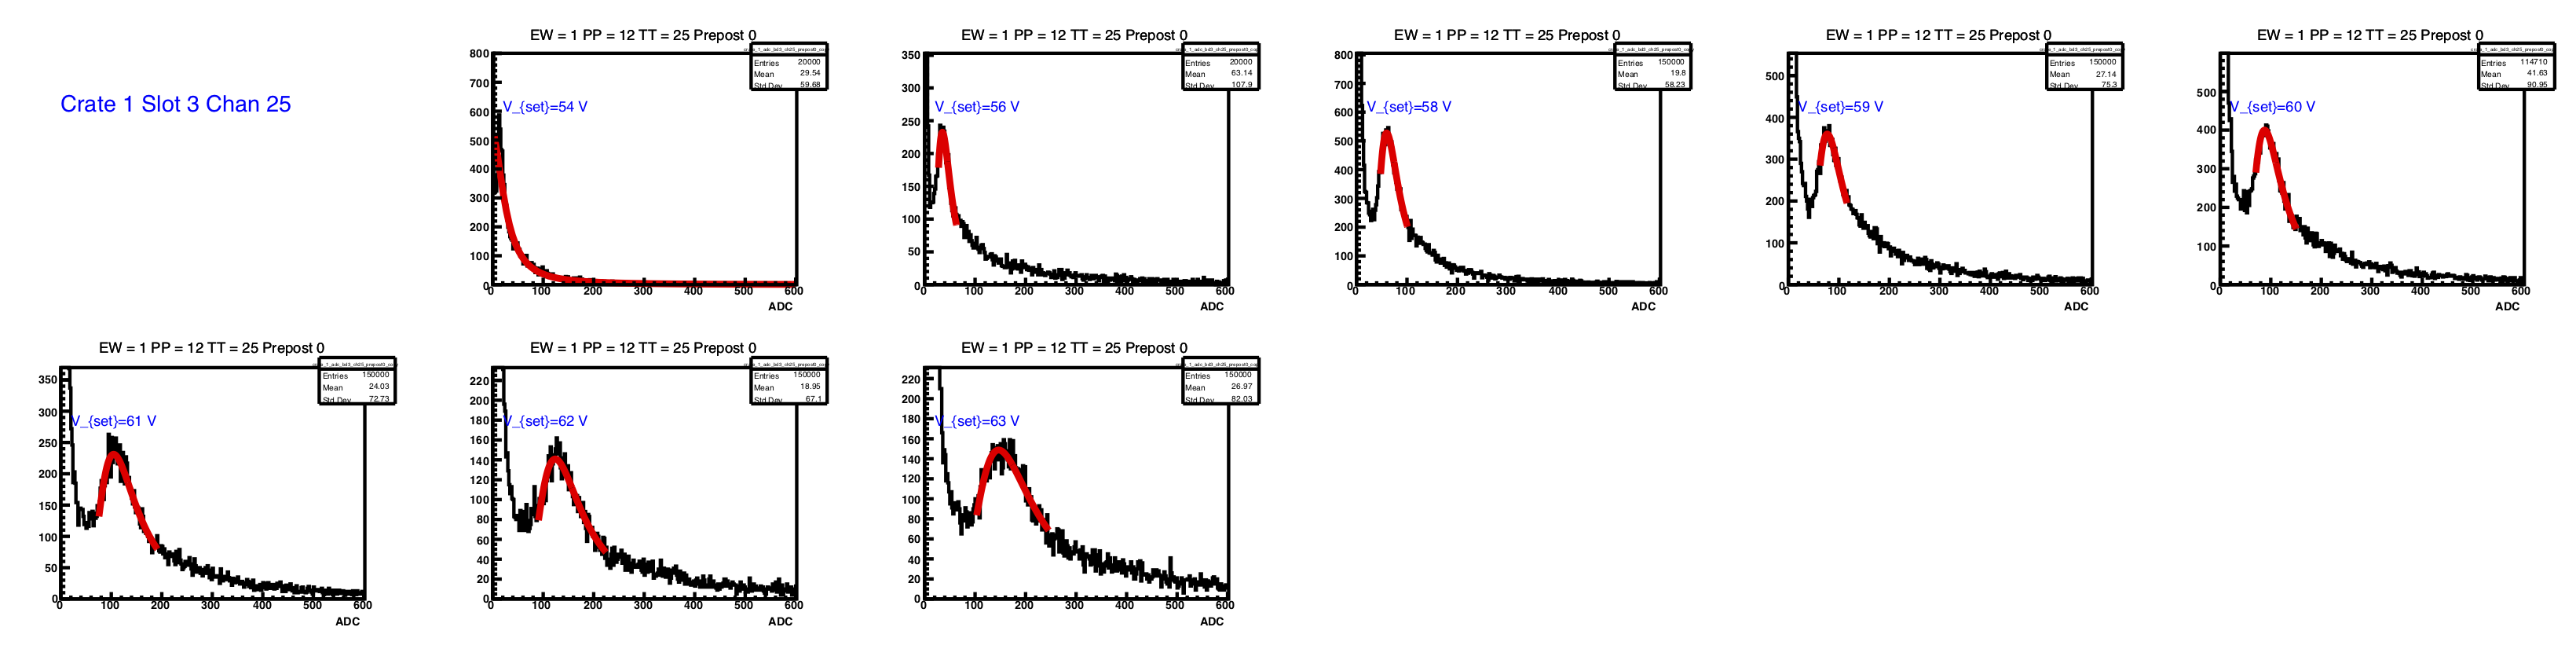
Figure 2 - MIP peaks from the same channel as in figure 1, for the 2019 bias scan.
The data sometimes lacks statistics (though here it is fine) and the fits aren't always perfect (though they are okay here, except the 54 V). However, you don't have to rely on any automated fitting. Your eyes tell you that, for the same Vset, the peaks are much lower in ADC value in 2019. This is the story across the line.
To maintain the same peak position, it requires much higher Vset in 2019. Justin noticed that the difference is stronger for tiles read out through QT32Bs. This could be due simply to the larger gain of the QT32Cs. However, it seems to me that the fractional increase would be independent of the gain of the ADC, and indeed, the fractional increase for the channels read through QT32B is indeed larger than the QT32Cs, as shown below.
.png)
Figure 3 - The new Vset values are compared with the ones used in 2018 ("old"). Left (right) column is QT32B (QT32C). Top: New versus old Vset. Middle: New/Old. Bottom: New-Old.
Because there is a "QT-flavor" dependence here, and the timing curves for the QTB are so different than those for the QTCs, my suspicions about the source of the mysteriously low peaks remains on the timing.
Let's look in more detail at the QT32B versus QT32C difference. Here are the MIP peak positions versus Vset, for West PP12. First comes 2018 then comes 2019.
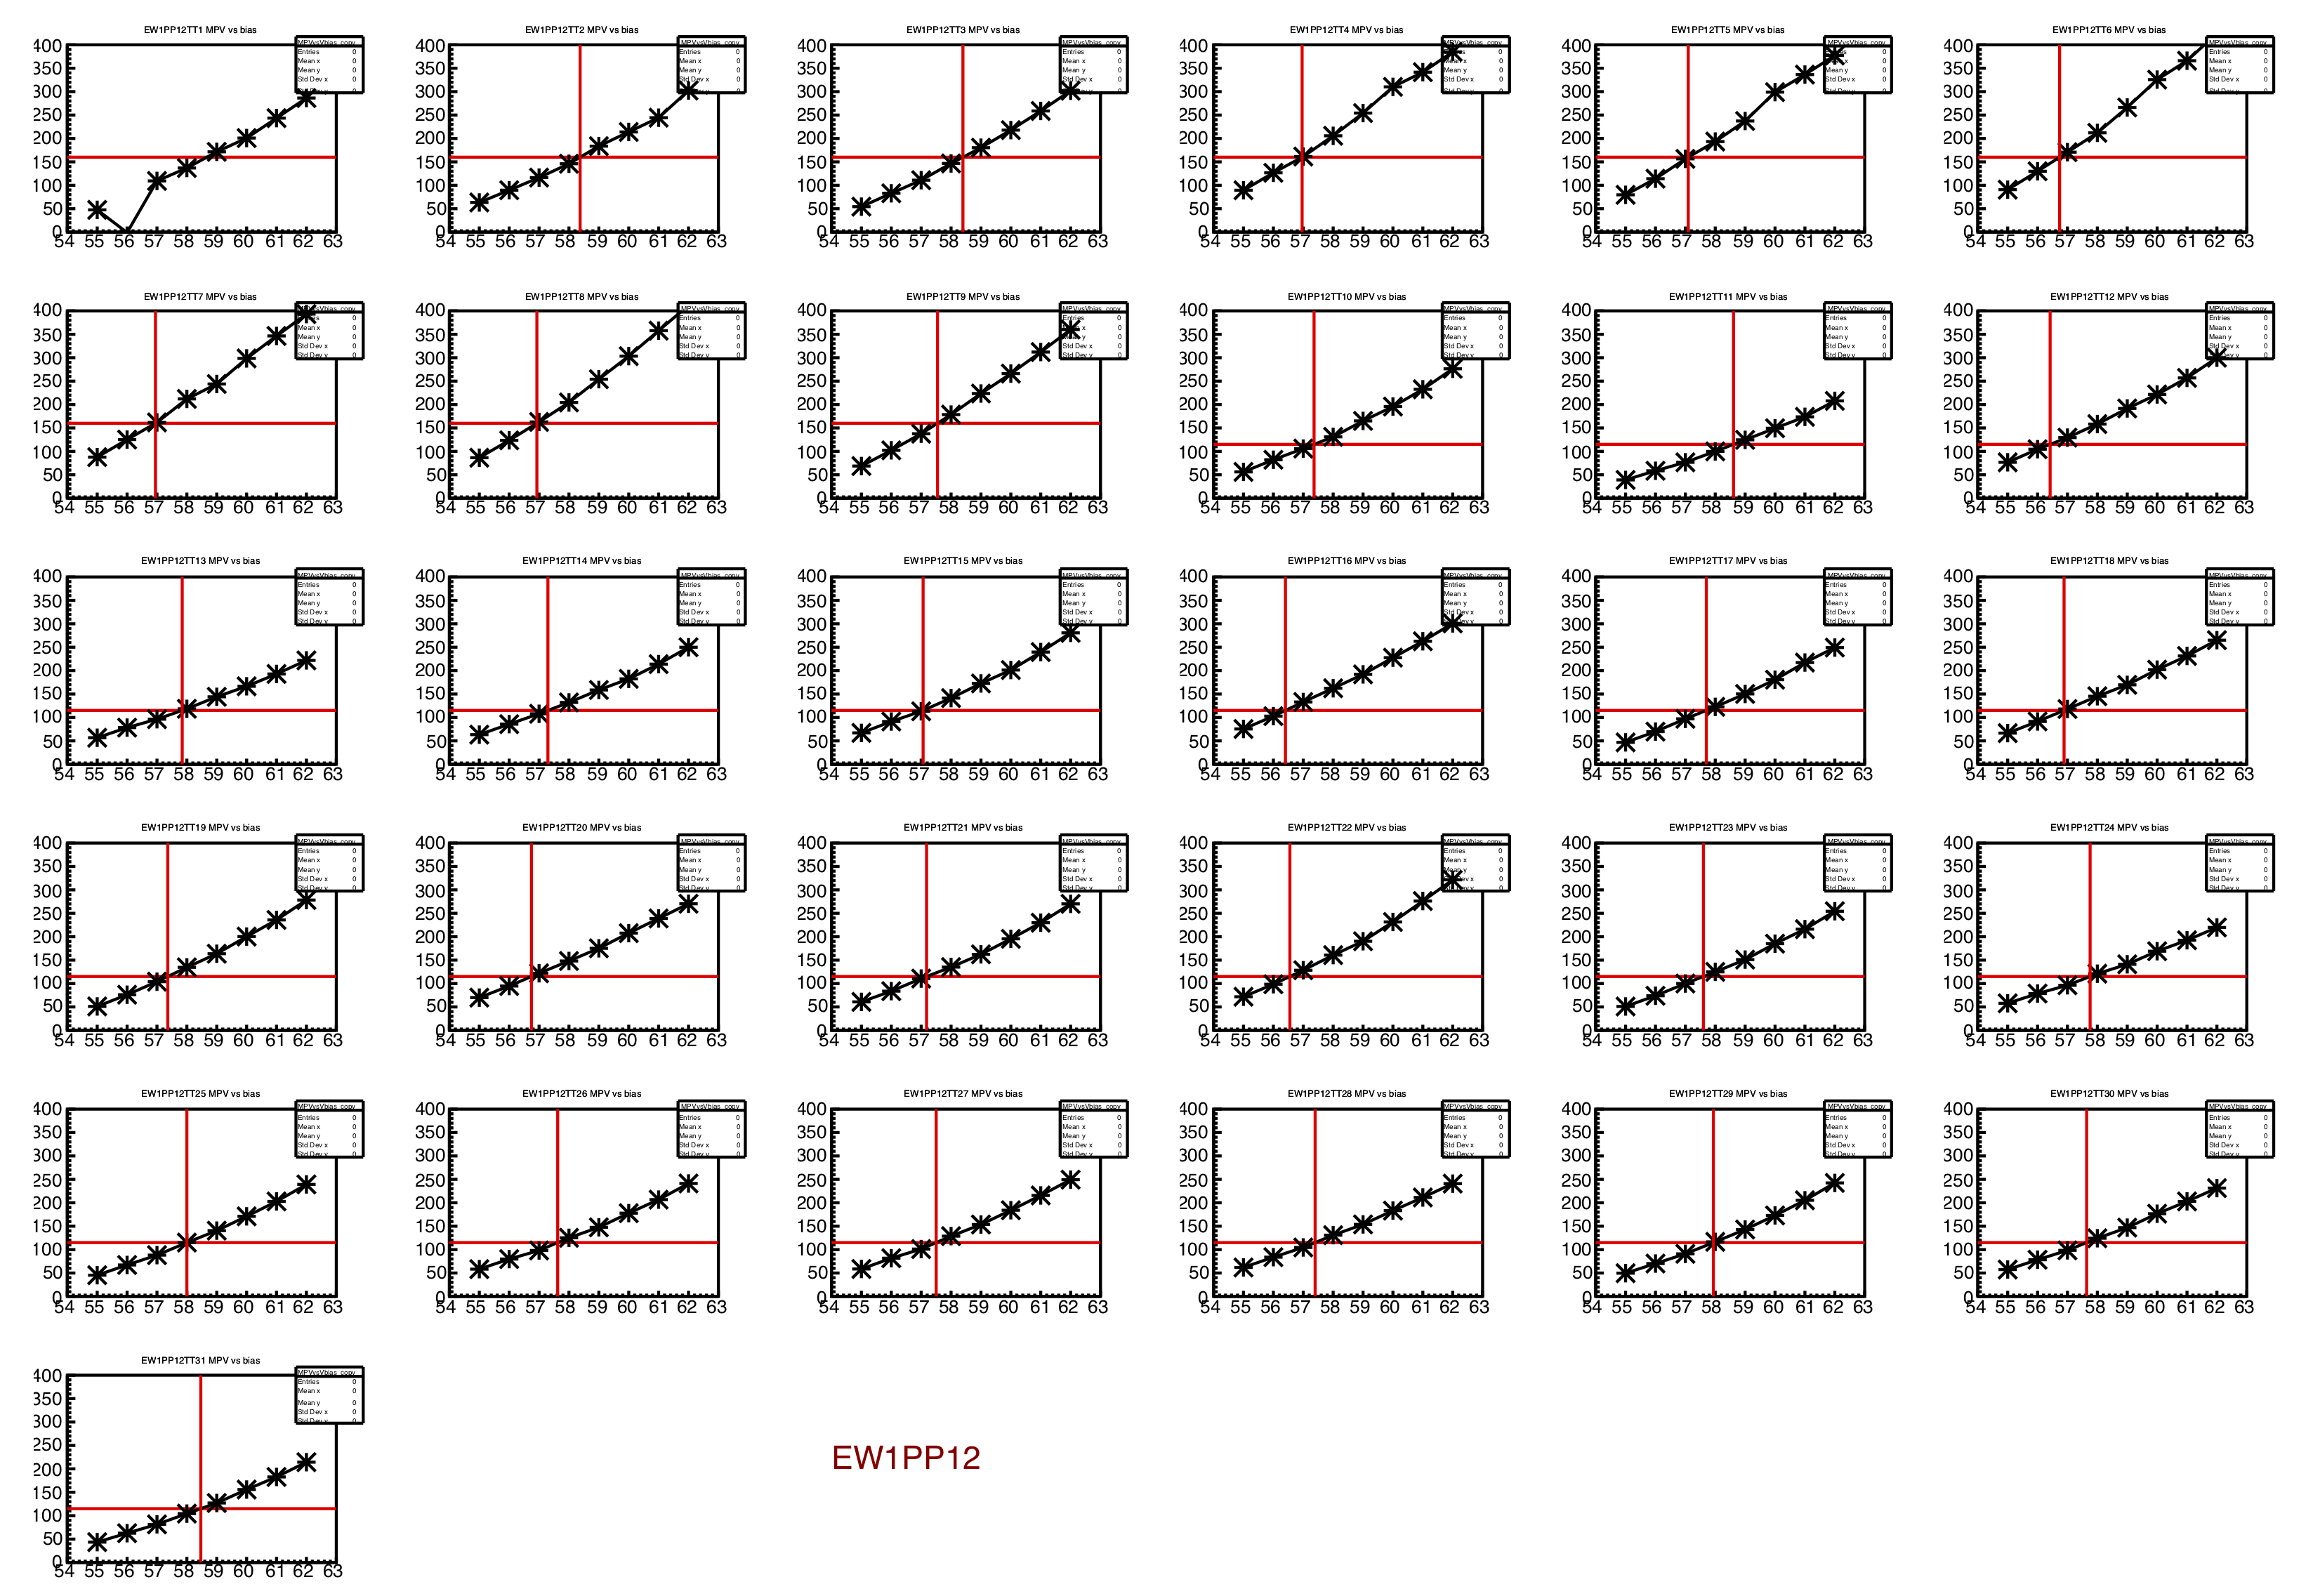
Figure 4 - MIP MPV as a function of Vset, for the 31 tiles (TT01 in upper left) of PP12. This scan taken in 2018.
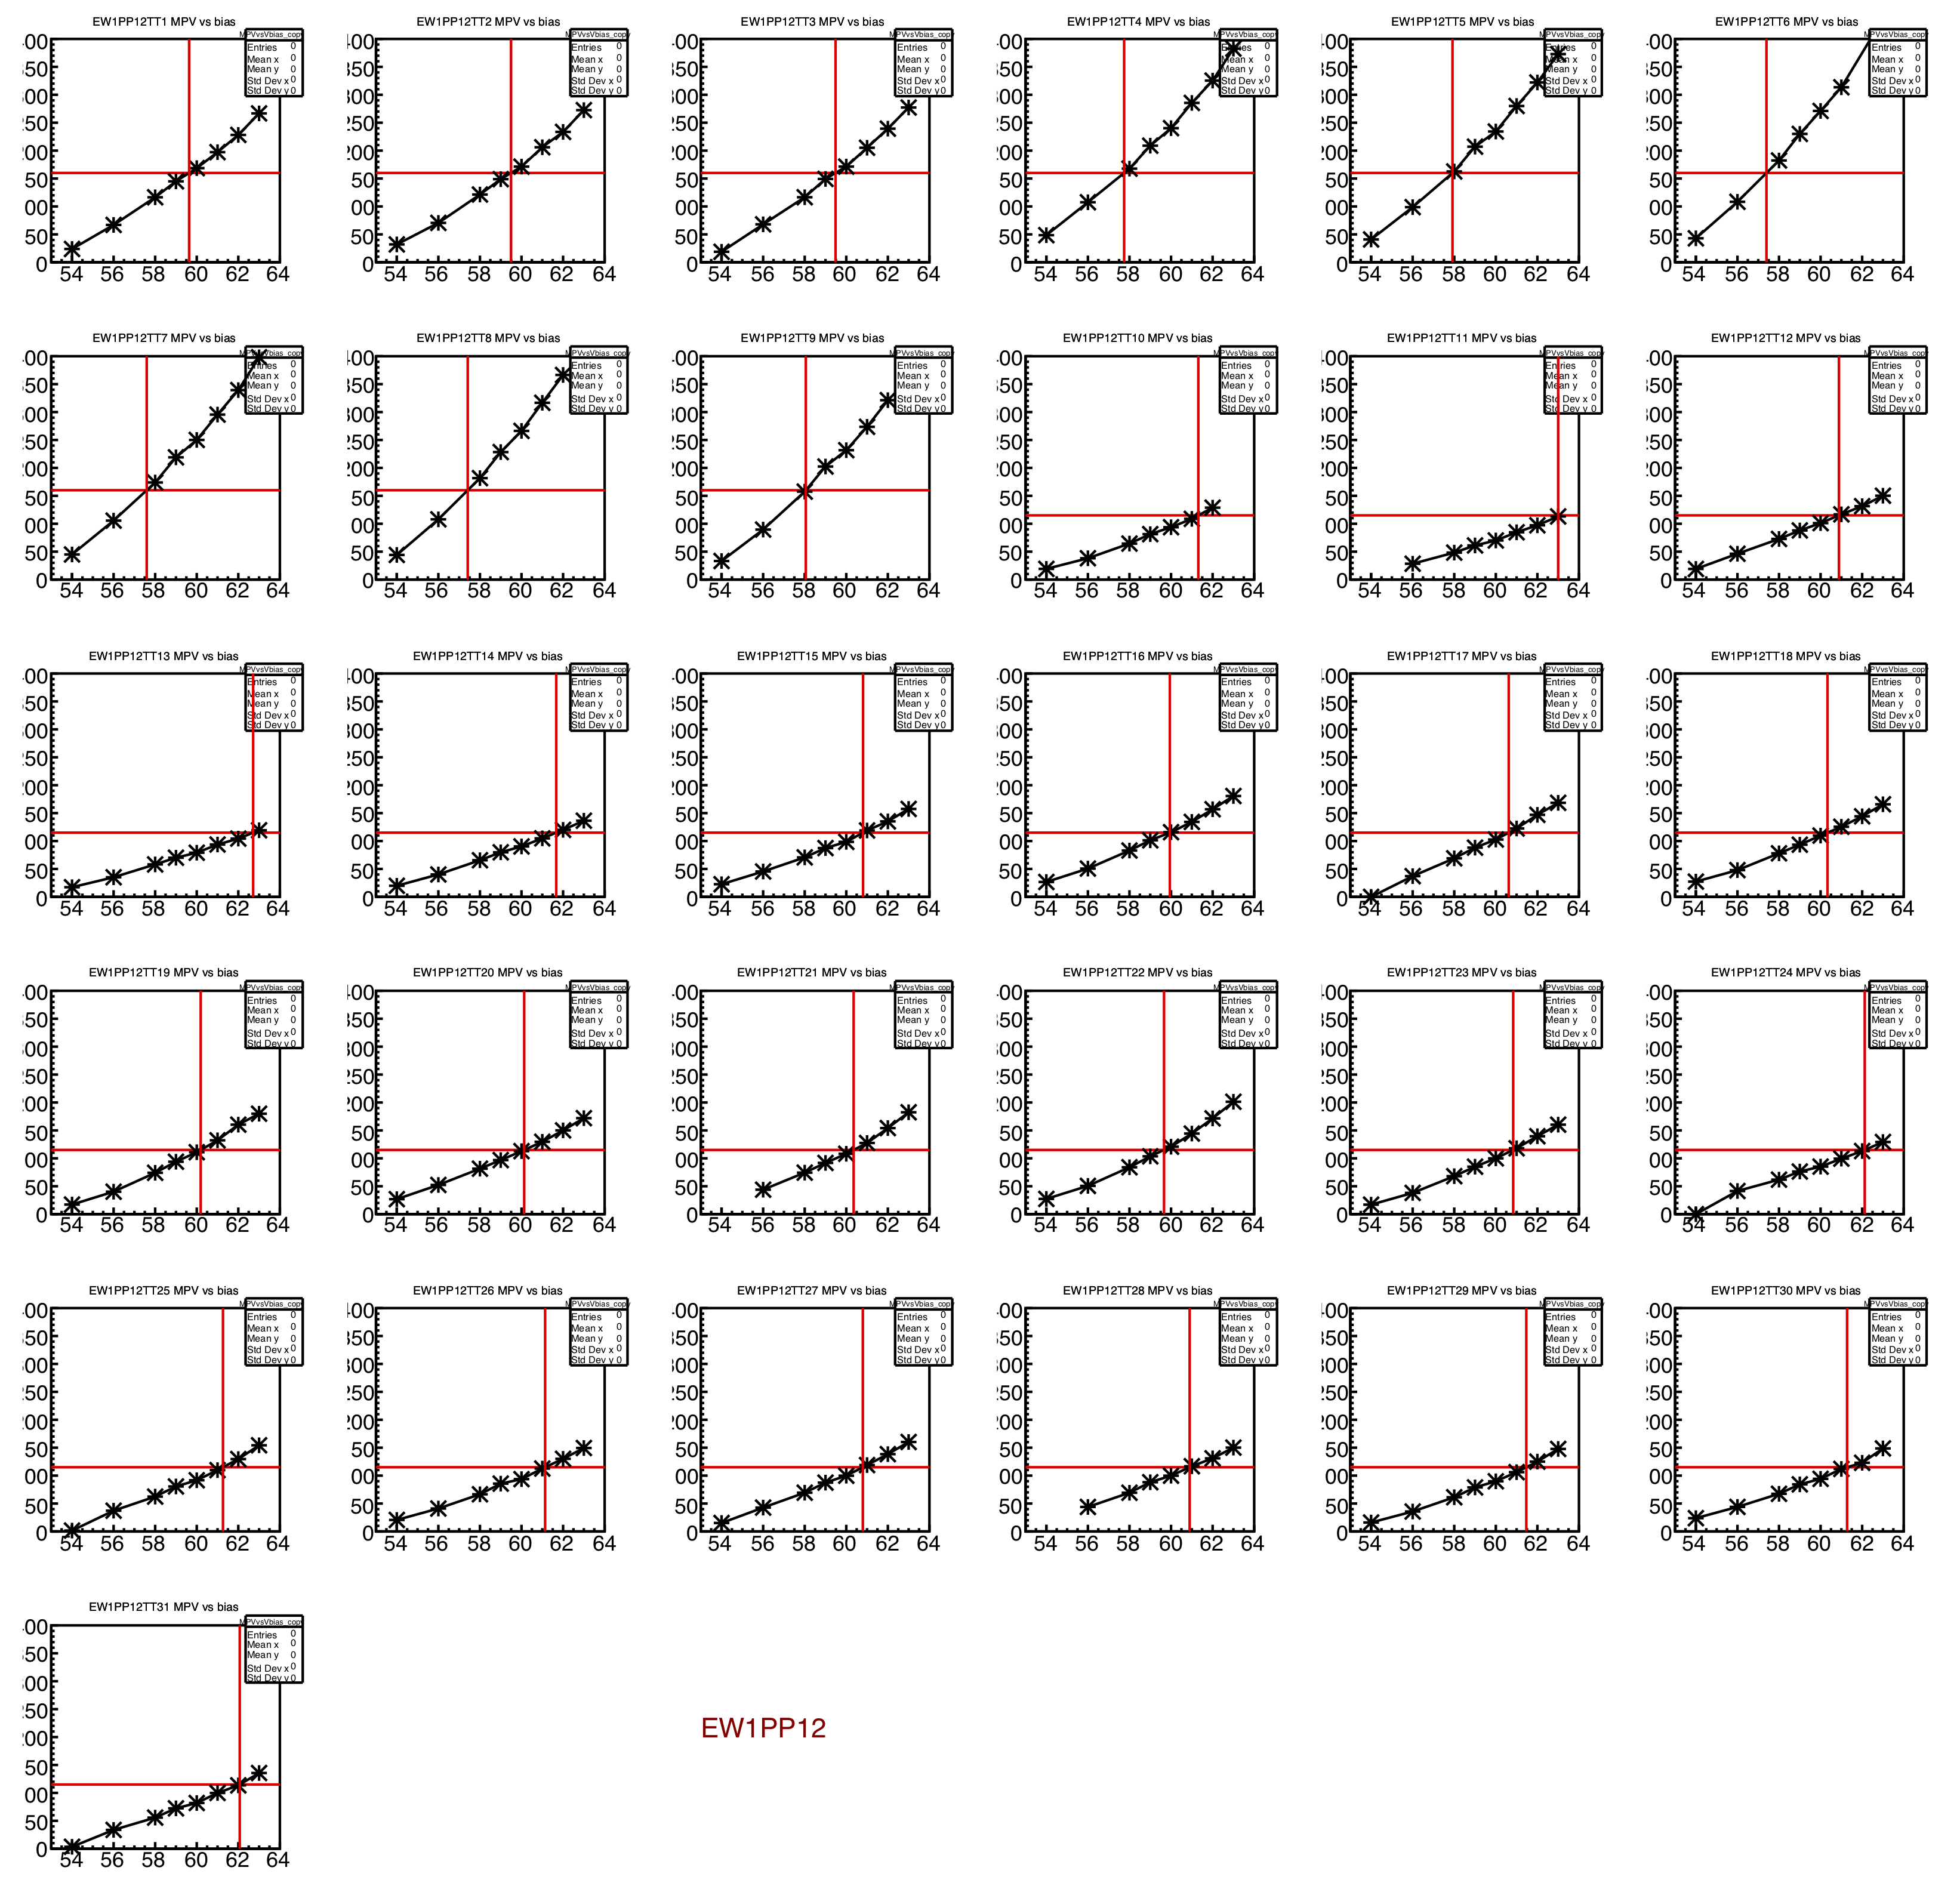
Figure 5 - MIP MPV as a function of Vset, for the 31 tiles (TT01 in upper left) of PP12. This scan taken in 2019.
Note that the x-axis range in figures 4 and 5 are slightly different. And the aspect ratio of the two figures is a little different. But none of that masks the fact that there is a huge difference in the reduction for QT32B (tiles 1-9) and QT32C (tiles 10-31). Wow. So, this really does point the figure toward the electronics, or?
For a very direct comparison, I have done the following: For Vset=60 V, I have the ADC spectra from 2018 (yep, kept them on my laptop) and the ADC spectra from 2019. I have the spectra, side-by-side for all 744 tiles, and the difference is very clear. Even more important, the gain drop is dramatically different, depending on whether the signal is digitized by a QT32B or QT32C. The full pdf file is here
But the most dramatic illustration is shown here:
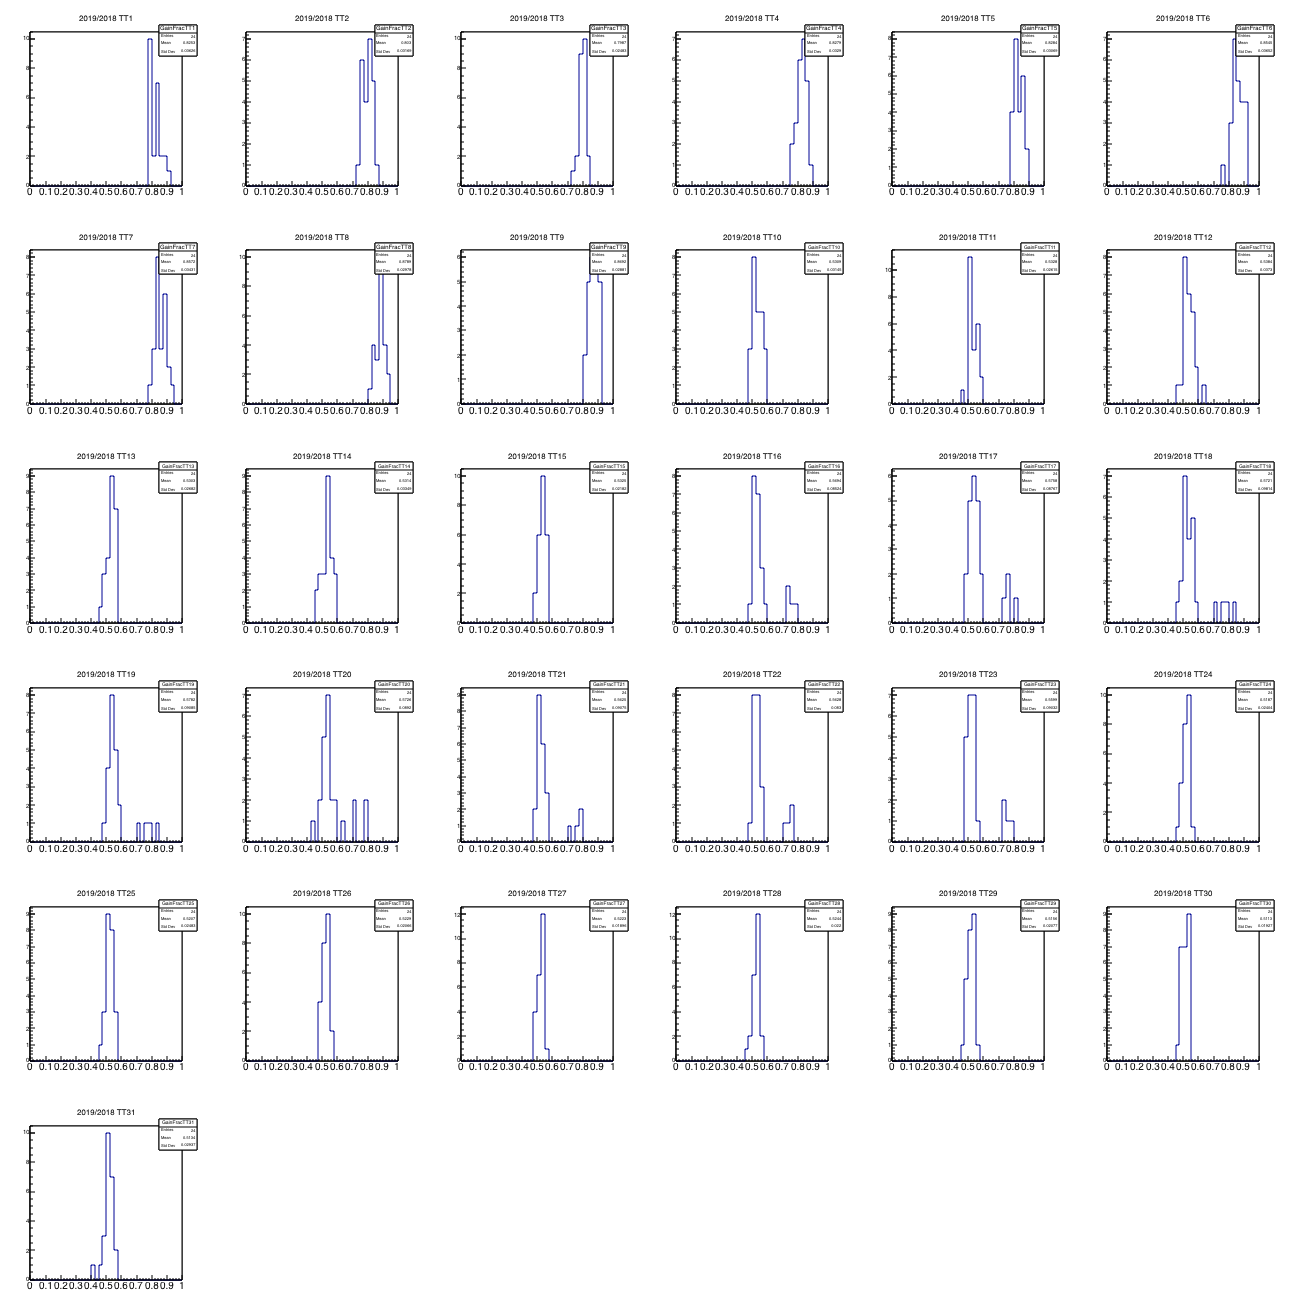
Figure 6 - The MIP peak position for 2019 divided by the MIP peak position for 2018, for Tiles 01 (upper left) through 31 (lowest).
Each panel above corresponds to one tile number (TT). There are 2x12 entries in every panel, because there are 12 supersectors on each side. Tiles 1-9 are read out through QT32Cs and 10-31 through QT32Bs.
This nails it shut. The "gain" has gone down by a factor of two, for the channels read out through the Bs, and "only" 20% or so for those read out through the Cs. This is clearly a QT-related problem. (Which does not necessarily mean an electronics problem. It could be in the settings, or in the gates, or in the data-packing in the daq files, or even in the StTriggerData accessor software used to extract the data. All of these are "related" to the QTs, as opposed to the light collected by the EPD itself. So this is how I use the term.) In all likelihood, the true signal did not decrease at all, either through the Bs or Cs.
Update #3 - late evening 25 feb
Upon the advice of Gerard, we will abandon the approach of trying to compensate for the QT-related gain reduction problem by increasing Vset. Going to too high bias voltage can lead to instabilities, and our ADC resolution will be fine if we let our MIP peaks fall by half.
So, I have done a bias scan analysis, requiring the MIP peaks sit at 60 for QT32Bs and 130 for QT32Cs. (Compare to our previous values of 115 and 160, respectively. Those were the numbers used in 2018, and also above, in the original 2019 setting.)
You can see the entire scan procedure here: https://drupal.star.bnl.gov/STAR/system/files/BiasScan_ReadjustingLowerBias.pdf
And the resulting bias values you can see here: https://drupal.star.bnl.gov/STAR/system/files/VbiasFixedUpByHand_AdjustedLower.txt
I have set these as the bias values late on 25 feb. The original 2019 file (discussed above, with the too-high voltages) is called EPD_TUFFmap02252019_TooHighBias.txt on daqman.
As you can see in the big pdf file, the distribution of Vset voltages is now much closer to our "normal" value of 56-57 Volts.
.png)
- Original post 24 Feb - setting the bias voltages via the scan and evidence that there is a big problem - low "gains"
- Update 1 - 25 Feb - showing that the gate is wide open
- Update 2 - 25 Feb - clear evidence that this is some sort of QT-related problem.
- Update 3 - 25 Feb - setting the bias voltages to values closer to 56 V (and the MIP peaks to lower in ADC counts)
1 - First setting the bias voltages
The EPD was configured for the 2019 run over the weekend 23-24 February, 2019. Rosi, Justin, and Cat were physically in the control room, and Mike joined them by perpetual Skype.
The gate timing was first adjusted as described here: https://drupal.star.bnl.gov/STAR/blog/lisa/epd-timing-scan-run-2019
Then, we performed a bias scan, whereby we varied Vset (Vset ~ Vbias-2V) and mapped out the evolution of the MIP MPV. The goal is that all the tiles that are read out by QT32Bs have their MIP peaks at 115 ADC counts, and the QT32Cs at 160 ADC counts. We followed the same procedure as in 2018, which is documented here.
Whereas the beam was total crap for the 2019 timing scan, it got a lot better for the bias scan, so we could extract the peaks fine. The only problem is...... they are so low!! As shown below, in order to keep the MIP peaks where they were last year, the bias voltages must be much higher. It is NOT clear why, though perhaps we have to revisit the gate timing.
The entire study pdf file and the macro that produced it are attached to the bottom of this page. The resulting Vset values are also there.
First, let's compare peaks for a given tile. First from 2018, then 2019
Figure 1 - MIP peaks from one channel, for different values of Vset (even though the figure says "Vbias", it is "Vset"), for the 2018 bias scan.
Figure 2 - MIP peaks from the same channel as in figure 1, for the 2019 bias scan.
The data sometimes lacks statistics (though here it is fine) and the fits aren't always perfect (though they are okay here, except the 54 V). However, you don't have to rely on any automated fitting. Your eyes tell you that, for the same Vset, the peaks are much lower in ADC value in 2019. This is the story across the line.
To maintain the same peak position, it requires much higher Vset in 2019. Justin noticed that the difference is stronger for tiles read out through QT32Bs. This could be due simply to the larger gain of the QT32Cs. However, it seems to me that the fractional increase would be independent of the gain of the ADC, and indeed, the fractional increase for the channels read through QT32B is indeed larger than the QT32Cs, as shown below.
Figure 3 - The new Vset values are compared with the ones used in 2018 ("old"). Left (right) column is QT32B (QT32C). Top: New versus old Vset. Middle: New/Old. Bottom: New-Old.
Because there is a "QT-flavor" dependence here, and the timing curves for the QTB are so different than those for the QTCs, my suspicions about the source of the mysteriously low peaks remains on the timing.
2 - Update #1 25 feb
However, see this link showing that the gates are indeed open as wide as ever! https://drupal.star.bnl.gov/STAR/blog/lisa/epd-timing-scan-run-2019#update25feb3 - Update #2 25 feb
Let's look in more detail at the QT32B versus QT32C difference. Here are the MIP peak positions versus Vset, for West PP12. First comes 2018 then comes 2019.
Figure 4 - MIP MPV as a function of Vset, for the 31 tiles (TT01 in upper left) of PP12. This scan taken in 2018.
Figure 5 - MIP MPV as a function of Vset, for the 31 tiles (TT01 in upper left) of PP12. This scan taken in 2019.
Note that the x-axis range in figures 4 and 5 are slightly different. And the aspect ratio of the two figures is a little different. But none of that masks the fact that there is a huge difference in the reduction for QT32B (tiles 1-9) and QT32C (tiles 10-31). Wow. So, this really does point the figure toward the electronics, or?
For a very direct comparison, I have done the following: For Vset=60 V, I have the ADC spectra from 2018 (yep, kept them on my laptop) and the ADC spectra from 2019. I have the spectra, side-by-side for all 744 tiles, and the difference is very clear. Even more important, the gain drop is dramatically different, depending on whether the signal is digitized by a QT32B or QT32C. The full pdf file is here
But the most dramatic illustration is shown here:
Figure 6 - The MIP peak position for 2019 divided by the MIP peak position for 2018, for Tiles 01 (upper left) through 31 (lowest).
Each panel above corresponds to one tile number (TT). There are 2x12 entries in every panel, because there are 12 supersectors on each side. Tiles 1-9 are read out through QT32Cs and 10-31 through QT32Bs.
This nails it shut. The "gain" has gone down by a factor of two, for the channels read out through the Bs, and "only" 20% or so for those read out through the Cs. This is clearly a QT-related problem. (Which does not necessarily mean an electronics problem. It could be in the settings, or in the gates, or in the data-packing in the daq files, or even in the StTriggerData accessor software used to extract the data. All of these are "related" to the QTs, as opposed to the light collected by the EPD itself. So this is how I use the term.) In all likelihood, the true signal did not decrease at all, either through the Bs or Cs.
Update #3 - late evening 25 feb
Upon the advice of Gerard, we will abandon the approach of trying to compensate for the QT-related gain reduction problem by increasing Vset. Going to too high bias voltage can lead to instabilities, and our ADC resolution will be fine if we let our MIP peaks fall by half.
So, I have done a bias scan analysis, requiring the MIP peaks sit at 60 for QT32Bs and 130 for QT32Cs. (Compare to our previous values of 115 and 160, respectively. Those were the numbers used in 2018, and also above, in the original 2019 setting.)
You can see the entire scan procedure here: https://drupal.star.bnl.gov/STAR/system/files/BiasScan_ReadjustingLowerBias.pdf
And the resulting bias values you can see here: https://drupal.star.bnl.gov/STAR/system/files/VbiasFixedUpByHand_AdjustedLower.txt
I have set these as the bias values late on 25 feb. The original 2019 file (discussed above, with the too-high voltages) is called EPD_TUFFmap02252019_TooHighBias.txt on daqman.
As you can see in the big pdf file, the distribution of Vset voltages is now much closer to our "normal" value of 56-57 Volts.
»
- lisa's blog
- Login or register to post comments