EPD Cosmic Test 4
For set-up, and early thought processes, see:
drupal.star.bnl.gov/STAR/blog/rjreed/epd-cosmic-test-2
drupal.star.bnl.gov/STAR/blog/rjreed/epd-cosmic-test-3
For two different configurations we have collected a large amount of data:
Configuration 1:
SS index 0 (far) = 8, SS index 1 = 5, SS index 2 = 6, SS index 3 = 7 (near), odd
Trigger Channels are: 9,11,21,23,25,27
101,024 events
ADC Spectra:
drupal.star.bnl.gov/STAR/system/files/EpdAdc_Configuration1_08132017.pdf
Configuration 2:
SS index 0 (far) = 8, SS index 1 = 5, SS index 2 = 6, SS index 3 = 7 (near), odd
Trigger Channels are: 15,17,19,29,31
172,708 events
ADC Spectra:
drupal.star.bnl.gov/STAR/system/files/EpdAdc_Configuration2_08132017.pdf
The combined ADC spectra are at:
drupal.star.bnl.gov/STAR/system/files/EpdAdc_All_08132017.pdf
A good MIP Peak is seen in TT 7 - 31 (odd) for SS 5, 6, 7 and 8.
We have not gathered the statistics to see TT 3 or TT5, and currently our set up does not have us testing TT1.
From the ADC spectra, we were able to determine hit-no-hit values in each tile. Events were selected with:
No more than 5 hits in a given SS.
At least 1 hit in the top and 1 hit in the bottom SS, to act as offline triggers.
For Configuration 1, this yields 30,788 events and for Configuration 2 this yields 84,237 events. I am not certain why the percentages between the two are so different.
I then analyzed events tile-by-tile that only had one hit in a given tile in the top and bottom super-sectors. This removes cosmic showers and other results where it is unclear where the cosmic ray may have hit the detector. Then I only analyze combinations of TT_bottom and TT_Top which have at least 100 entries, to keep the error bars small.
The results can be seen at:
Configuration 1:
drupal.star.bnl.gov/STAR/system/files/EPDCosmicHits_Configuration1_08132017.pdf
Configuration 2:
drupal.star.bnl.gov/STAR/system/files/EPDCosmicHits_Configuration2_08132017.pdf
Combination:
drupal.star.bnl.gov/STAR/system/files/EPDCosmicHits_All_08132017.pdf
Two examples are:

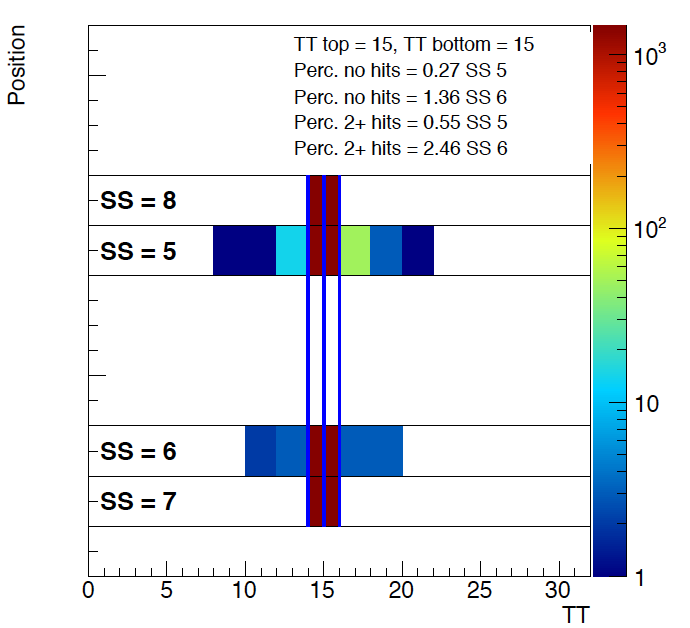
Figure 1: On the left are the hit distributions per TT, for events that only had a single hit in TT 9 for the bottom SS and for TT 15 in the top SS. We then can see the EPD functioning as a tracking detector. Included are the percentage of such events that either had no hit in SS05 or SS06. On the right plot is the same type of analysis, but requiring the top and bottom to have hits in the same tile. Included are the percentage of time we found there were at least two hits in one of the two middle SS. In this configuration the rays should essentially be straight, so this gives us a handle on cross talk.
- rjreed's blog
- Login or register to post comments