EPD UrQMD update - b vs particle mult
Continued from drupal.star.bnl.gov/STAR/blog/rjreed/epd-urqmd-update
The distributions of truncated Nmip by ring (if Nmip > 2, then set Nmip = 2 for a given tile) vs impact parameter:
drupal.star.bnl.gov/STAR/system/files/Rings2D_7.7.png
drupal.star.bnl.gov/STAR/system/files/Rings2D_11.5.png
drupal.star.bnl.gov/STAR/system/files/Rings2D_14.5.png
drupal.star.bnl.gov/STAR/system/files/Rings2D_19.6.png
drupal.star.bnl.gov/STAR/system/files/Rings2D_200.0.png
The distributions of Nch ring by bring:
drupal.star.bnl.gov/STAR/system/files/Rings2DPart_7.7.png
drupal.star.bnl.gov/STAR/system/files/Rings2DPart_11.5.png
drupal.star.bnl.gov/STAR/system/files/Rings2DPart_14.5.png
drupal.star.bnl.gov/STAR/system/files/Rings2DPart_19.6.png
drupal.star.bnl.gov/STAR/system/files/Rings2DPart_200.0.png
The same distribution versus the TPC multiplicity (defined as N_ch with |eta|<1.0):
drupal.star.bnl.gov/STAR/system/files/Rings2DTPC_7.7.png
drupal.star.bnl.gov/STAR/system/files/Rings2DTPC_11.5.png
drupal.star.bnl.gov/STAR/system/files/Rings2DTPC_14.5.png
drupal.star.bnl.gov/STAR/system/files/Rings2DTPC_19.6.png
drupal.star.bnl.gov/STAR/system/files/Rings2DTPC_200.0.png
In both situations, we can see that at low energies, the correlation between the forward rapidity of the EPD (2.1 < |eta| < 5.1) and mid-rapidity switches sign, due to the contributions from spectators vs participants. This sign flip means that summing the contribution with equal weight has a poorer resolution. We looked at different ways to extract the signal from the forward region and compare it to the mid-rapidity region.
An example analysis is:
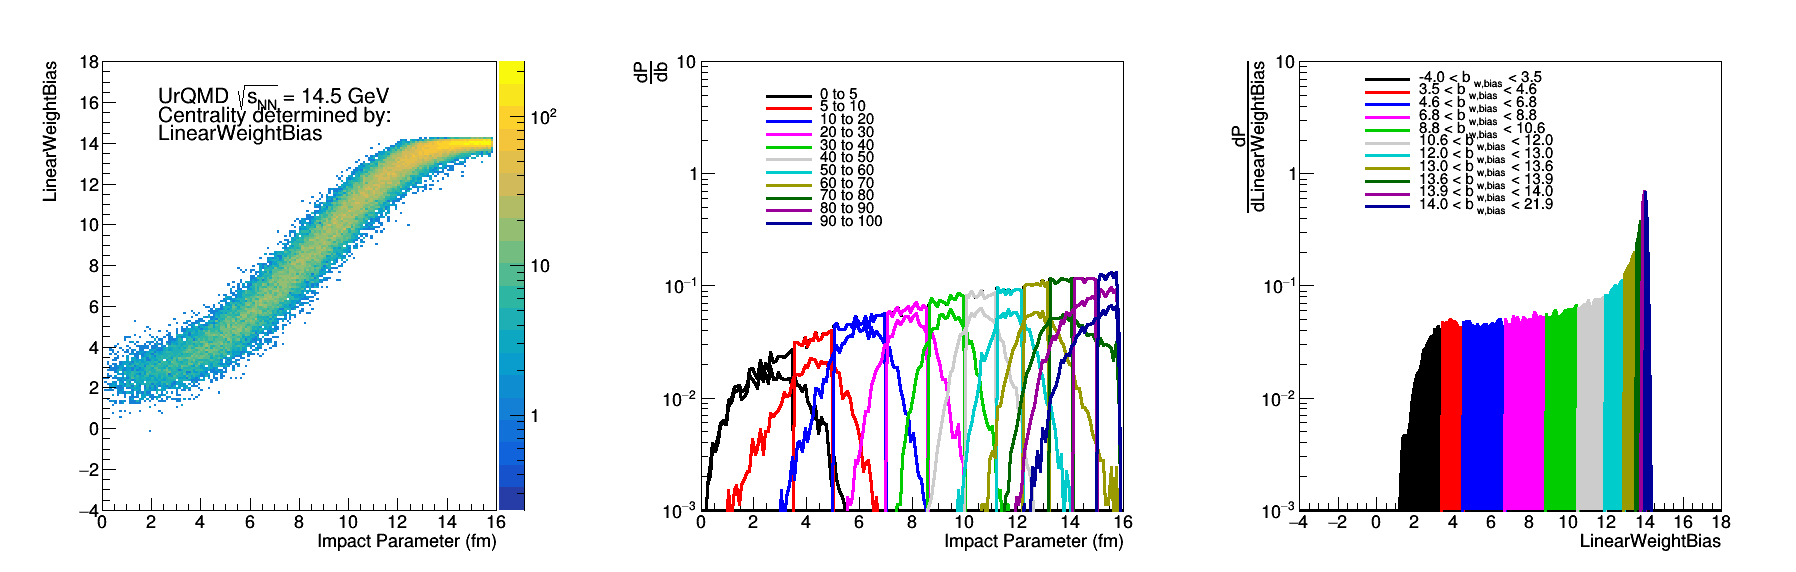
Figure 1: Left distribution of the Linear Weight Bias method vs b. The middle are the impact parameter cuts and the right at the cuts on the linear weight bias distribution.
Figure 1 is an example of the type of distributions we are generating. How the weights were calculated is discussed at: drupal.star.bnl.gov/STAR/blog/rjreed/epd-linear-weights-bias. The middle plot comes directly from the left plot. First the "true" centrality distributions are determined by the various quantiles projection on the X-axis. Then the centrality distributions are found by projecting onto the Y-Axis. This is shown in the right-most plot with the appropriate cuts. Then also plotted in the middle is the impact parameter distribution for these cuts in the linear weighted sample. We can see the spread for these distributions is wider.
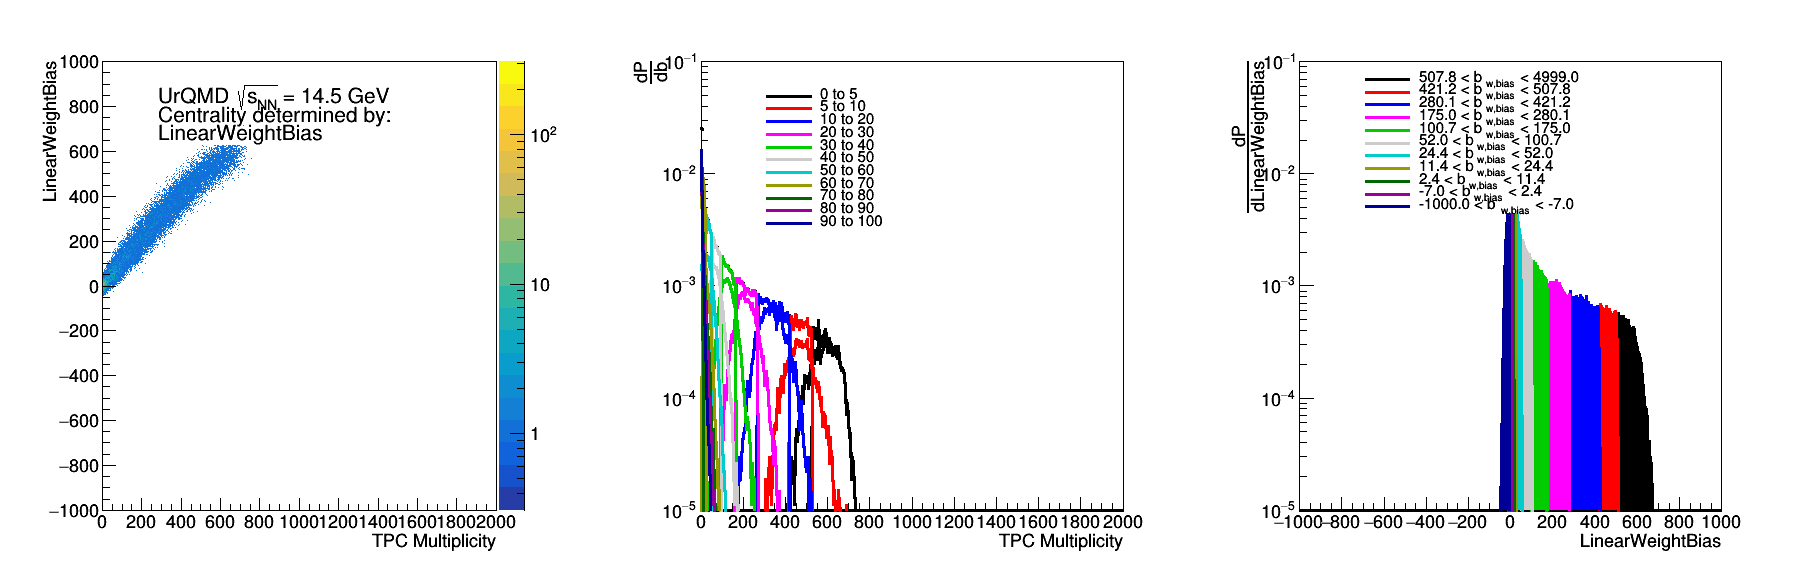
Figure 2: This figure is a repeat for the methodology from Figure 1, but versus the TPC multiplicity instead of the impact parameter.
Since impact parameter is not a measurable quantity, one question is not only how good would the EPD perform in determining the impact parameter, but also how correlated would it be to the central multiplicity.
The full set of plots for all variants for multiplicity vs b are at:
drupal.star.bnl.gov/STAR/system/files/Mult_vs_b_7.7_05122020.pdf
drupal.star.bnl.gov/STAR/system/files/Mult_vs_b_11.5_05122020.pdf
drupal.star.bnl.gov/STAR/system/files/Mult_vs_b_14.5_05122020.pdf
drupal.star.bnl.gov/STAR/system/files/Mult_vs_b_19.6_05122020.pdf
drupal.star.bnl.gov/STAR/system/files/Mult_vs_b_200.0_05122020.pdf
The full set of plots for all variants of multiplicity vs Nch |eta| < 0.5 are at:
drupal.star.bnl.gov/STAR/system/files/Mult_vs_tpc_7.7_05122020.pdf
drupal.star.bnl.gov/STAR/system/files/Mult_vs_tpc_11.5_05122020.pdf
drupal.star.bnl.gov/STAR/system/files/Mult_vs_tpc_14.5_05122020.pdf
drupal.star.bnl.gov/STAR/system/files/Mult_vs_tpc_19.6_05122020.pdf
drupal.star.bnl.gov/STAR/system/files/Mult_vs_tpc_200.0_05122020.pdf
From here, we select only a few that we will continue in our analysis, defined as: (note - charged particles = pi+/-, k+/-,p,pbar only)
Linear Weight Bias (See drupal.star.bnl.gov/STAR/blog/rjreed/epd-linear-weights-bias ) using truncated Nmip (LW_{E})
Linear Weight Particle Bias (Uses charged particles within the EPD acceptance) (LW_{P})
RefMult1 (Charged particles with |eta|<0.5)
RefMult3 (Charged particles with |eta|<1.0 except for p, pbar)
FwdAll (Charged particles 2.1 < |eta| < 5.1 same as epd mult
Truncated Nmip - Summing the truncated Nmip signal from the entire EPD.
The metric used for determining the goodness of the distribution is the sigma_b^2 of the events chosen with centrality indicator X, and the sigma_b^2 of the impact parameter distribution calculated directly. This is shown here:

Figure 3: Distribution of the width of the estimator over the width of the impact parameter. The green points represent RefMult1 and RefMult3 (mid-rapidity particle based). The red lines represent FwdAll and LW_p, so forward particle based. The blue lines are the EPD signal, with the sum of the truncated Nmip in solid symbols and the linear weight in empty.
We see from Figure 3 that the EPD does as good a job as the mid centrality measures at the highest energies. As we go to lower energies, the resolution decreases for the pure counting methodology - but is regained with the weighting.
We can look at the ratio of the distributions vs RefMult1 (the traditional STAR refMult) at:
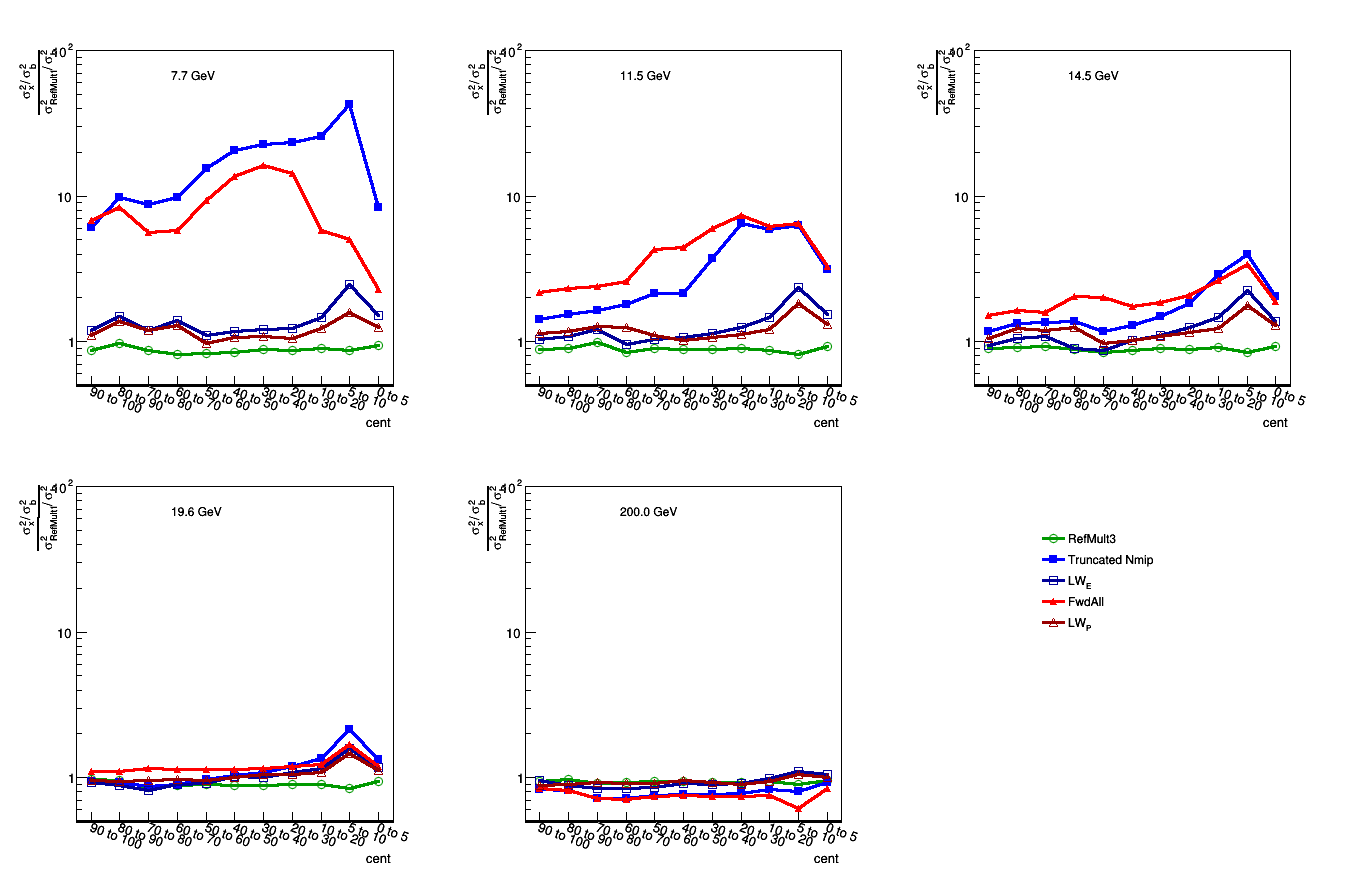
Figure 4: The ratio of the distributions from Figure 3 over the RefMult1 distribution.
Figure 4 shows us that all the methods do a good job at high energies, but at low energies the weighting is needed to regain the resolution.
Performing a similar analysis, but comparing to what I am calling the tpcMult (charged particles with |eta|<1), we find:
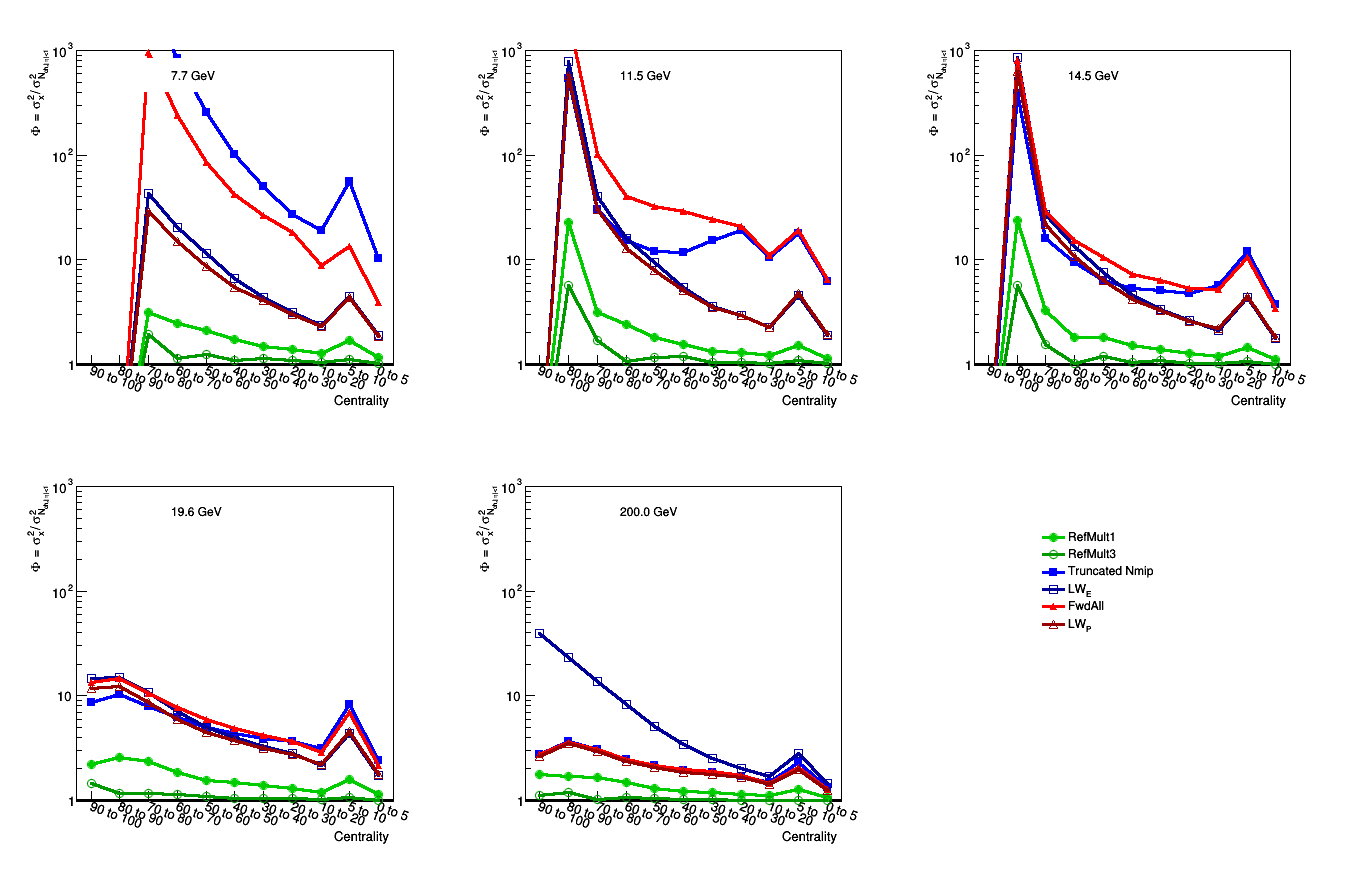
Figure 5: Distribution of sigma_X^2/sigma_TPC^2. For the most peripheral events at the lower energies, many events did not have enough particles at mid-rapidity to really make sensible cuts, so I would ignore 70 - 100% central events.
In Figure 5 we see that RefMult1 and RefMult3 do a very good job - but they are practically the same observable so I don't think it is quite fair to use this. What we want to see is how good does the EPD do at predicting the tpcMult. The weighting is very necessary for having a good resolution at the lower energies (due to the same issue - even at 7.7 GeV the mid-rapidity distributions are dominated by participants, which would have an opposite correlation to the spectators).
- rjreed's blog
- Login or register to post comments