EPD UrQMD update
Update
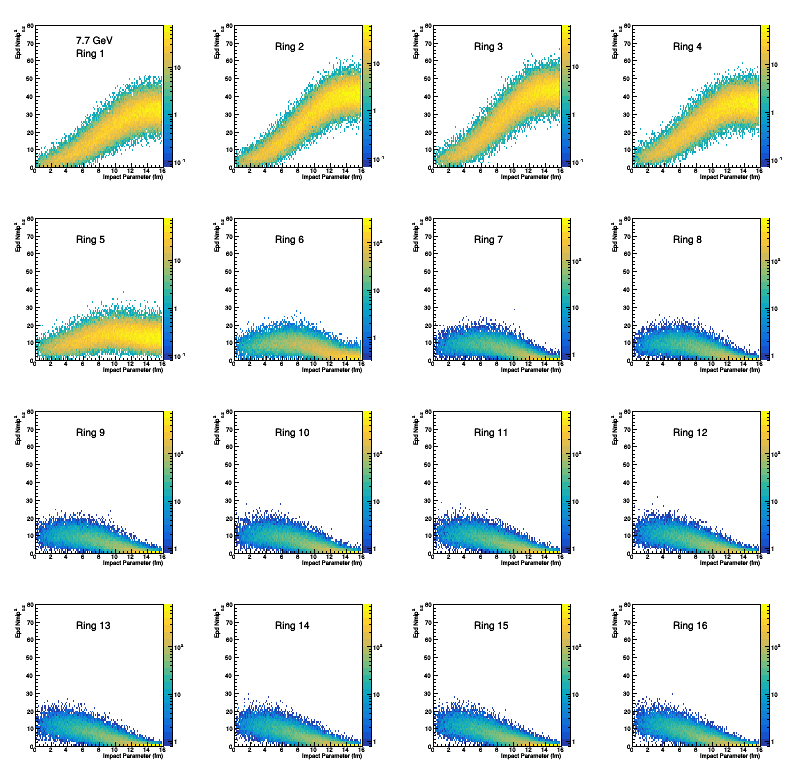

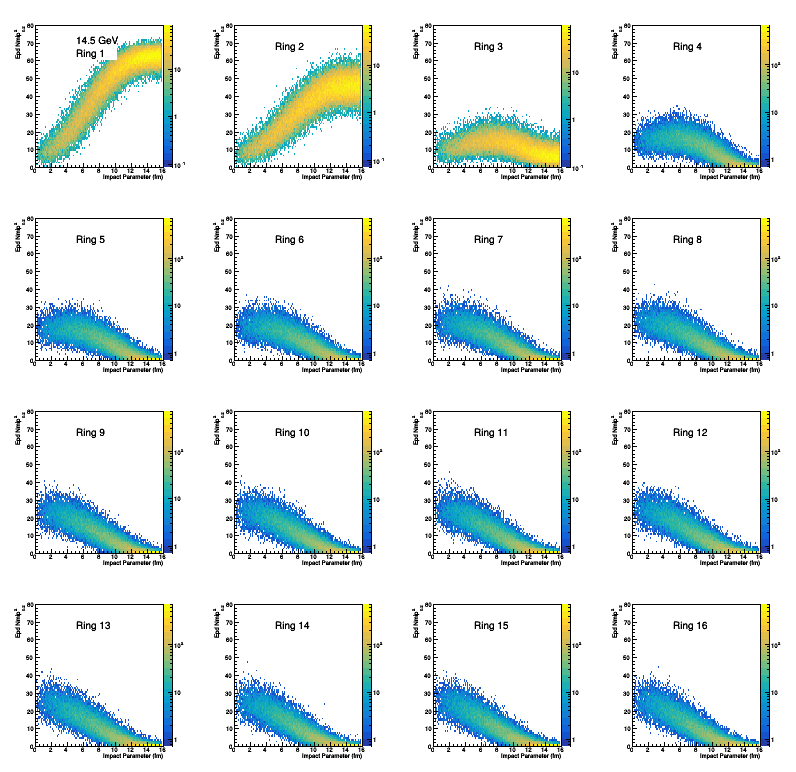
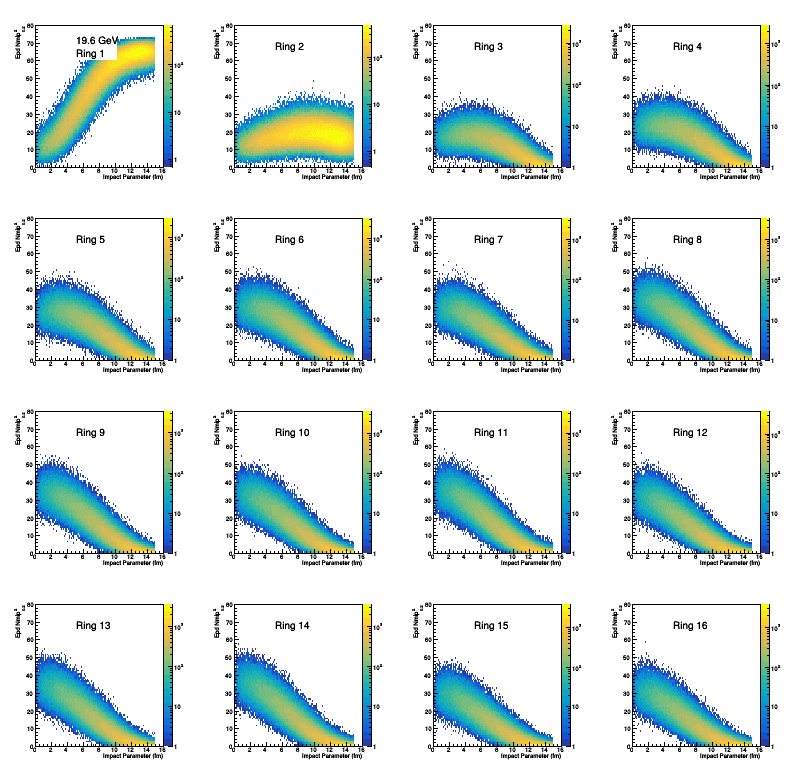
Figure 1: Ok, it's more than 1 figure but all the same - the distribution of truncated EPD Mip Sum for all 16 rings for 3 energies. We can see the correlation change as we go from participant to spectator dominated rings.
We have many different centrality measures that we will look at: (note - charged particles = pi+/-, k+/-,p,pbar only)
Linear Weight (See drupal.star.bnl.gov/STAR/blog/lisa/ring-weights-estimating-global-quantities-linear-sums) using truncated Nmip
Linear Weight Bias (See drupal.star.bnl.gov/STAR/blog/rjreed/epd-linear-weights-bias ) using truncated Nmip
Covariant Weight (See drupal.star.bnl.gov/STAR/blog/rjreed/epd-and-weighted-average ) using truncated Nmip
Linear Weight Particle (Uses charged particles within the EPD acceptance)
Linear Weight Particle Bias (Uses charged particles within the EPD acceptance)
Particle Mult (Total charged particles)
RefMult1 (Charged particles with |eta|<0.5)
RefMult2 (Charged particles with 0.5 < |eta| < 1.0)
RefMult3 (Charged particles with |eta|<1.0 except for p, pbar)
Fwd1 (Charged particles 2.1<|eta|<3.0
Fwd2 (Charged particles 3.0<|eta|<4.0
Fwd3 (Charged particles 4.0<|eta|<5.0
FwdAll (Charged particles 2.1 < |eta| < 5.1 same as epd mult
FwdAll-p (Charged particles 2.1 < |eta| < 5.1 minus protons)
All 2D plots (observable vs b), centrality binning can be found at:
drupal.star.bnl.gov/STAR/system/files/Mult_vs_B_7.7_05042020.pdf
drupal.star.bnl.gov/STAR/system/files/Mult_vs_B_11.5_05042020.pdf
drupal.star.bnl.gov/STAR/system/files/Mult_vs_B_14.5_05042020.pdf
drupal.star.bnl.gov/STAR/system/files/Mult_vs_B_19.6_05042020.pdf
Combining everything together and looking at the widths of the distributions compared to the widths of the impact parameter, we find:
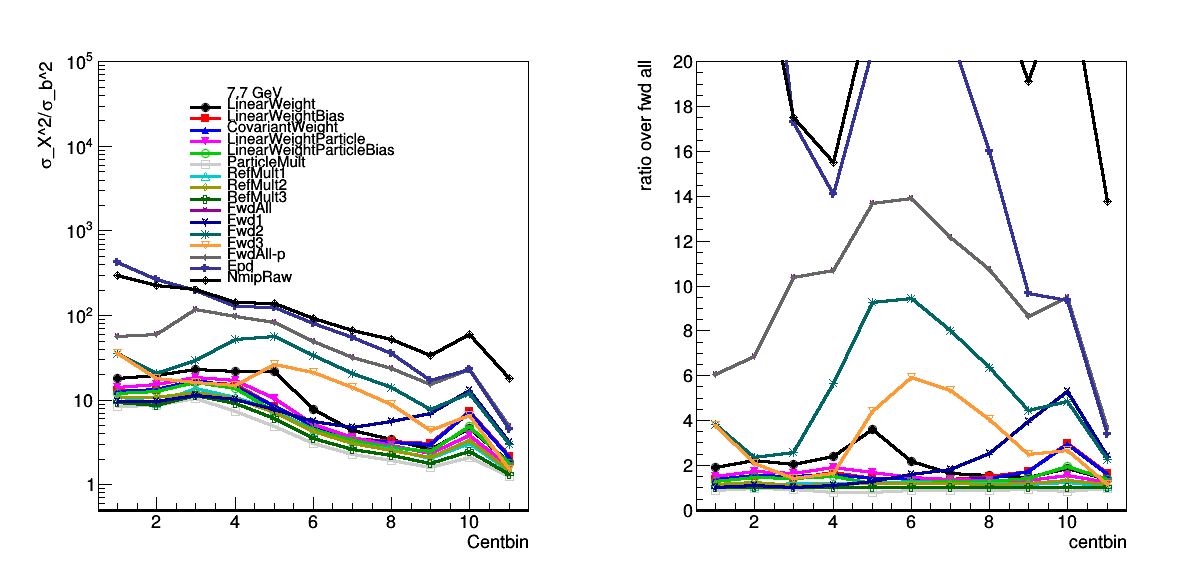
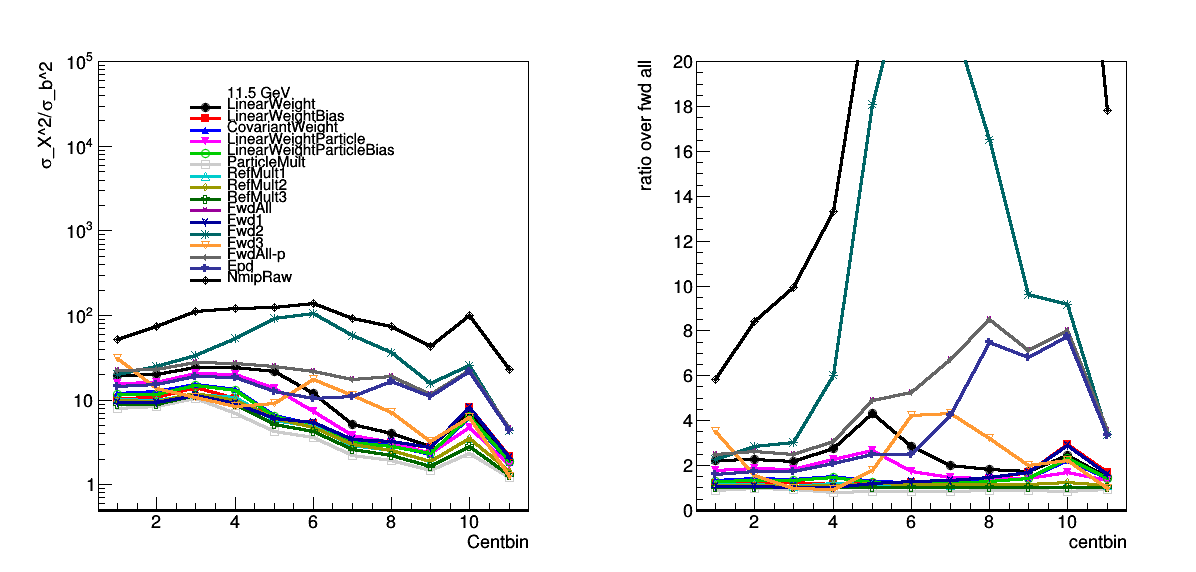
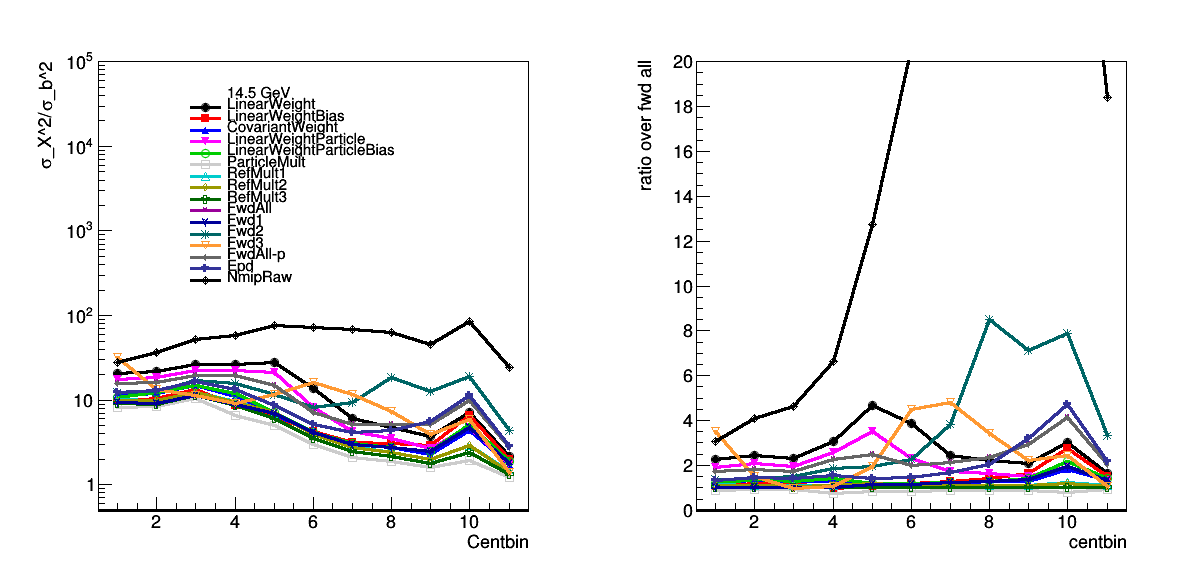
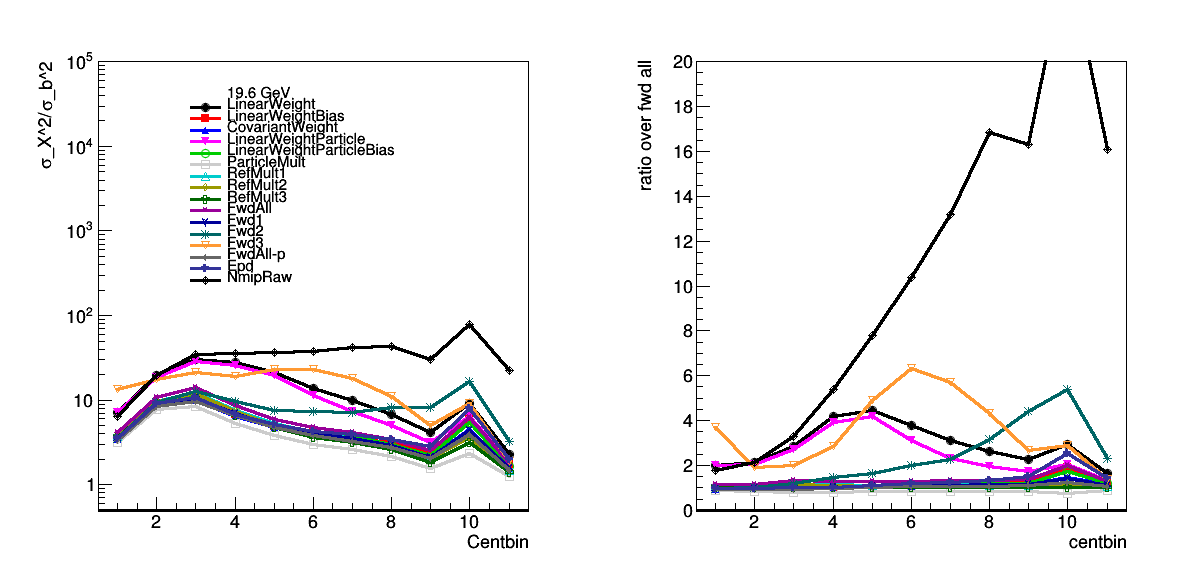
Figure 2: Each figure shows the ratio of the width of a given observable over the width of the impact parameter. The right plots are the ratio of the widths over the forward all width.
- rjreed's blog
- Login or register to post comments