Offline QA
Offline QA Shift Resources
STAR Offline QA Documentation (start here!)Quick Links: Shift Requirements , Automated Browser Instructions , Shift Report Instructions , Online RunLog Browser
|
|
Automated Offline QA BrowserQuick Links: Reference Histograms |
QA Shift Report FormsQuick Links: Issue Browser/Editor, Dashboard, Report Archive |
QA Technical, Reference, and Historical Information
QA Shift Report Instructions
STAR QA Shift Report
- If you know that the experiment is taking data, but no fast offline data is appearing in the QA Browser, please make an effort to understand why there is no data (look at the production hypernews, for example) and post this issue to the Electronic Shift Log (under the QA subdetector) if it has not already been posted. Please also remember to close any such opened issues if the problem is resolved.
- The report is best filled out DURING your shift, not after. This is simply because it is easiest to fill out the form while looking at the data.
- The plan is: one report per shift, many data entries per report.
- You should never select the Back button of your web browser during the report process (and you should never need to do so).
- Do not be afraid to try things out. Until you submit the full report, everything can be modified and reviewed if it has been saved. Also, you can try things out by using a "play" session (see below).
- If you are experiencing problems, try closing the Shift Report window, clearing your browser's cache and restarting the Shift Report forms - it should not lose your data. Additionally, be sure that cookies and javascript are enabled in your browser. If problems persist, please contact Gene Van Buren at gene@bnl.gov or (631-344-7953).
- Choose a session name
- You can also continue a session which was started earlier. This name has no meaning other than to identify one QA Shift Report from another in case more than one person is working on a report simultaneously, and to allow one to restore a report that they have already started if their browser or computer crashes. Your chosen session name should appear next to Session in the Menu. You can also make a copy of another session.
- If you do not see a session name in the Menu, or the name Unknown appears, please try selecting a session again. Problems will arise otherwise.
If you are learning how to use the forms, you may wish to create a "play" session , where a toy report can be generated, but nothing is permanently recorded (the report is not archived, and issues are not attached to runs nor updated for the "last used" lists). Once a session is created, it cannot be changed to or from being a play session, but such sessions can be copied into new play or non-play sessions. - Fill out the Shift Info form.
- Select the Save/Continue button at the bottom of the form when finished. If you are unsure about an item, it can be edited later. If you leave this form (i.e. select any options under Manage Contents) before selecting Save/Continue, you will lose the information you have entered.
- Add data entries
- Do so for each QA job (histogram set) examined by making the appropriate selection from the Add A Data Entry For... submenu. When combining files for QA, use the pull down menu of trigger types instead of typing in a file sequence. Again, select the Save/Continue button when finished with each data entry. And again, these items can be edited later if necessary, and leaving this form (i.e. selecting anything under Manage Contents) before selecting Save/Continue will result in loss of information on the form.
- Focus on issues
- Issues are maintained with the Issue Browser/Editor, which can be reached via Open Issue Browser/Editor in the Menu, or from the data entry forms (where only issues for that data type are listed). Issues can then be made active for a given data entry to indicate that the issue was seen there. The intent here is that opened/created issues may be used repeatedly and can be modified or appended later (if more detail is learned, for example) until they are eventually closed/resolved. A name serves as a brief description of each issue, and a detailed description is available via the Browser/Editor, along with any image attachments for the issue. Each issue may also be given tags (by subsystem/category [required], or keywords [optional]) to aid in finding issues or correlating them later. To be listed in the data entry form of a given data type, an issue must be allowed for that type.
- You may need to Refresh Issues when working on an entry for any newly created issues to appear. Please make an effort to search through the existing issues before creating a new issue. A filter tool appears to make searching for a related issue easier.
- Manage the contents
- After entering each portion of the report, a current contents listing is shown. Each portion may be viewed (by clicking on the item), deleted (by marking the checkbox beside the item and clicking on the Delete button), edited, or copied.
- Submit the QA Shift Report
- When ready to submit, select Finish & Submit Report. This takes you to the final information to be entered for the report. You can save this information and submit later if you decide you are not yet ready to submit the full report. You can also choose not to delete the session after submitting, so that it can be reused and modified another time.
At any time, you may (using the Menu):
- Browse or edit issues by selecting Open Issue Browser/Editor in the Menu.
- View the currently entered portions of the report by selecting View Current Contents.
You may subsequently edit these files or copy their contents into a new data report. - Re-enter or edit the Shift Info by selecting (Re)Enter Shift Info.
- Erase the entire report and start over by selecting Erase Sesson & Start Over.
- Stop the current session and choose to start a new one, or continue a different one, by selecting Session.
OfflineQA DB documentation
QA Browser
To be written.
QA Shift Reports
Three tables in the OfflineQA database are currently used: QAIssues, QARunFileSeqIndex, and QAShiftReports. Their structure and indexing are defined by these create statements:CREATE TABLE QAIssues (ID int not null primary key, Name tinytext,
Description text, closed bool default 0,
timeFirst timestamp default CURRENT_TIMESTAMP,
timeLast int default 0, timeFRP int default 0, timeRDP int default 0,
timeRNT int default 0, timeMDP int default 0, timeMNT int default 0,
flagsFRP bool default 0, flagsRDP bool default 0,
flagsRNT bool default 0, flagsMDP bool default 0, flagsMNT bool default 0);
ALTER TABLE QAIssues ADD INDEX(timeFRP,ID);
ALTER TABLE QAIssues ADD INDEX(timeRDP,ID);
ALTER TABLE QAIssues ADD INDEX(timeRNT,ID);
ALTER TABLE QAIssues ADD INDEX(timeMDP,ID);
ALTER TABLE QAIssues ADD INDEX(timeMNT,ID);CREATE TABLE QArunFileSeqIndex (runYear smallint not null,runDay smallint not null,
run int not null default 0, seq varchar(16) not null, idx tinyint(1) not null,
RepType tinyint(1) not null, RepNum varchar(16) not null, link text,
primary key (runYear,runDay,run,seq,RepType,idx));
ALTER TABLE QArunFileSeqIndex ADD INDEX(RepType,RepNum);CREATE TABLE QAShiftReports (RepType tinyint(1) not null, RepYear int not null,
RepMonth int not null, RepText mediumtext, RepNum varchar(16) not null,
primary key (RepType,RepNum));
ALTER TABLE QAShiftReports ADD INDEX(RepType, RepYear, RepMonth);It would still be good to add a way to quickly identify in which runs a specific issue was seen.
STAR QA Documentation
Lanny Ray, University of Texas at Austin
June 11, 2002
Last Update, Feb. 18, 2009
Index
-
Information for the Fast Offline QA Shift Crew for Run 9
- Information for QA Shifts
- Summary of Fast Offline QA Shift Duties - Run 9
- QuickStart Instructions for the Auto QA Browser - Run 9
- Fast Offline QA Histogram References and Descriptions
- Fast Offline QA Shift Report Preparation and Instructions for Run 9
- Offline QA Shift Report Web Based Form
- Manual generation of QA histograms
-
General References
-
List of Contacts
-
QA Documents for Previous Runs
- Link for Runs 2 - 7
- See child pages below for other Runs (after 7, but prior to current Run)
-
Technical Documentation
webmaster
Last modified: Tue Feb 13 10:42:23 EST 2007
Configuring AutoQA for subsystems
Configuring AutoQA for subsystems
This document is intended for subsystem expert who configure the AutoQA reference histogram analysis in Offline QA for their subsystem. Please note that there are three parts to this process:
- Configuring histogram descriptions
- Configuring the data to use as a histogram reference
- Configuring the analysis parameters.
- All configurations
- Every configuration begins by using the QA browser. Please enter your RCF username and then select "2.1 shift work". The next step you take depends on whether you wish to view data and reference, or just the reference alone. When using the AutoQA system, please take note of the "Help" buttons which are situated at the top right corner of any panel for which contextual help exists and feel free to click these at any time.
- I. Configuring histogram descriptions
- To aid the people who review the QA histograms, each histogram's title and an informative description are to be maintained. Note that descriptions span any trigger types (i.e. a separate description is not needed for minbias histograms vs. high tower histograms).
- If this is all you want to do, you may simply view the references alone for this: use for "View reference histograms" from page 22 of the QA Browser (page 22 is titled "Fast offline, select cuts"), then click "OK on the next page to continue.
- It is also fine to opt for a comparison with real data as it does not affect this step; i.e. this can be done concerrently with configuring reference histograms and/or configuring analysis parameters.
- Use the menus to select the latest references (you may need to click the little arrows on some browsers), and then click on the "Analyze" button which appears.
- After a few moments spent generating graphics of the histograms, the full list of histograms will appear. Scroll to the histograms for your subsystem, and click "Examine" next to any one of them. It is also worth being aware that double clicking on any histogram name will reveal its title, and clicking on "(more)" will also reveal its description (without having to click "Examine").
- After a few moments spent retrieving the individual histogram, a page will display showing details of the histogram. Click on the "Edit (experts only!)" button. Once in Edit mode, you will stay there until you explicitly leave it through a similar action, and you will see a red-dashed border while in this mode.
- The histogram title and description will appear in the middle of the page. Edit these as appropriate, and click the "Update description" button.
- Use the left panel to navigate to the next histogram on which you wish to work (you can use "Prev"/"Next", the table of pages, or select "All" to return to the full list). Then repeat steps 4-5 above as appropriate.
- If this is all you want to do, you may simply view the references alone for this: use for "View reference histograms" from page 22 of the QA Browser (page 22 is titled "Fast offline, select cuts"), then click "OK on the next page to continue.
- II. Configuring reference histograms
- Each histogram's analysis consists of a comparison against a reference histogram.
- Locate a run, or set of runs, where the subsystem is believed to be in proper working order to define a reference.
- If using a single run, opt for "Select auto-combined jobs and compare to a reference histogram."
- Another way to get there is to arrive via the "Check Offline QA" link for any given run from the RunLog, then checking the box so that analysis options are shown, and then selecting plots for the file stream of choice
- If using a set of runs, opt for "Combine several jobs and compare to a reference histogram."
- If unsure of a good run, you will need to hunt through available runs for one which you believe looks good.
- If using a single run, opt for "Select auto-combined jobs and compare to a reference histogram."
- Find the run(s) of interest among those listed and click the OK button.
- Use the provided menu to select the appropriate reference. By default, what the system believes is the appropriate reference (same Run Year, Trigger Setup, and lated Version) is automatically selected. The "Analyze" button will appear when a reference is selected, and you should then click it.
- Repeat steps 3-4 from "Configuring histogram descriptions" listed above. The data histogram and any previous reference will appear near the top of the panel.
- It is important to remember that reference histograms may be general, or specific to a trigger type. If a reference histogram does not exist for a specific trigger type, the analysis will be made comparing to the general one (if it exists). Please consider which purpose you want this histogram to serve and select the trigger type for which it applies appropriately.
- Click the "Mark for Updating Reference" button.
- Repeat the selection of histograms you wish to choose as reference and steps 5-6 until you are ready to submit the entire set of new histograms for reference.
- Click on the "Marked for update" button near the upper left.
- The list of marked histograms will appear, along with a options for the new reference set. By default, the same Run Year and Trigger Setup will be selected, and any other Trigger Setups from the current operations will be listed as alternatives. Whichever is chosen, a new version number will be given automatically. Once the selections are made, a "Submit new reference" button will appear.
- Before submitting, please input comments, such as "BSMDe histograms updated for new dead regions".
- Click the "Submit new reference" button.
- Locate a run, or set of runs, where the subsystem is believed to be in proper working order to define a reference.
- III. Configuring analysis parameters
- Each analysis involves a comparison method ("mode"), possible options for that mode, and a value uses as a cut on whether the analysis passes or fails.
- Repeat steps 1-4 from "Configuring histogram descriptions" listed above. The histogram analysis parameters will appear near the bottom of the panel.
- It is important to remember that analysis parameters may apply to a histogram of any trigger type ("general"), or to a specific trigger type. If analysis parameters do not exist for a specific trigger type, the general analysis parameters for this histogram will be used (if they exist). Please consider which purpose you want these parameters to serve and select the trigger type for which they apply appropriately.
- Select an analysis mode and enter any options. The default of Kolmogorov Maximum Distance and no options works pretty well. More details about the possible modes are listed below these instructions.
- Select a numerical value between 0 and 1 to use as a pass/fail cut.
- For guidance, something near 0.8 will likely catch most discrepancies, but it may be wise to choose a tighter value (e.g. 0.9 or 0.95) initially if no trend records for this analysis are available. The "View Trends" button exists to help in making this selection, presenting the records from any previously set analysis used when the QA shift examined data.
- Click the "Update Cut" button to store the new parameters for use the next time an analysis is run (it is important to be aware that the currently shown analysis and parameter that were used will not update to reflect the new parameters - it must be run again to do so).
- If an analysis is no longer desired to be used, clicking the "Delete Cut" button will exclude it from future analyses. This may be desirable in a case such as where a specific trigger typed analysis may be supplanted by a general analysis for the histogram.
- Use the left panel to navigate to the next histogram on which you wish to work. Then repeat steps 2-6 above as appropriate.
- To assess the performance of the new analysis parameters, click on "Go back ... Back to data selections" near the very top and compare data and reference to see the scores.
___________
Analysis Modes
Currently, three modes are available:
- χ2 Probability: using ROOT's TH1::Chi2Test(). This test can be very sensitive, giving results near 0 for anything which is not a very good match.
- Kolmogorov Probability: using ROOT's TH1::KolmogorovTest(). This test is also quite sensitive, but a bit more forgiving that the χ2.
- Kolmogorov Maximum Distance: using ROOT's TH1::KolmogorovTest() with the "M" option, and taking 1.0 minus the maximum distance result (so that a small maximum distance gives a good score). This test tends to give much better scores to histograms which are less perfect matches, and seems to provide reasonable room for discrepancies, so it is the most commonly used test.
If you are interested in adding another analysis mode, please bring the topic to the starqa-hn hypernews forum. Such a mode can be a custom function written as a plug-in, or an existing root function.
___________
Last updated Feb. 24, 2016 (G. Van Buren)
Fast Offline QA Histogram References and Descriptions
Current (Run 10) descriptions for:
Old links:
QA Reference for General Histograms - Run 9
QA Reference for Trigger Specific Histograms - Run 9
Fast Offline QA and DST Production QA Reference Histograms - Run 8
CL Histograms for Run 10
STAR Offline QA Shift Histogram Description - Run 10
Note: Not all reference plots may be ideal, be sure to carefully read the descriptions.
This page contains the reference histograms and descriptions for the Offline QA system for Run 10. These pages should correspond exactly to the jobs viewed in the Offline QA Browser. However, STAR is a dynamic experiment and the plots generated for QA will change several times throughout the run. If this reference page seems out-of-date, or if you find a job that would make a better reference, please email the QA hypernews list here.
Other links:
Elizabeth W. Oldag for the QA Team.
January 25, 2010.
Page Index for QA Shift Plots
- Page 1
- Page 2
- Page 3
- Page 4
- Page 5
- Page 6
- Page 7
- Page 8
- Page 9
- Page 10
- Page 11
- Page 12
- Page 13

1. StECL event primary vertex check: Primary vertex finding status for run; events with (1) and without (-1) final vertex. The relative fraction of events with primary vertex depends on trigger, beam diamond width and position.
2. StECL point: # hits tpc : Distribution of number of reconstructed space points in TPC per event. Should scale with centrality, depends on multiplicity cut and trigger. For central triggers this distribution peaks at large hit multiplicity.
3. StECL point: # hits ftpc: Not filled in this run. Distribution of number of reconstructed space points in FTPC East (solid line) and West (dashed line) per event. Scales with centrality, depends on multiplicity cut and trigger.
4. StECL point: x-y distribution of hits, tpcE: Scatter plot of the azimuthal distribution of reconstructed space points in the East TPC. The distribution should be azimuthally uniform except for the 12 sector structure of the TPC (lighter areas indicate sector boundaries). Density should decrease radially but inner and outer sector structure should be present (darker areas in the innermost pads of the inner and outer sectors). Watch for empty areas (typically masked RDOs) and hot spots. Notify TPC experts if new empty area or hot spot appears.
5. StECL point: x-y distribution of hits, tpcW: Scatter plot of the azimuthal distribution of reconstructed space points in the West TPC. The distribution should be azimuthally uniform except for the 12 sector structure of the TPC (lighter areas indicate sector boundaries). Density should decrease radially but inner and outer sector structure should be present (darker areas in the innermost pads of the inner and outer sectors). Watch for empty areas (typically masked RDOs) and hot spots. Notify TPC experts if new empty area or hot spot appears.
6. StECL point: r-phi distribution of hits, tpcE: Same as the x-y scatter plot except in polar coordinates.

1. StECL point: r-phi distribution of hits, tpcW: Same as the x-y scatter plot except in polar coordinates.
2. StECL point: z distribution of hits, tpc: Distribution of reconstructed space points in TPC with respect to z-coordinate. There is a broad peak above the nominally flat background at z=0. This is intentional and is done in order to allow identification of post-trigger pileup events. Watch out for any other anamolous steps or unusual spikes or dips. The peaks just outside |z| = 200 cm are new in Run 10.
3. StECL point: #phi distribution of hits, tpc: Distribution of reconstructed space points in TPC with respect to azimuthal coordinate (phi) for east (solid line) and west (dashed line) halves. Should be flat except for the 12-fold sector structure or masked RDOs (as shown). Dead RDO's will produce dips and gaps; hot pads or FEE cards will produce spikes.
4. StECL point: padrow distribution of hits, tpc: Distribution of reconstructed space points in TPC with respect to padrow number 1-45. Should display gradual fall-off; watch for anamolous spikes and dips. Missing RDO's cause drops in the distribution. Padrow 13 was restored in Run 9 and continues to be active in Run 10.
5. StECL point: x-y distribution of hits, ftpcE: Not filled in this run. Radial distribution of reconstructed space points in FTPC East. The distribution should be uniform except for the insensitive gaps between the six readout sectors. Localized denser areas are due to noise. Ideally noisy pads are flagged in the FTPC gain tables so that they are not used for cluster finding. Less densely populated areas not on the sector boundaries are due to dead electronics. Empty areas not on the sector boundaries indicates a serious hardware problem. An FTPC expert should be contacted immediately if this is seen in fast offline-QA during data taking.
6. StECL point: x-y distribution of hits, ftpcW: Not filled in this run. Radial distribution of reconstructed space points in FTPC West. The distribution should be uniform except for the insensitive gaps between the six readout sectors. Localized denser areas are due to noise. Ideally noisy pads are flagged in the FTPC gain tables so that they are not used for cluster finding. Less densely populated areas not on the sector boundaries are due to dead electronics. Empty areas not on the sector boundaries indicates a serious hardware problem. An FTPC expert should be contacted immediately if this is seen in fast offline-QA during data taking.

1. StECL point: plane distribution of hits, ftpc: Not filled in this run. Number of reconstructed space points assigned to tracks in FTPC East (solid line) and West (dashed line) in each padrow. The horizontal axis shows padrow numbers where FTPC-West is 1-10 and FTPC-East is 11-20. Padrows #1 and #11 are closest to the center of STAR. East and West should be similar in shape but West will have less magnitude than east for d+Au. Spikes indicate noisy electronics; dips indicate dead electronics.
2. StECL point: #pads vs #timebins of hits, ftpcE: Not filled in this run. Monitors the cluster quality in FTPC East. Ideally the clusters should have a pad length of 3-5 and a timebin length of 4-6. A prominent peak located at (2,2) indicates bad gas or loss of gain or excessive background.
3. StECL point: #pads vs #timebins of hits, ftpcW: Not filled in this run. Monitors the cluster quality in FTPC West. Ideally the clusters should have a pad length of 3-5 and a timebin length of 4-6. A prominent peak located at (2,2) indicates bad gas or loss of gain or excessive background.
4. StECL Number hits in cluster for bemc: Distribution of number of BEMC towers contributing to energy clusters.
5. StECL Energy of cluster for bemc: Distribution of energy in reconstructed clusters in EMC barrel. Should be peaked with a smooth fall off for minbias data but may display other peaks or structures for other triggers.
6. StECL Eta of clusters for bemc: Azimuthally integrated pseudorapidity distribution of reconstructed energy clusters in the EMC-barrel. Note there will be gaps due to missing and/or uninstrumented sectors. Report any unexpected gaps or unusual spikes. For Run 10 the full barrel is instrumented. The distribution should nominally be flat.

1. StECL Phi of clusters for bemc: Pseudorapidity integrated azimuthal distribution (radians) of reconstructed energy clusters in the EMC-barrel. Note there will be gaps due to missing and/or uninstrumented sectors. Report any unexpected gaps, unusual spikes, or sections of significantly elevated yields.
2. StECL Number hits in cluster for bsmde: Distribution of numbers of hits (anodes) contributing to Barrel SMD clusters along pseudorapidity.
3. StECL Eta of clusters for bsmde: Pseudorapidity distribution of reconstructed energy clusters in the BSMD anode grid along pseudorapidity. Note there will be gaps due to missing and/or uninstrumented sectors. Report any unexpected gaps or unusual spikes. Distribution should nominally be flat.
4. StECL Number hits in cluster for bsmdp: Distribution of numbers of hits (anodes) contributing to Barrel SMD clusters along azimuth.
5. StECL Phi of clusters for bsmdp: Azimuthal distribution of reconstructed energy clusters in the BSMD anode grid along azimuth angle (phi in radians). Note there will be gaps due to missing and/or uninstrumented sectors. Report any unexpected gaps or unusual spikes.
6. StECL EmcCat4 Point Energy: Energy distribution for Barrel EMC-SMD Category 4 clusters. Cat4 clusters correspond to TPC track matched clusters in the EMC barrel, BSMD-eta and BSMD-phi detectors.

1. StECL EmcCat4 Point Eta: Pseudorapidity distribution for EMC-SMD Category 4 clusters. Distribution should nominally be flat.
2. StECL EmcCat4 Point Phi: Azimuthal distribution for EMC-SMD Category 4 clusters. Distribution should nominally be flat.
3. StECL EmcCat4 Sigma Eta: Distribution of widths (sigma) of Category 4 Barrel EMC-SMD clusters with respect to pseudorapidity.
4. StECL EmcCat4 Sigma Phi: Distribution of widths (sigma) of Category 4 Barrel EMC-SMD clusters with respect to azimuthal angle.
5. StECL EmcCat4 Delta Eta: Differences between centroids of Category 4 Barrel EMC-SMD clusters and projected positions of TPC tracks at BEMC with respect to pseudorapidity. Should be peaked at ~0. Not filled in Run 10.
6. StECL EmcCat4 Delta Phi: Differences between centroids of Category 4 Barrel EMC-SMD clusters and projected positions of TPC tracks at BEMC with respect to azimuthal angle. Should be peaked at ~0. Not filled in Run 10.

1. StECL EmcCat4 Points Multiplicity: Frequency distribution of number of Category 4 clusters per event. For central triggers this distribution is peaked at large multiplicity.
2. StECL EmcCat4 Track Momenta : Distribution of TPC global track momentum for Barrel EMC-SMD Category 4 clusters. Not filled in Run 10.
3. StECL Point Flag: Distribution of Barrel EMC and SMD cluster types by Category number. There should be a reasonable fraction of Cat4 clusters as in this example histogram; report if this fraction drops significantly. For central triggers the relative fraction of Cat4 clusters should be larger than for MinBias.
4. StECL globtrk: iflag - all : Quality flag values for all global tracks. Some with large, negative values may not appear on plot; check stat. box for underflows. Majority of tracks should have iflag>0, corresponding to good, usable tracks. Refer to: dst_track_flags.html and kalerr.html for description of flag values. Note that in Runs 7-10 about half the tracks have iflag < 0.
5. StECL globtrk: tot good tracks - all: Distribution of the number of good global tracks in the TPC per trigger; including pileup. For the central trigger this distribution peaks at large multiplicity.
6. StECL globtrk: tot good tracks - ftpc: Not filled in this run. Scatter plot of good global track multiplicities in FTPC West versus FTPC East.

1. StECL globtrk: Detector ID good tracks - all: Global track detector IDs for good tracks. Refer to: /afs/rhic/star/packages/DEV00/pams/global/inc/StDetectorDefinitions.h for Detector ID codes.
2. StECL globtrk: z-DCA to Beam Axis, coarse scale: Coarse scale distribution along the z-axis (from -200 to +200 cm) of the DCA points to the nominal beam line (z-axis, x=y=0) for all TPC global tracks. Peaks indicate probable locations of individual collision vertices however indentification of individual collision vertices is unlikely.
3. StECL globtrk: z-DCA to Beam Axis: Fine scale distribution along the z-axis (from -50 to +50 cm) of the DCA points to the nominal beam line (z-axis, x=y=0) for all TPC global tracks. Peaks indicate probable locations of individual collision vertices.
4. StECL globtrk: z-DCA to Beam Axis vs tanl, tpc: Scatter plot of the tangent of the dip angle (tanl) versus the z-coordinate (from -25 to 25 cm) of the DCA points to the nominal beam line (z-axis, x=y=0) for all TPC global tracks. Vertical bands should be seen corresponding to individual events. The bands should be smooth and continuous; breaks at tanl=0 indicate probable TPC calibration errors in either the t0 offset or the drift speed. This is best seen for high multiplicity events. Cross reference for calibration errors with z-DCA to beam axis versus z-coord. of first hit on track.
5. StECL globtrk: z-DCA to Beam Axis vs z-first: Scatter plot of the z-coordinate of the first fitted hit in the TPC versus the z-coordinate (from -25 to 25 cm) of the DCA points to the nominal beam line (z-axis, x=y=0) for all TPC-only global in which the first point used in the fit lies in the TPC. Vertical bands should be seen corresponding to individual events. The bands should be smooth and continuous; breaks at z=0 indicate TPC calibration errors in either the t0 offset or the drift speed. This is best seen for high multiplicity events.
6. StECL globtrk: z-DCA to Beam Axis vs psi: Scatter plot of the azimuthal direction angle (psi) versus the z-coordinate (from -25 to 25 cm) of the DCA points to the nominal beam line (z-axis, x=y=0) for all TPC global tracks. Vertical bands should be seen corresponding to individual events. The bands should be smooth, straight and continuous indicating azimuthal symmetry in the tracking. Bends or offsets could indicate problems in individual TPC sectors such as voltage sags or drifts. These are best studied with high multiplicity events.

1. StECL globtrk: padrow of first hit on trk, tpc: Distribution of first fitted space point with respect to pad row number for TPC-only global tracks. Should peak at 1 with a minor peak at padrow 14 (beginning of outer sector); the latter should not be too big relative to that at row 1. Other peaks may indicate large, missing sections of the TPC read-out causing breaks, and consequently additional, false new starting points for tracks. The excess data for TPC west beyond padrow 35 is due to EEMC tracking needs.
2. StECL globtrk: z of first hit on trk, tpc: Distribution of first fitted space point with respect to z for TPC-only global tracks. Should be approx. symmetric.
3. StECL globtrk: first point: hit - helix, tpc: Residuals at FIRST point on track for TPC-only global tracks. The quantities plotted are the longitudinal (along z-axis, dashed line) and transverse (in x-y plane, solid line) differences between the coordinates of the first hit and the DCA point on the helix fit to the first point. For the transverse residual, positive (negative) values correspond to hits inside (outside) the circular projection of the helix onto the bend plane. FWHM should be less than ~ 1cm.
4. StECL globtrk: phi of first point on trk, tpc: Distribution of first fitted space point with respect to azimuthal angle (phi) for TPC-only global tracks. The solid (dashed) line is for the east (west) half of the TPC. These should be approximately equal and flat within statistics, except for the 12-sector structure.
5. StECL globtrk: chisq0, tpc: Chi-square per degree of freedom for TPC global tracks. Should peak just below 1.
6. StECL globtrk: signed impact param from prim vtx, tpc: Two-dimensional (2D) (in the transverse plane) signed impact parameter (in cm) from primary vertex for East (solid line), West (dashed line) and All (dotted line) TPC-only global tracks. Should be centered at zero depending on the TPC calibration status used in fast-offline QA production.

1. StECL globtrk: tanl(dip) vs. (zfirst-zvtx)/arc length, tpc,tpc+svt: Scatter plot of tangent of dip angle (tanl) versus (z_first - z_primvrtx)/arc-length for TPC-only global tracks whose first fitted point is in the TPC. Variable 'z_first' is the z coordinate of the first fitted point in the TPC. Variable 'z_primvrtx' is the z-coordinate of the primary vertex for the event. Variable 'arc-length' is 2R*arcsin(delta_r/2R) where R = track radius of curvature and delta_r is the transverse distance between the primary vertex and the first hit on track. Primary tracks lie along the 45 deg diagonal. Secondary tracks and strays lie scattered to either side. The diagonal band should appear clearly and be straight and smooth without kinks, breaks or bends.
2. StECL globtrk: N points on trk,ftpc: Not filled in Run 10. Distribution of the number of fitted points on track for FTPC-East (solid line) and FTPC-West (dashed line) global tracks. Distributions should be similar except fewer tracks for west than east. Also depends on the relative fraction of active readout in each detector.
3. StECL globtrk: psi, ftpc: Not filled in Run 10. Azimuthal distributions for track direction angle (psi) for FTPC-East (solid line) and FTPC-West (dashed line) global tracks. These should be flat within statistics except for the hexagonal FTPC sector structure. There will be fewer west tracks than east for d+Au.
4. StECL globtrk: |eta|, ftpc: Not filled in Run 10. Distributions of absolute value of pseudorapidity for FTPC-East (solid line) and FTPC-West (dashed line) global tracks. These should be similar (modulo for d+Au) and range from about 2.5 to 4.5.
5. StECL globtrk: pT, ftpc: Not filled in Run 10. Transverse momentum (GeV/c) distributions for FTPC-East (solid line) and FTPC-West (dashed line) global tracks. These should be similar (modulo d+Au)within statistics.
6. StECL globtrk: momentum, ftpc: Not filled in Run 10. Total momentum (GeV/c) distributions for FTPC-East (solid line) and FTPC-West (dashed line) global tracks. These should be similar (modulo d+Au) within statistics.

1. StECL globtrk: impact param from prim vtx, ftpc: Not filled in Run 10. Distribution of impact parameter values for global FTPC East tracks (solid curve) and West tracks (dashed curve) with respect to the main TPC global track determined primary vertex.
2. StECL globtrk: Y vs X of first hit on trk, ftpcE: Not filled in Run 10. Scatter plot of (x,y) coordinates for the first fitted space points in FTPC-East global tracks. These should be uniformly populated with hits; FTPC hexagonal structure is apparent.
3. StECL globtrk: Y vs X of first hit on trk, ftpcW: Not filled in Run 10. Scatter plot of (x,y) coordinates for the first fitted space points in FTPC-West global tracks. These should be uniformly populated with hits; FTPC hexagonal structure is apparent.
4. StECL primtrk: iflag - all: Quality flag values for all primary tracks. Some with large, negative values may not appear on plot; check stat. box for underflows. Majority of tracks should have iflag>0, corresponding to good, usable tracks. Refer to: dst_track_flags.html and kalerr.html for description of flag values.
5. StECL primtrk: tot num tracks iflag>0: Distribution of total number of primary tracks per triggered event. For central trigger data this distribution peaks at large multiplicity.
6. StECL primtrk: ratio primary/global tracks w/ iflag>0: Ratio of good primary to good global tracks for all detectors. For Au-Au this ratio usually peaks at about 0.5.

1. StECL primtrk:, ftpc: Not filled in Run 10. Transverse momentum (GeV/c) distributions for FTPC-East (solid line) and FTPC-West (dashed line) primary tracks. These should be similar within statistics.
2. StECL primtrk: ||, ftpc: Not filled in Run 10. Distributions of absolute value of mean pseudorapidity for FTPC-East (solid line) and FTPC-West (dashed line) primary tracks. These should be similar within statistics and range from about 2.5 to 3.5.
3. StECL primtrk: first point: hit - helix (r,z), tpc: Residuals at first point on track for TPC-only primary tracks. The quantities plotted are the longitudinal (along z-axis, dashed line) and transverse (in x-y plane, solid line) differences between the coordinates of the first hit and the DCA point on the helix fit to the first point. For the transverse residual, positive (negative) values correspond to hits inside (outside) the circular projection of the helix onto the bend plane. FWHM should be less than ~ 1cm.
4. StECL primtrk: |eta|, ftpc: Not filled in Run 10. Distributions of absolute value of mean pseudorapidity for FTPC-East (solid line) and FTPC-West (dashed line) primary tracks. These should be similar within statistics and range from about 2.5 to 3.5.
5. StECL primtrk: pT, ftpc: Not filled in Run 10. Transverse momentum (GeV/c) distributions for FTPC-East (solid line) and FTPC-West (dashed line) primary tracks. These should be similar within statistics.
6. StECL dedx: ratiomean to Bethe Bloch Distribution of ratio of mean dE/dx to Bethe-Bloch dE/dx for pions at the same momentum for TPC-only global tracks. Should peak at ~1. Tests calibration of charge deposition in TPC gas., tpc,tpc+svt:

1. StECL PID: globtrk-dst_dedx, p vs dedx (reconstructed): Scatter plot of truncated mean dE/dx versus total momentum (GeV/c) for TPC-only global tracks. Should be able to see Bethe-Bloch bands for pions, kaons and protons if statistics are sufficient.
2. StECL vertex,prim: z : Distribution of primary vertex position along the z-axis out to abs(z) < 50 cm.
3. StECL vertex,prim: x versus y: Scatter plot of the (x,y) coordinates of the primary vertex position. This should correspond to the determined beam transverse position. The amount of dispersion will depend on the trigger condition and multiplicity cuts.
4. StECL vertex,prim: x(ftpcE)-x(tpc) vs y(ftpcE)-y(tpc): Not filled in Run 10. Scatter plot of the differences in x-y position (cm) for primary vertex positions determined by FTPC East global tracks and main TPC glbtrks. Should scatter about (0,0).
5. StECL vertex,prim: z(ftpcE)-z(tpc): Not filled in Run 10. Distribution of the differences along the z-axis, i.e. beam direction, in cm for primary vertex positions determined by FTPC East global tracks and main TPC glbtrks. The mean should be near 0.
6. StECL vertex,prim: x(ftpcW)-x(tpc) vs y(ftpcW)-y(tpc): Not filled in Run 10. Scatter plot of the differences in x-y position (cm) for primary vertex positions determined by FTPC West global tracks and main TPC glbtrks. Should scatter about (0,0).

1. StECL vertex,prim: z(ftpcW)-z(tpc): Not filled in Run 10. Distribution of the differences along the z-axis, i.e. beam direction, in cm for primary vertex positions determined by FTPC West global tracks and main TPC glbtrks. The mean should be near 0.
Fast Offline QA and DST Production QA Reference Histograms - Run 8
Run 8: d + Au
General Histograms -- Now Available!
Minbias/High-tower Histograms -- Now Available!
Detailed Sub-system References
General Histograms for Run 10
STAR Offline QA Shift Histogram Description - Run 10
Note: Not all reference plots may be ideal, be sure to carefully read the descriptions.
This page contains the reference histograms and descriptions for the Offline QA system for Run 10. These pages should correspond exactly to the jobs viewed in the Offline QA Browser. However, STAR is a dynamic experiment and the plots generated for QA will change several times throughout the run. If this reference page seems out-of-date, or if you find a job that would make a better reference, please email the QA hypernews list here.
Other links:
Elizabeth W. Oldag for the QA Team.
January 25, 2010.
Page Index for QA Shift Plots
- Page 1

1. StE trigger word: Distribution of trigger word groups: 1 = minimum bias, 2 = central, 3 = high pt, 4 = Jet patch, 5 = high BEMC tower, 6 = other.
2. StE trigger bits: Frequency of usages of 32 trigger bits.
3. FTPC West chargestep: The real chargestep corresponds to the maximum drift time in FTPC West (clusters from inner radius electrode) and is located near 170 timebins. This position will change slightly with atmospheric pressure. The hits beyond the step at timebin 170 are due to electronic noise and pileup. This step should always be visible even if it is only a "blip". Not filled in this run.
4. FTPC East chargestep: The real chargestep corresponds to the maximum drift time in FTPC East (clusters from inner radius electrode) and is located near 170 timebins. This position will change slightly with atmospheric pressure. The hits beyond the step at timebin 170 are due to electronic noise and pileup. This step should always be visible even if it is only a "blip". Not filled in this run.
5. FTPCW cluster radial position: Radial positions of clusters. Not filled in this run.
6. FTPCE cluster radial position: Radial positions of clusters. Not filled in this run.
HT Histograms for Run 10
STAR Offline QA Shift Histogram Description - Run 10
Note: Not all reference plots may be ideal, be sure to carefully read the descriptions.
This page contains the reference histograms and descriptions for the Offline QA system for Run 10. These pages should correspond exactly to the jobs viewed in the Offline QA Browser. However, STAR is a dynamic experiment and the plots generated for QA will change several times throughout the run. If this reference page seems out-of-date, or if you find a job that would make a better reference, please email the QA hypernews list here.
Other links:
Elizabeth W. Oldag for the QA Team.
January 25, 2010.
Page Index for QA Shift Plots
- Page 1
- Page 2
- Page 3
- Page 4
- Page 5
- Page 5
- Page 6
- Page 7
- Page 8
- Page 9
- Page 10
- Page 11
- Page 12
- Page 13

1. StEHT event primary vertex check: Primary vertex finding status for run; events with (1) and without (-1) final vertex. The relative fraction of events with primary vertex depends on trigger, beam diamond width and position.
2. StEHT point: # hits tpc : Distribution of number of reconstructed space points in TPC per event. Should scale with centrality, depends on multiplicity cut and trigger. For high tower triggers this distribution extends to larger hit multiplicities.
3. StEHT point: # hits ftpc: Not filled in this run. Distribution of number of reconstructed space points in FTPC East (solid line) and West (dashed line) per event. Scales with centrality, depends on multiplicity cut and trigger.
4. StEHT point: x-y distribution of hits, tpcE: Scatter plot of the azimuthal distribution of reconstructed space points in the East TPC. The distribution should be azimuthally uniform except for the 12 sector structure of the TPC (lighter areas indicate sector boundaries). Density should decrease radially but inner and outer sector structure should be present (darker areas in the innermost pads of the inner and outer sectors). Watch for empty areas (typically masked RDOs) and hot spots. Notify TPC experts if new empty area or hot spot appears.
5. StEHT point: x-y distribution of hits, tpcW: Scatter plot of the azimuthal distribution of reconstructed space points in the West TPC. The distribution should be azimuthally uniform except for the 12 sector structure of the TPC (lighter areas indicate sector boundaries). Density should decrease radially but inner and outer sector structure should be present (darker areas in the innermost pads of the inner and outer sectors). Watch for empty areas (typically masked RDOs) and hot spots. Notify TPC experts if new empty area or hot spot appears.
6. StEHT point: r-phi distribution of hits, tpcE: Same as the x-y scatter plot except in polar coordinates.

1. StEHT point: r-phi distribution of hits, tpcW: Same as the x-y scatter plot except in polar coordinates.
2. StEHT point: z distribution of hits, tpc: Distribution of reconstructed space points in TPC with respect to z-coordinate. There is a broad peak above the nominally flat background at z=0. This is intentional and is done in order to allow identification of post-trigger pileup events. Watch out for any other anamolous steps or unusual spikes or dips. The peaks just outside |z| = 200 cm are new in Run 10.
3. StEHT point: #phi distribution of hits, tpc: Distribution of reconstructed space points in TPC with respect to azimuthal coordinate (phi) for east (solid line) and west (dashed line) halves. Should be flat except for the 12-fold sector structure or masked RDOs (as shown). Dead RDO's will produce dips and gaps; hot pads or FEE cards will produce spikes.
4. StEHT point: padrow distribution of hits, tpc: Distribution of reconstructed space points in TPC with respect to padrow number 1-45. Should display gradual fall-off; watch for anamolous spikes and dips. Missing RDO's cause drops in the distribution. Padrow 13 was restored in Run 9 and continues to be active in Run 10.
5. StEHT point: x-y distribution of hits, ftpcE: Not filled in this run. Radial distribution of reconstructed space points in FTPC East. The distribution should be uniform except for the insensitive gaps between the six readout sectors. Localized denser areas are due to noise. Ideally noisy pads are flagged in the FTPC gain tables so that they are not used for cluster finding. Less densely populated areas not on the sector boundaries are due to dead electronics. Empty areas not on the sector boundaries indicates a serious hardware problem. An FTPC expert should be contacted immediately if this is seen in fast offline-QA during data taking.
6. StEHT point: x-y distribution of hits, ftpcW: Not filled in this run. Radial distribution of reconstructed space points in FTPC West. The distribution should be uniform except for the insensitive gaps between the six readout sectors. Localized denser areas are due to noise. Ideally noisy pads are flagged in the FTPC gain tables so that they are not used for cluster finding. Less densely populated areas not on the sector boundaries are due to dead electronics. Empty areas not on the sector boundaries indicates a serious hardware problem. An FTPC expert should be contacted immediately if this is seen in fast offline-QA during data taking.

1. StEHT point: plane distribution of hits, ftpc: Not filled in this run. Number of reconstructed space points assigned to tracks in FTPC East (solid line) and West (dashed line) in each padrow. The horizontal axis shows padrow numbers where FTPC-West is 1-10 and FTPC-East is 11-20. Padrows #1 and #11 are closest to the center of STAR. East and West should be similar in shape but West will have less magnitude than east for d+Au. Spikes indicate noisy electronics; dips indicate dead electronics.
2. StEHT point: #pads vs #timebins of hits, ftpcE: Not filled in this run. Monitors the cluster quality in FTPC East. Ideally the clusters should have a pad length of 3-5 and a timebin length of 4-6. A prominent peak located at (2,2) indicates bad gas or loss of gain or excessive background.
3. StEHT point: #pads vs #timebins of hits, ftpcW: Not filled in this run. Monitors the cluster quality in FTPC West. Ideally the clusters should have a pad length of 3-5 and a timebin length of 4-6. A prominent peak located at (2,2) indicates bad gas or loss of gain or excessive background.
4. StEHT Number hits in cluster for bemc: Distribution of number of BEMC towers contributing to energy clusters.
5. StEHT Energy of cluster for bemc: Distribution of energy in reconstructed clusters in EMC barrel. Should be peaked with a smooth fall off for minbias data but may display other peaks or structures for other triggers. For high tower triggers there may be excess counts in the large energy tails.
6. StEHT Eta of clusters for bemc: Azimuthally integrated pseudorapidity distribution of reconstructed energy clusters in the EMC-barrel. Note there will be gaps due to missing and/or uninstrumented sectors. Report any unexpected gaps or unusual spikes. For Run 10 the full barrel is instrumented. The distribution should nominally be flat.

1. StEHT Phi of clusters for bemc: Pseudorapidity integrated azimuthal distribution (radians) of reconstructed energy clusters in the EMC-barrel. Note there will be gaps due to missing and/or uninstrumented sectors. Report any unexpected gaps, unusual spikes, or sections of significantly elevated yields.
2. StEHT Number hits in cluster for bsmde: Distribution of numbers of hits (anodes) contributing to Barrel SMD clusters along pseudorapidity.
3. StEHT Eta of clusters for bsmde: Pseudorapidity distribution of reconstructed energy clusters in the BSMD anode grid along pseudorapidity. Note there will be gaps due to missing and/or uninstrumented sectors. Report any unexpected gaps or unusual spikes. Distribution should nominally be flat.
4. StEHT Number hits in cluster for bsmdp: Distribution of numbers of hits (anodes) contributing to Barrel SMD clusters along azimuth.
5. StEHT Phi of clusters for bsmdp: Azimuthal distribution of reconstructed energy clusters in the BSMD anode grid along azimuth angle (phi in radians). Note there will be gaps due to missing and/or uninstrumented sectors. Report any unexpected gaps or unusual spikes.
6. StEHT EmcCat4 Point Energy: Energy distribution for Barrel EMC-SMD Category 4 clusters. Cat4 clusters correspond to TPC track matched clusters in the EMC barrel, BSMD-eta and BSMD-phi detectors.

1. StEHT EmcCat4 Point Eta: Pseudorapidity distribution for EMC-SMD Category 4 clusters. Distribution should nominally be flat.
2. StEHT EmcCat4 Point Phi: Azimuthal distribution for EMC-SMD Category 4 clusters. Distribution should nominally be flat.
3. StEHT EmcCat4 Sigma Eta: Distribution of widths (sigma) of Category 4 Barrel EMC-SMD clusters with respect to pseudorapidity.
4. StEHT EmcCat4 Sigma Phi: Distribution of widths (sigma) of Category 4 Barrel EMC-SMD clusters with respect to azimuthal angle.
5. StEHT EmcCat4 Delta Eta: Differences between centroids of Category 4 Barrel EMC-SMD clusters and projected positions of TPC tracks at BEMC with respect to pseudorapidity. Should be peaked at ~0. Not filled in Run 10.
6. StEHT EmcCat4 Delta Phi: Differences between centroids of Category 4 Barrel EMC-SMD clusters and projected positions of TPC tracks at BEMC with respect to azimuthal angle. Should be peaked at ~0. Not filled in Run 10.

1. StEHT EmcCat4 Points Multiplicity: Frequency distribution of number of Category 4 clusters per event. For high tower triggers this distribution extends to larger multiplicities.
2. StEHT EmcCat4 Track Momenta : Distribution of TPC global track momentum for Barrel EMC-SMD Category 4 clusters. Not filled in Run 10.
3. StEHT Point Flag: Distribution of Barrel EMC and SMD cluster types by Category number. There should be a reasonable fraction of Cat4 clusters as in this example histogram; report if this fraction drops significantly. For high tower triggers the relative fraction of Cat4 clusters should be larger than in MinBias.
4. StEHT globtrk: iflag - all : Quality flag values for all global tracks. Some with large, negative values may not appear on plot; check stat. box for underflows. Majority of tracks should have iflag>0, corresponding to good, usable tracks. Refer to: dst_track_flags.html and kalerr.html for description of flag values. Note that in Runs 7-10 about half the tracks have iflag < 0.
5. StEHT globtrk: tot good tracks - all: Distribution of the number of good global tracks in the TPC per trigger; including pileup. For high tower triggers this distribution extends to larger track multiplicities.
6. StEHT globtrk: tot good tracks - ftpc: Not filled in this run. Scatter plot of good global track multiplicities in FTPC West versus FTPC East.

1. StEHT globtrk: Detector ID good tracks - all: Global track detector IDs for good tracks. Refer to: /afs/rhic/star/packages/DEV00/pams/global/inc/StDetectorDefinitions.h for Detector ID codes.
2. StEHT globtrk: z-DCA to Beam Axis, coarse scale: Coarse scale distribution along the z-axis (from -200 to +200 cm) of the DCA points to the nominal beam line (z-axis, x=y=0) for all TPC global tracks. Peaks indicate probable locations of individual collision vertices however indentification of individual collision vertices is unlikely.
3. StEHT globtrk: z-DCA to Beam Axis: Fine scale distribution along the z-axis (from -50 to +50 cm) of the DCA points to the nominal beam line (z-axis, x=y=0) for all TPC global tracks. Peaks indicate probable locations of individual collision vertices.
4. StEHT globtrk: z-DCA to Beam Axis vs tanl, tpc: Scatter plot of the tangent of the dip angle (tanl) versus the z-coordinate (from -25 to 25 cm) of the DCA points to the nominal beam line (z-axis, x=y=0) for all TPC global tracks. Vertical bands should be seen corresponding to individual events. The bands should be smooth and continuous; breaks at tanl=0 indicate probable TPC calibration errors in either the t0 offset or the drift speed. This is best seen for high multiplicity events. Cross reference for calibration errors with z-DCA to beam axis versus z-coord. of first hit on track.
5. StEHT globtrk: z-DCA to Beam Axis vs z-first: Scatter plot of the z-coordinate of the first fitted hit in the TPC versus the z-coordinate (from -25 to 25 cm) of the DCA points to the nominal beam line (z-axis, x=y=0) for all TPC-only global in which the first point used in the fit lies in the TPC. Vertical bands should be seen corresponding to individual events. The bands should be smooth and continuous; breaks at z=0 indicate TPC calibration errors in either the t0 offset or the drift speed. This is best seen for high multiplicity events.
6. StEHT globtrk: z-DCA to Beam Axis vs psi: Scatter plot of the azimuthal direction angle (psi) versus the z-coordinate (from -25 to 25 cm) of the DCA points to the nominal beam line (z-axis, x=y=0) for all TPC global tracks. Vertical bands should be seen corresponding to individual events. The bands should be smooth, straight and continuous indicating azimuthal symmetry in the tracking. Bends or offsets could indicate problems in individual TPC sectors such as voltage sags or drifts. These are best studied with high multiplicity events.

1. StEHT globtrk: padrow of first hit on trk, tpc: Distribution of first fitted space point with respect to pad row number for TPC-only global tracks. Should peak at 1 with a minor peak at padrow 14 (beginning of outer sector); the latter should not be too big relative to that at row 1. Other peaks may indicate large, missing sections of the TPC read-out causing breaks, and consequently additional, false new starting points for tracks. The excess data for TPC west beyond padrow 35 is due to EEMC tracking needs.
2. StEHT globtrk: z of first hit on trk, tpc: Distribution of first fitted space point with respect to z for TPC-only global tracks. Should be approx. symmetric.
3. StEHT globtrk: first point: hit - helix, tpc: Residuals at FIRST point on track for TPC-only global tracks. The quantities plotted are the longitudinal (along z-axis, dashed line) and transverse (in x-y plane, solid line) differences between the coordinates of the first hit and the DCA point on the helix fit to the first point. For the transverse residual, positive (negative) values correspond to hits inside (outside) the circular projection of the helix onto the bend plane. FWHM should be less than ~ 1cm.
4. StEHT globtrk: phi of first point on trk, tpc: Distribution of first fitted space point with respect to azimuthal angle (phi) for TPC-only global tracks. The solid (dashed) line is for the east (west) half of the TPC. These should be approximately equal and flat within statistics, except for the 12-sector structure.
5. StEHT globtrk: chisq0, tpc: Chi-square per degree of freedom for TPC global tracks. Should peak just below 1.
6. StEHT globtrk: signed impact param from prim vtx, tpc: Two-dimensional (2D) (in the transverse plane) signed impact parameter (in cm) from primary vertex for East (solid line), West (dashed line) and All (dotted line) TPC-only global tracks. Should be centered at zero depending on the TPC calibration status used in fast-offline QA production.

1. StEHT globtrk: tanl(dip) vs. (zfirst-zvtx)/arc length, tpc,tpc+svt: Scatter plot of tangent of dip angle (tanl) versus (z_first - z_primvrtx)/arc-length for TPC-only global tracks whose first fitted point is in the TPC. Variable 'z_first' is the z coordinate of the first fitted point in the TPC. Variable 'z_primvrtx' is the z-coordinate of the primary vertex for the event. Variable 'arc-length' is 2R*arcsin(delta_r/2R) where R = track radius of curvature and delta_r is the transverse distance between the primary vertex and the first hit on track. Primary tracks lie along the 45 deg diagonal. Secondary tracks and strays lie scattered to either side. The diagonal band should appear clearly and be straight and smooth without kinks, breaks or bends.
2. StEHT globtrk: N points on trk,ftpc: Not filled in Run 10. Distribution of the number of fitted points on track for FTPC-East (solid line) and FTPC-West (dashed line) global tracks. Distributions should be similar except fewer tracks for west than east. Also depends on the relative fraction of active readout in each detector.
3. StEHT globtrk: psi, ftpc: Not filled in Run 10. Azimuthal distributions for track direction angle (psi) for FTPC-East (solid line) and FTPC-West (dashed line) global tracks. These should be flat within statistics except for the hexagonal FTPC sector structure. There will be fewer west tracks than east for d+Au.
4. StEHT globtrk: |eta|, ftpc: Not filled in Run 10. Distributions of absolute value of pseudorapidity for FTPC-East (solid line) and FTPC-West (dashed line) global tracks. These should be similar (modulo for d+Au) and range from about 2.5 to 4.5.
5. StEHT globtrk: pT, ftpc: Not filled in Run 10. Transverse momentum (GeV/c) distributions for FTPC-East (solid line) and FTPC-West (dashed line) global tracks. These should be similar (modulo d+Au)within statistics.
6. StEHT globtrk: momentum, ftpc: Not filled in Run 10. Total momentum (GeV/c) distributions for FTPC-East (solid line) and FTPC-West (dashed line) global tracks. These should be similar (modulo d+Au) within statistics.

1. StEHT globtrk: impact param from prim vtx, ftpc: Not filled in Run 10. Distribution of impact parameter values for global FTPC East tracks (solid curve) and West tracks (dashed curve) with respect to the main TPC global track determined primary vertex.
2. StEHT globtrk: Y vs X of first hit on trk, ftpcE: Not filled in Run 10. Scatter plot of (x,y) coordinates for the first fitted space points in FTPC-East global tracks. These should be uniformly populated with hits; FTPC hexagonal structure is apparent.
3. StEHT globtrk: Y vs X of first hit on trk, ftpcW: Not filled in Run 10. Scatter plot of (x,y) coordinates for the first fitted space points in FTPC-West global tracks. These should be uniformly populated with hits; FTPC hexagonal structure is apparent.
4. StEHT primtrk: iflag - all: Quality flag values for all primary tracks. Some with large, negative values may not appear on plot; check stat. box for underflows. Majority of tracks should have iflag>0, corresponding to good, usable tracks. Refer to: dst_track_flags.html and kalerr.html for description of flag values.
5. StEHT primtrk: tot num tracks iflag>0: Distribution of total number of primary tracks per triggered event. For high tower triggers this distribution extends to larger track multiplicities.
6. StEHT primtrk: ratio primary/global tracks w/ iflag>0: Ratio of good primary to good global tracks for all detectors. For Au-Au this ratio usually peaks at about 0.5.

1. StEHT primtrk:, ftpc: Not filled in Run 10. Transverse momentum (GeV/c) distributions for FTPC-East (solid line) and FTPC-West (dashed line) primary tracks. These should be similar within statistics.
2. StEHT primtrk: ||, ftpc: Not filled in Run 10. Distributions of absolute value of mean pseudorapidity for FTPC-East (solid line) and FTPC-West (dashed line) primary tracks. These should be similar within statistics and range from about 2.5 to 3.5.
3. StEHT primtrk: first point: hit - helix (r,z), tpc: Residuals at first point on track for TPC-only primary tracks. The quantities plotted are the longitudinal (along z-axis, dashed line) and transverse (in x-y plane, solid line) differences between the coordinates of the first hit and the DCA point on the helix fit to the first point. For the transverse residual, positive (negative) values correspond to hits inside (outside) the circular projection of the helix onto the bend plane. FWHM should be less than ~ 1cm.
4. StEHT primtrk: |eta|, ftpc: Not filled in Run 10. Distributions of absolute value of mean pseudorapidity for FTPC-East (solid line) and FTPC-West (dashed line) primary tracks. These should be similar within statistics and range from about 2.5 to 3.5.
5. StEHT primtrk: pT, ftpc: Not filled in Run 10. Transverse momentum (GeV/c) distributions for FTPC-East (solid line) and FTPC-West (dashed line) primary tracks. These should be similar within statistics.
6. StEHT dedx: ratiomean to Bethe Bloch Distribution of ratio of mean dE/dx to Bethe-Bloch dE/dx for pions at the same momentum for TPC-only global tracks. Should peak at ~1. Tests calibration of charge deposition in TPC gas., tpc,tpc+svt:

1. StEHT PID: globtrk-dst_dedx, p vs dedx (reconstructed): Scatter plot of truncated mean dE/dx versus total momentum (GeV/c) for TPC-only global tracks. Should be able to see Bethe-Bloch bands for pions, kaons and protons if statistics are sufficient.
2. StEHT vertex,prim: z : Distribution of primary vertex position along the z-axis out to abs(z) < 50 cm.
3. StEHT vertex,prim: x versus y: Scatter plot of the (x,y) coordinates of the primary vertex position. This should correspond to the determined beam transverse position. The amount of dispersion will depend on the trigger condition and multiplicity cuts.
4. StEHT vertex,prim: x(ftpcE)-x(tpc) vs y(ftpcE)-y(tpc): Not filled in Run 10. Scatter plot of the differences in x-y position (cm) for primary vertex positions determined by FTPC East global tracks and main TPC glbtrks. Should scatter about (0,0).
5. StEHT vertex,prim: z(ftpcE)-z(tpc): Not filled in Run 10. Distribution of the differences along the z-axis, i.e. beam direction, in cm for primary vertex positions determined by FTPC East global tracks and main TPC glbtrks. The mean should be near 0.
6. StEHT vertex,prim: x(ftpcW)-x(tpc) vs y(ftpcW)-y(tpc): Not filled in Run 10. Scatter plot of the differences in x-y position (cm) for primary vertex positions determined by FTPC West global tracks and main TPC glbtrks. Should scatter about (0,0).

1. StEHT vertex,prim: z(ftpcW)-z(tpc): Not filled in Run 10. Distribution of the differences along the z-axis, i.e. beam direction, in cm for primary vertex positions determined by FTPC West global tracks and main TPC glbtrks. The mean should be near 0.
MB Histograms for Run 10
STAR Offline QA Shift Histogram Description - Run 10
Note: Not all reference plots may be ideal, be sure to carefully read the descriptions.
This page contains the reference histograms and descriptions for the Offline QA system for Run 10. These pages should correspond exactly to the jobs viewed in the Offline QA Browser. However, STAR is a dynamic experiment and the plots generated for QA will change several times throughout the run. If this reference page seems out-of-date, or if you find a job that would make a better reference, please email the QA hypernews list here.
Other links:
Elizabeth W. Oldag for the QA Team.
January 25, 2010.
Page Index for QA Shift Plots
- Page 1
- Page 2
- Page 3
- Page 4
- Page 5
- Page 6
- Page 7
- Page 8
- Page 9
- Page 10
- Page 11
- Page 12
- Page 13

1. StEMB event primary vertex check: Primary vertex finding status for run; events with (1) and without (-1) final vertex. The relative fraction of events with primary vertex depends on trigger, beam diamond width and position.
2. StEMB point: # hits tpc : Distribution of number of reconstructed space points in TPC per event. Should scale with centrality, depends on multiplicity cut and trigger.
3. StEMB point: # hits ftpc: Not filled in this run. Distribution of number of reconstructed space points in FTPC East (solid line) and West (dashed line) per event. Scales with centrality, depends on multiplicity cut and trigger.
4. StEMB point: x-y distribution of hits, tpcE: Scatter plot of the azimuthal distribution of reconstructed space points in the East TPC. The distribution should be azimuthally uniform except for the 12 sector structure of the TPC (lighter areas indicate sector boundaries). Density should decrease radially but inner and outer sector structure should be present (darker areas in the innermost pads of the inner and outer sectors). Watch for empty areas (typically masked RDOs) and hot spots. Notify TPC experts if new empty area or hot spot appears.
5. StEMB point: x-y distribution of hits, tpcW: Scatter plot of the azimuthal distribution of reconstructed space points in the West TPC. The distribution should be azimuthally uniform except for the 12 sector structure of the TPC (lighter areas indicate sector boundaries). Density should decrease radially but inner and outer sector structure should be present (darker areas in the innermost pads of the inner and outer sectors). Watch for empty areas (typically masked RDOs) and hot spots. Notify TPC experts if new empty area or hot spot appears.
6. StEMB point: r-phi distribution of hits, tpcE: Same as the x-y scatter plot except in polar coordinates.

1. StEMB point: r-phi distribution of hits, tpcW: Same as the x-y scatter plot except in polar coordinates.
2. StEMB point: z distribution of hits, tpc: Distribution of reconstructed space points in TPC with respect to z-coordinate. There is a broad peak above the nominally flat background at z=0. This is intentional and is done in order to allow identification of post-trigger pileup events. Watch out for any other anamolous steps or unusual spikes or dips. The peaks just outside |z| = 200 cm are new in Run 10.
3. StEMB point: #phi distribution of hits, tpc: Distribution of reconstructed space points in TPC with respect to azimuthal coordinate (phi) for east (solid line) and west (dashed line) halves. Should be flat except for the 12-fold sector structure or masked RDOs (as shown). Dead RDO's will produce dips and gaps; hot pads or FEE cards will produce spikes.
4. StEMB point: padrow distribution of hits, tpc: Distribution of reconstructed space points in TPC with respect to padrow number 1-45. Should display gradual fall-off; watch for anamolous spikes and dips. Missing RDO's cause drops in the distribution. Padrow 13 was restored in Run 9 and continues to be active in Run 10.
5. StEMB point: x-y distribution of hits, ftpcE: Not filled in this run. Radial distribution of reconstructed space points in FTPC East. The distribution should be uniform except for the insensitive gaps between the six readout sectors. Localized denser areas are due to noise. Ideally noisy pads are flagged in the FTPC gain tables so that they are not used for cluster finding. Less densely populated areas not on the sector boundaries are due to dead electronics. Empty areas not on the sector boundaries indicates a serious hardware problem. An FTPC expert should be contacted immediately if this is seen in fast offline-QA during data taking.
6. StEMB point: x-y distribution of hits, ftpcW: Not filled in this run. Radial distribution of reconstructed space points in FTPC West. The distribution should be uniform except for the insensitive gaps between the six readout sectors. Localized denser areas are due to noise. Ideally noisy pads are flagged in the FTPC gain tables so that they are not used for cluster finding. Less densely populated areas not on the sector boundaries are due to dead electronics. Empty areas not on the sector boundaries indicates a serious hardware problem. An FTPC expert should be contacted immediately if this is seen in fast offline-QA during data taking.

1. StEMB point: plane distribution of hits, ftpc: Not filled in this run. Number of reconstructed space points assigned to tracks in FTPC East (solid line) and West (dashed line) in each padrow. The horizontal axis shows padrow numbers where FTPC-West is 1-10 and FTPC-East is 11-20. Padrows #1 and #11 are closest to the center of STAR. East and West should be similar in shape but West will have less magnitude than east for d+Au. Spikes indicate noisy electronics; dips indicate dead electronics.
2. StEMB point: #pads vs #timebins of hits, ftpcE: Not filled in this run. Monitors the cluster quality in FTPC East. Ideally the clusters should have a pad length of 3-5 and a timebin length of 4-6. A prominent peak located at (2,2) indicates bad gas or loss of gain or excessive background.
3. StEMB point: #pads vs #timebins of hits, ftpcW: Not filled in this run. Monitors the cluster quality in FTPC West. Ideally the clusters should have a pad length of 3-5 and a timebin length of 4-6. A prominent peak located at (2,2) indicates bad gas or loss of gain or excessive background.
4. StEMB Number hits in cluster for bemc: Distribution of number of BEMC towers contributing to energy clusters.
5. StEMB Energy of cluster for bemc: Distribution of energy in reconstructed clusters in EMC barrel. Should be peaked with a smooth fall off for minbias data but may display other peaks or structures for other triggers.
6. StEMB Eta of clusters for bemc: Azimuthally integrated pseudorapidity distribution of reconstructed energy clusters in the EMC-barrel. Note there will be gaps due to missing and/or uninstrumented sectors. Report any unexpected gaps or unusual spikes. For Run 10 the full barrel is instrumented. The distribution should nominally be flat.

1. StEMB Phi of clusters for bemc: Pseudorapidity integrated azimuthal distribution (radians) of reconstructed energy clusters in the EMC-barrel. Note there will be gaps due to missing and/or uninstrumented sectors. Report any unexpected gaps, unusual spikes, or sections of significantly elevated yields.
2. StEMB Number hits in cluster for bsmde: Distribution of numbers of hits (anodes) contributing to Barrel SMD clusters along pseudorapidity.
3. StEMB Eta of clusters for bsmde: Pseudorapidity distribution of reconstructed energy clusters in the BSMD anode grid along pseudorapidity. Note there will be gaps due to missing and/or uninstrumented sectors. Report any unexpected gaps or unusual spikes. Distribution should nominally be flat.
4. StEMB Number hits in cluster for bsmdp: Distribution of numbers of hits (anodes) contributing to Barrel SMD clusters along azimuth.
5. StEMB Phi of clusters for bsmdp: Azimuthal distribution of reconstructed energy clusters in the BSMD anode grid along azimuth angle (phi in radians). Note there will be gaps due to missing and/or uninstrumented sectors. Report any unexpected gaps or unusual spikes.
6. StEMB EmcCat4 Point Energy: Energy distribution for Barrel EMC-SMD Category 4 clusters. Cat4 clusters correspond to TPC track matched clusters in the EMC barrel, BSMD-eta and BSMD-phi detectors.

1. StEMB EmcCat4 Point Eta: Pseudorapidity distribution for EMC-SMD Category 4 clusters. Distribution should nominally be flat.
2. StEMB EmcCat4 Point Phi: Azimuthal distribution for EMC-SMD Category 4 clusters. Distribution should nominally be flat.
3. StEMB EmcCat4 Sigma Eta: Distribution of widths (sigma) of Category 4 Barrel EMC-SMD clusters with respect to pseudorapidity.
4. StEMB EmcCat4 Sigma Phi: Distribution of widths (sigma) of Category 4 Barrel EMC-SMD clusters with respect to azimuthal angle.
5. StEMB EmcCat4 Delta Eta: Differences between centroids of Category 4 Barrel EMC-SMD clusters and projected positions of TPC tracks at BEMC with respect to pseudorapidity. Should be peaked at ~0. Not filled in Run 10.
6. StEMB EmcCat4 Delta Phi: Differences between centroids of Category 4 Barrel EMC-SMD clusters and projected positions of TPC tracks at BEMC with respect to azimuthal angle. Should be peaked at ~0. Not filled in Run 10.

1. StEMB EmcCat4 Points Multiplicity: Frequency distribution of number of Category 4 clusters per event.
2. StEMB EmcCat4 Track Momenta : Distribution of TPC global track momentum for Barrel EMC-SMD Category 4 clusters. Not filled in Run 10.
3. StEMB Point Flag: Distribution of Barrel EMC and SMD cluster types by Category number. There should be a reasonable fraction of Cat4 clusters as in this example histogram; report if this fraction drops significantly.
4. StEMB globtrk: iflag - all : Quality flag values for all global tracks. Some with large, negative values may not appear on plot; check stat. box for underflows. Majority of tracks should have iflag>0, corresponding to good, usable tracks. Refer to: dst_track_flags.html and kalerr.html for description of flag values. Note that in Runs 7-10 about half the tracks have iflag < 0.
5. StEMB globtrk: tot good tracks - all: Distribution of the number of good global tracks in the TPC per trigger; including pileup.
6. StEMB globtrk: tot good tracks - ftpc: Not filled in this run. Scatter plot of good global track multiplicities in FTPC West versus FTPC East.

1. StEMB globtrk: Detector ID good tracks - all: Global track detector IDs for good tracks. Refer to: /afs/rhic/star/packages/DEV00/pams/global/inc/StDetectorDefinitions.h for Detector ID codes.
2. StEMB globtrk: z-DCA to Beam Axis, coarse scale: Coarse scale distribution along the z-axis (from -200 to +200 cm) of the DCA points to the nominal beam line (z-axis, x=y=0) for all TPC global tracks. Peaks indicate probable locations of individual collision vertices however indentification of individual collision vertices is unlikely.
3. StEMB globtrk: z-DCA to Beam Axis: Fine scale distribution along the z-axis (from -50 to +50 cm) of the DCA points to the nominal beam line (z-axis, x=y=0) for all TPC global tracks. Peaks indicate probable locations of individual collision vertices.
4. StEMB globtrk: z-DCA to Beam Axis vs tanl, tpc: Scatter plot of the tangent of the dip angle (tanl) versus the z-coordinate (from -25 to 25 cm) of the DCA points to the nominal beam line (z-axis, x=y=0) for all TPC global tracks. Vertical bands should be seen corresponding to individual events. The bands should be smooth and continuous; breaks at tanl=0 indicate probable TPC calibration errors in either the t0 offset or the drift speed. This is best seen for high multiplicity events. Cross reference for calibration errors with z-DCA to beam axis versus z-coord. of first hit on track.
5. StEMB globtrk: z-DCA to Beam Axis vs z-first: Scatter plot of the z-coordinate of the first fitted hit in the TPC versus the z-coordinate (from -25 to 25 cm) of the DCA points to the nominal beam line (z-axis, x=y=0) for all TPC-only global in which the first point used in the fit lies in the TPC. Vertical bands should be seen corresponding to individual events. The bands should be smooth and continuous; breaks at z=0 indicate TPC calibration errors in either the t0 offset or the drift speed. This is best seen for high multiplicity events.
6. StEMB globtrk: z-DCA to Beam Axis vs psi: Scatter plot of the azimuthal direction angle (psi) versus the z-coordinate (from -25 to 25 cm) of the DCA points to the nominal beam line (z-axis, x=y=0) for all TPC global tracks. Vertical bands should be seen corresponding to individual events. The bands should be smooth, straight and continuous indicating azimuthal symmetry in the tracking. Bends or offsets could indicate problems in individual TPC sectors such as voltage sags or drifts. These are best studied with high multiplicity events.

1. StEMB globtrk: padrow of first hit on trk, tpc: Distribution of first fitted space point with respect to pad row number for TPC-only global tracks. Should peak at 1 with a minor peak at padrow 14 (beginning of outer sector); the latter should not be too big relative to that at row 1. Other peaks may indicate large, missing sections of the TPC read-out causing breaks, and consequently additional, false new starting points for tracks. The excess data for TPC west beyond padrow 35 is due to EEMC tracking needs.
2. StEMB globtrk: z of first hit on trk, tpc: Distribution of first fitted space point with respect to z for TPC-only global tracks. Should be approx. symmetric.
3. StEMB globtrk: first point: hit - helix, tpc: Residuals at FIRST point on track for TPC-only global tracks. The quantities plotted are the longitudinal (along z-axis, dashed line) and transverse (in x-y plane, solid line) differences between the coordinates of the first hit and the DCA point on the helix fit to the first point. For the transverse residual, positive (negative) values correspond to hits inside (outside) the circular projection of the helix onto the bend plane. FWHM should be less than ~ 1cm.
4. StEMB globtrk: phi of first point on trk, tpc: Distribution of first fitted space point with respect to azimuthal angle (phi) for TPC-only global tracks. The solid (dashed) line is for the east (west) half of the TPC. These should be approximately equal and flat within statistics, except for the 12-sector structure.
5. StEMB globtrk: chisq0, tpc: Chi-square per degree of freedom for TPC global tracks. Should peak just below 1.
6. StEMB globtrk: signed impact param from prim vtx, tpc: Two-dimensional (2D) (in the transverse plane) signed impact parameter (in cm) from primary vertex for East (solid line), West (dashed line) and All (dotted line) TPC-only global tracks. Should be centered at zero depending on the TPC calibration status used in fast-offline QA production.

1. StEMB globtrk: tanl(dip) vs. (zfirst-zvtx)/arc length, tpc,tpc+svt: Scatter plot of tangent of dip angle (tanl) versus (z_first - z_primvrtx)/arc-length for TPC-only global tracks whose first fitted point is in the TPC. Variable 'z_first' is the z coordinate of the first fitted point in the TPC. Variable 'z_primvrtx' is the z-coordinate of the primary vertex for the event. Variable 'arc-length' is 2R*arcsin(delta_r/2R) where R = track radius of curvature and delta_r is the transverse distance between the primary vertex and the first hit on track. Primary tracks lie along the 45 deg diagonal. Secondary tracks and strays lie scattered to either side. The diagonal band should appear clearly and be straight and smooth without kinks, breaks or bends.
2. StEMB globtrk: N points on trk,ftpc: Not filled in Run 10. Distribution of the number of fitted points on track for FTPC-East (solid line) and FTPC-West (dashed line) global tracks. Distributions should be similar except fewer tracks for west than east. Also depends on the relative fraction of active readout in each detector.
3. StEMB globtrk: psi, ftpc: Not filled in Run 10. Azimuthal distributions for track direction angle (psi) for FTPC-East (solid line) and FTPC-West (dashed line) global tracks. These should be flat within statistics except for the hexagonal FTPC sector structure. There will be fewer west tracks than east for d+Au.
4. StEMB globtrk: |eta|, ftpc: Not filled in Run 10. Distributions of absolute value of pseudorapidity for FTPC-East (solid line) and FTPC-West (dashed line) global tracks. These should be similar (modulo for d+Au) and range from about 2.5 to 4.5.
5. StEMB globtrk: pT, ftpc: Not filled in Run 10. Transverse momentum (GeV/c) distributions for FTPC-East (solid line) and FTPC-West (dashed line) global tracks. These should be similar (modulo d+Au)within statistics.
6. StEMB globtrk: momentum, ftpc: Not filled in Run 10. Total momentum (GeV/c) distributions for FTPC-East (solid line) and FTPC-West (dashed line) global tracks. These should be similar (modulo d+Au) within statistics.

1. StEMB globtrk: impact param from prim vtx, ftpc: Not filled in Run 10. Distribution of impact parameter values for global FTPC East tracks (solid curve) and West tracks (dashed curve) with respect to the main TPC global track determined primary vertex.
2. StEMB globtrk: Y vs X of first hit on trk, ftpcE: Not filled in Run 10. Scatter plot of (x,y) coordinates for the first fitted space points in FTPC-East global tracks. These should be uniformly populated with hits; FTPC hexagonal structure is apparent.
3. StEMB globtrk: Y vs X of first hit on trk, ftpcW: Not filled in Run 10. Scatter plot of (x,y) coordinates for the first fitted space points in FTPC-West global tracks. These should be uniformly populated with hits; FTPC hexagonal structure is apparent.
4. StEMB primtrk: iflag - all: Quality flag values for all primary tracks. Some with large, negative values may not appear on plot; check stat. box for underflows. Majority of tracks should have iflag>0, corresponding to good, usable tracks. Refer to: dst_track_flags.html and kalerr.html for description of flag values.
5. StEMB primtrk: tot num tracks iflag>0: Distribution of total number of primary tracks per triggered event.
6. StEMB primtrk: ratio primary/global tracks w/ iflag>0: Ratio of good primary to good global tracks for all detectors. For Au-Au this ratio usually peaks at about 0.5.

1. StEMB primtrk:, ftpc: Not filled in Run 10. Transverse momentum (GeV/c) distributions for FTPC-East (solid line) and FTPC-West (dashed line) primary tracks. These should be similar within statistics.
2. StEMB primtrk: ||, ftpc: Not filled in Run 10. Distributions of absolute value of mean pseudorapidity for FTPC-East (solid line) and FTPC-West (dashed line) primary tracks. These should be similar within statistics and range from about 2.5 to 3.5.
3. StEMB primtrk: first point: hit - helix (r,z), tpc: Residuals at first point on track for TPC-only primary tracks. The quantities plotted are the longitudinal (along z-axis, dashed line) and transverse (in x-y plane, solid line) differences between the coordinates of the first hit and the DCA point on the helix fit to the first point. For the transverse residual, positive (negative) values correspond to hits inside (outside) the circular projection of the helix onto the bend plane. FWHM should be less than ~ 1cm.
4. StEMB primtrk: |eta|, ftpc: Not filled in Run 10. Distributions of absolute value of mean pseudorapidity for FTPC-East (solid line) and FTPC-West (dashed line) primary tracks. These should be similar within statistics and range from about 2.5 to 3.5.
5. StEMB primtrk: pT, ftpc: Not filled in Run 10. Transverse momentum (GeV/c) distributions for FTPC-East (solid line) and FTPC-West (dashed line) primary tracks. These should be similar within statistics.
6. StEMB dedx: ratiomean to Bethe Bloch Distribution of ratio of mean dE/dx to Bethe-Bloch dE/dx for pions at the same momentum for TPC-only global tracks. Should peak at ~1. Tests calibration of charge deposition in TPC gas., tpc,tpc+svt:

1. StEMB PID: globtrk-dst_dedx, p vs dedx (reconstructed): Scatter plot of truncated mean dE/dx versus total momentum (GeV/c) for TPC-only global tracks. Should be able to see Bethe-Bloch bands for pions, kaons and protons if statistics are sufficient.
2. StEMB vertex,prim: z : Distribution of primary vertex position along the z-axis out to abs(z) < 50 cm.
3. StEMB vertex,prim: x versus y: Scatter plot of the (x,y) coordinates of the primary vertex position. This should correspond to the determined beam transverse position. The amount of dispersion will depend on the trigger condition and multiplicity cuts.
4. StEMB vertex,prim: x(ftpcE)-x(tpc) vs y(ftpcE)-y(tpc): Not filled in Run 10. Scatter plot of the differences in x-y position (cm) for primary vertex positions determined by FTPC East global tracks and main TPC glbtrks. Should scatter about (0,0).
5. StEMB vertex,prim: z(ftpcE)-z(tpc): Not filled in Run 10. Distribution of the differences along the z-axis, i.e. beam direction, in cm for primary vertex positions determined by FTPC East global tracks and main TPC glbtrks. The mean should be near 0.
6. StEMB vertex,prim: x(ftpcW)-x(tpc) vs y(ftpcW)-y(tpc): Not filled in Run 10. Scatter plot of the differences in x-y position (cm) for primary vertex positions determined by FTPC West global tracks and main TPC glbtrks. Should scatter about (0,0).

1. StEMB vertex,prim: z(ftpcW)-z(tpc): Not filled in Run 10. Distribution of the differences along the z-axis, i.e. beam direction, in cm for primary vertex positions determined by FTPC West global tracks and main TPC glbtrks. The mean should be near 0.
QA Reference for General Histograms - Run 9
STAR Offline QA Shift Histogram Description - Run 9
Note: Not all reference plots may be ideal, be sure to carefully read the descriptions.
This page contains the reference histograms and descriptions for the Offline QA system for Run 9. These pages should correspond exactly to the jobs viewed in the Offline QA Browser. However, STAR is a dynamic experiment and the plots generated for QA will change several times throughout the run. If this reference page seems out-of-date, or if you find a job that would make a better reference, please email the QA hypernews list here.
Other links:
Elizabeth Wingfield for the QA Team.
April 2, 2009.
Page Index for QA Shift Plots
- Page 1
- Page 2
Page 1

1. StE trigger word: Distribution of trigger word groups: 1 = minimum bias, 2 = central, 3 = high pt, 4 = Jet patch, 5 = high BEMC tower, 6 = other.
2. StE trigger bits: Frequency of usages of 32 trigger bits.
3. StE softmon: all charge east/west,tpc: Ratio of total charge in all reconstructed clusters in TPC east to west halves. Should be peaked at ~1 with FWHM ~ 0.5, but is not being filled in this run.
4. StE softmon: all charge east/west,ftpc: Ratio of total charge in all reconstructed clusters in FTPC East to West. Not filled in this run.
5. FTPC West chargestep: The real chargestep corresponds to the maximum drift time in FTPC West (clusters from inner radius electrode) and is located near 170 timebins. This position will change slightly with atmospheric pressure. The hits beyond the step at timebin 170 are due to electronic noise and pileup. This step should always be visible even if it is only a "blip". Not filled in this run.
6. FTPC East chargestep: The real chargestep corresponds to the maximum drift time in FTPC East (clusters from inner radius electrode) and is located near 170 timebins. This position will change slightly with atmospheric pressure. The hits beyond the step at timebin 170 are due to electronic noise and pileup. This step should always be visible even if it is only a "blip". Not filled in this run.
Page 2
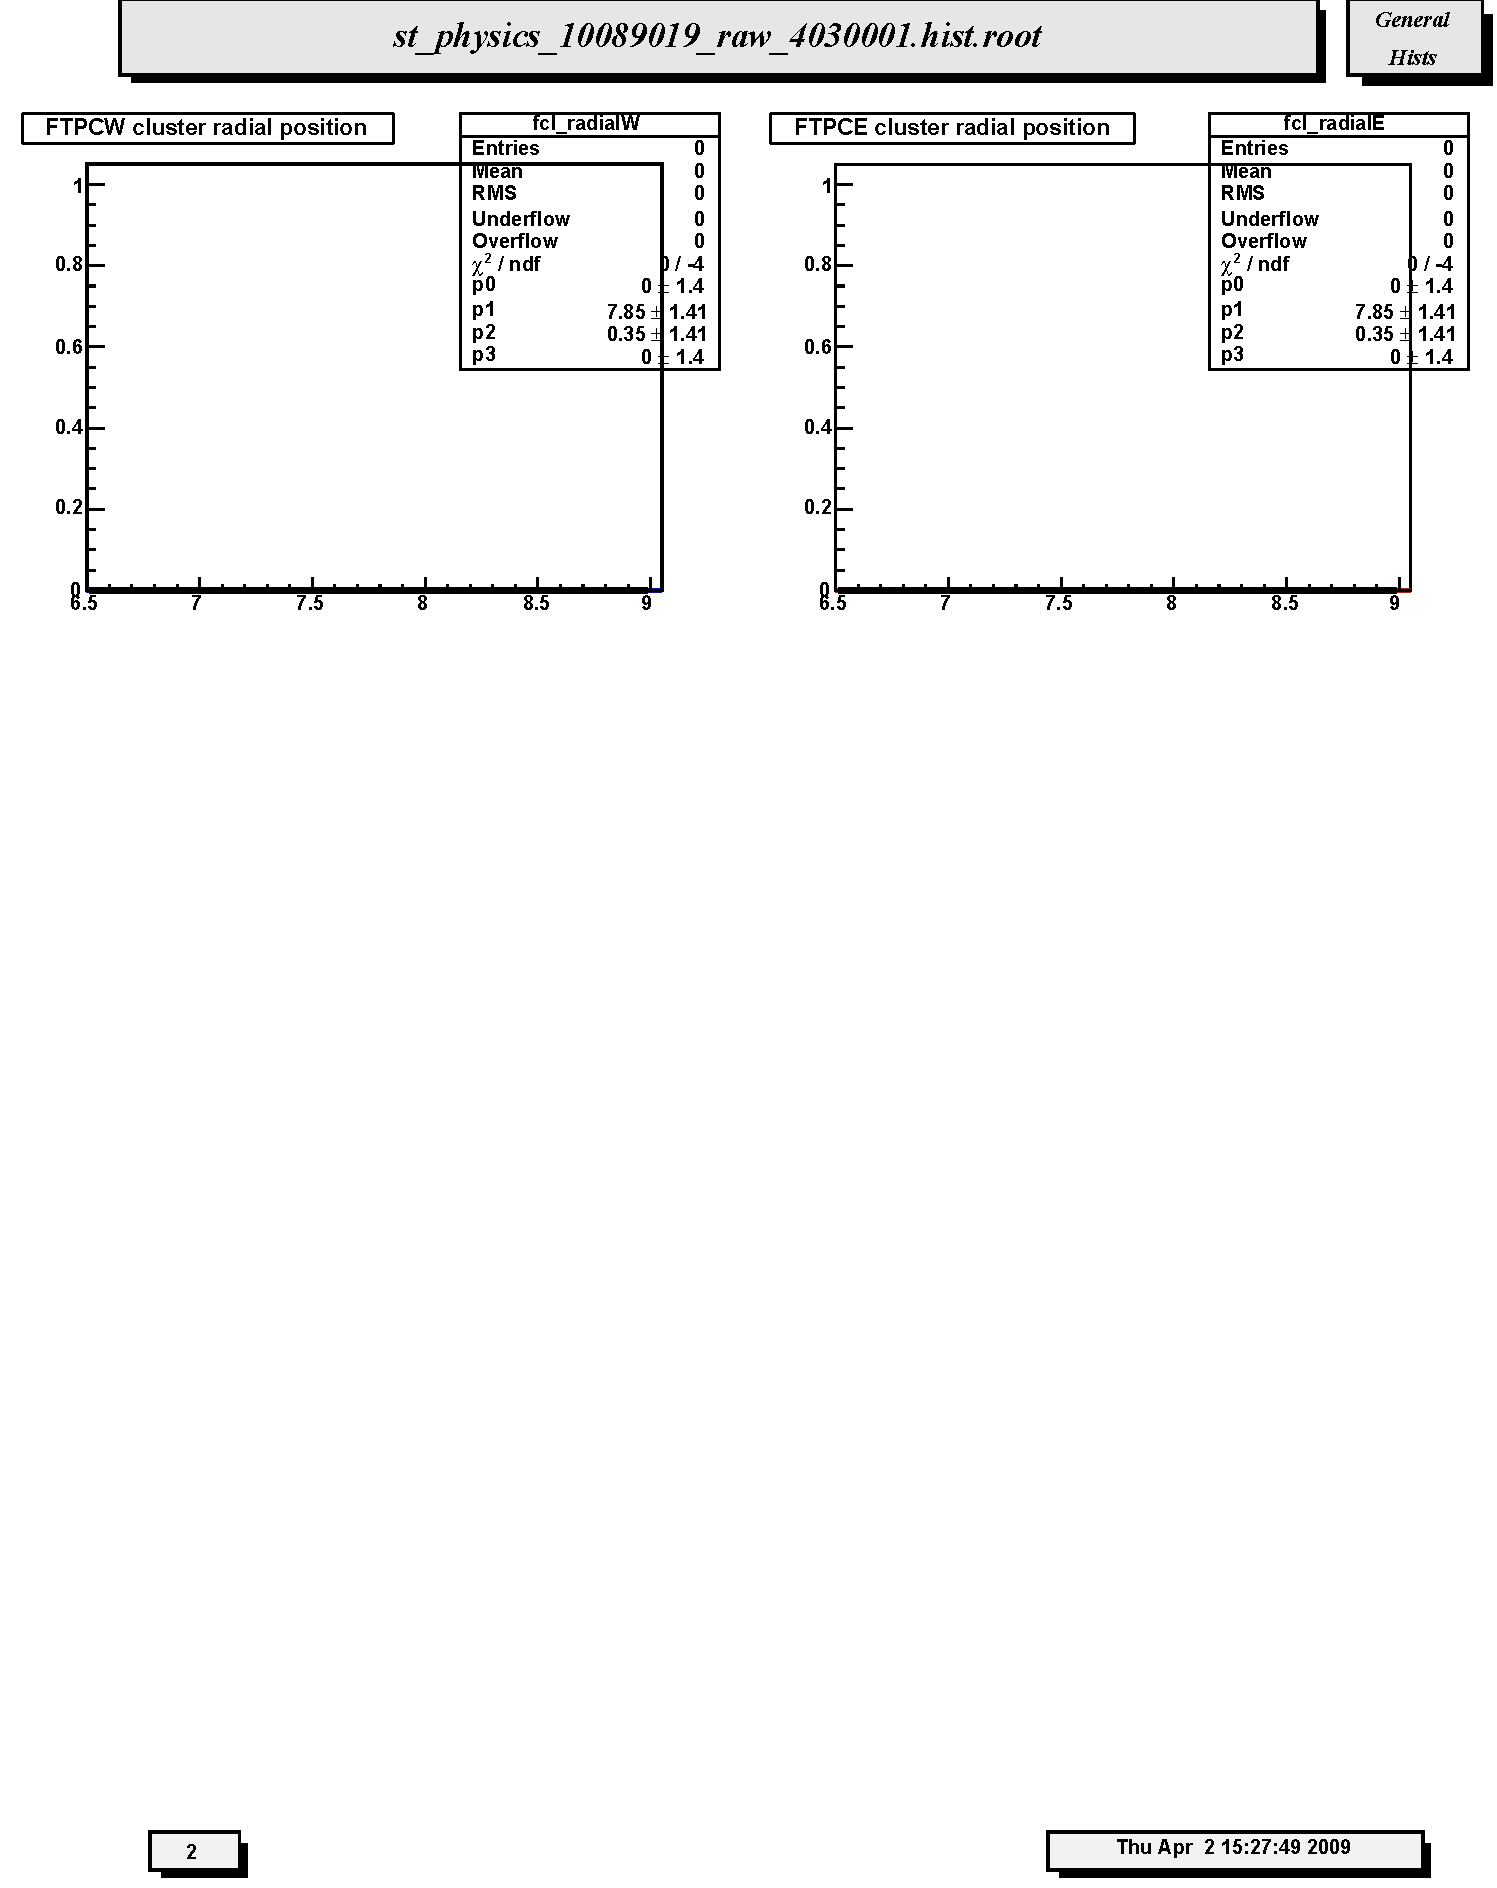
1. FTPCW cluster radial position: Radial positions of clusters. Not filled in this run.
2. FTPCE cluster radial position: Radial positions of clusters. Not filled in this run.
QA Reference for Trigger Specific Histograms - Run 9
STAR Offline QA Shift Histogram Description - Run 9
Note: Not all reference plots may be ideal, be sure to carefully read the descriptions.
This page contains the reference histograms and descriptions for the Offline QA system for Run 9. These pages should correspond exactly to the jobs viewed in the Offline QA Browser. However, STAR is a dynamic experiment and the plots generated for QA will change several times throughout the run. If this reference page seems out-of-date, or if you find a job that would make a better reference, please email the QA hypernews list here.
Other links:
Elizabeth Wingfield for the QA Team.
April 2, 2009.
Page Index for QA Shift Plots
- Page 1
- Page 2
- Page 3
- Page 4
- Page 5
- Page 6
- Page 7
- Page 8
- Page 9
- Page 10
- Page 11
- Page 12
- Page 13
- Page 14
Page 1
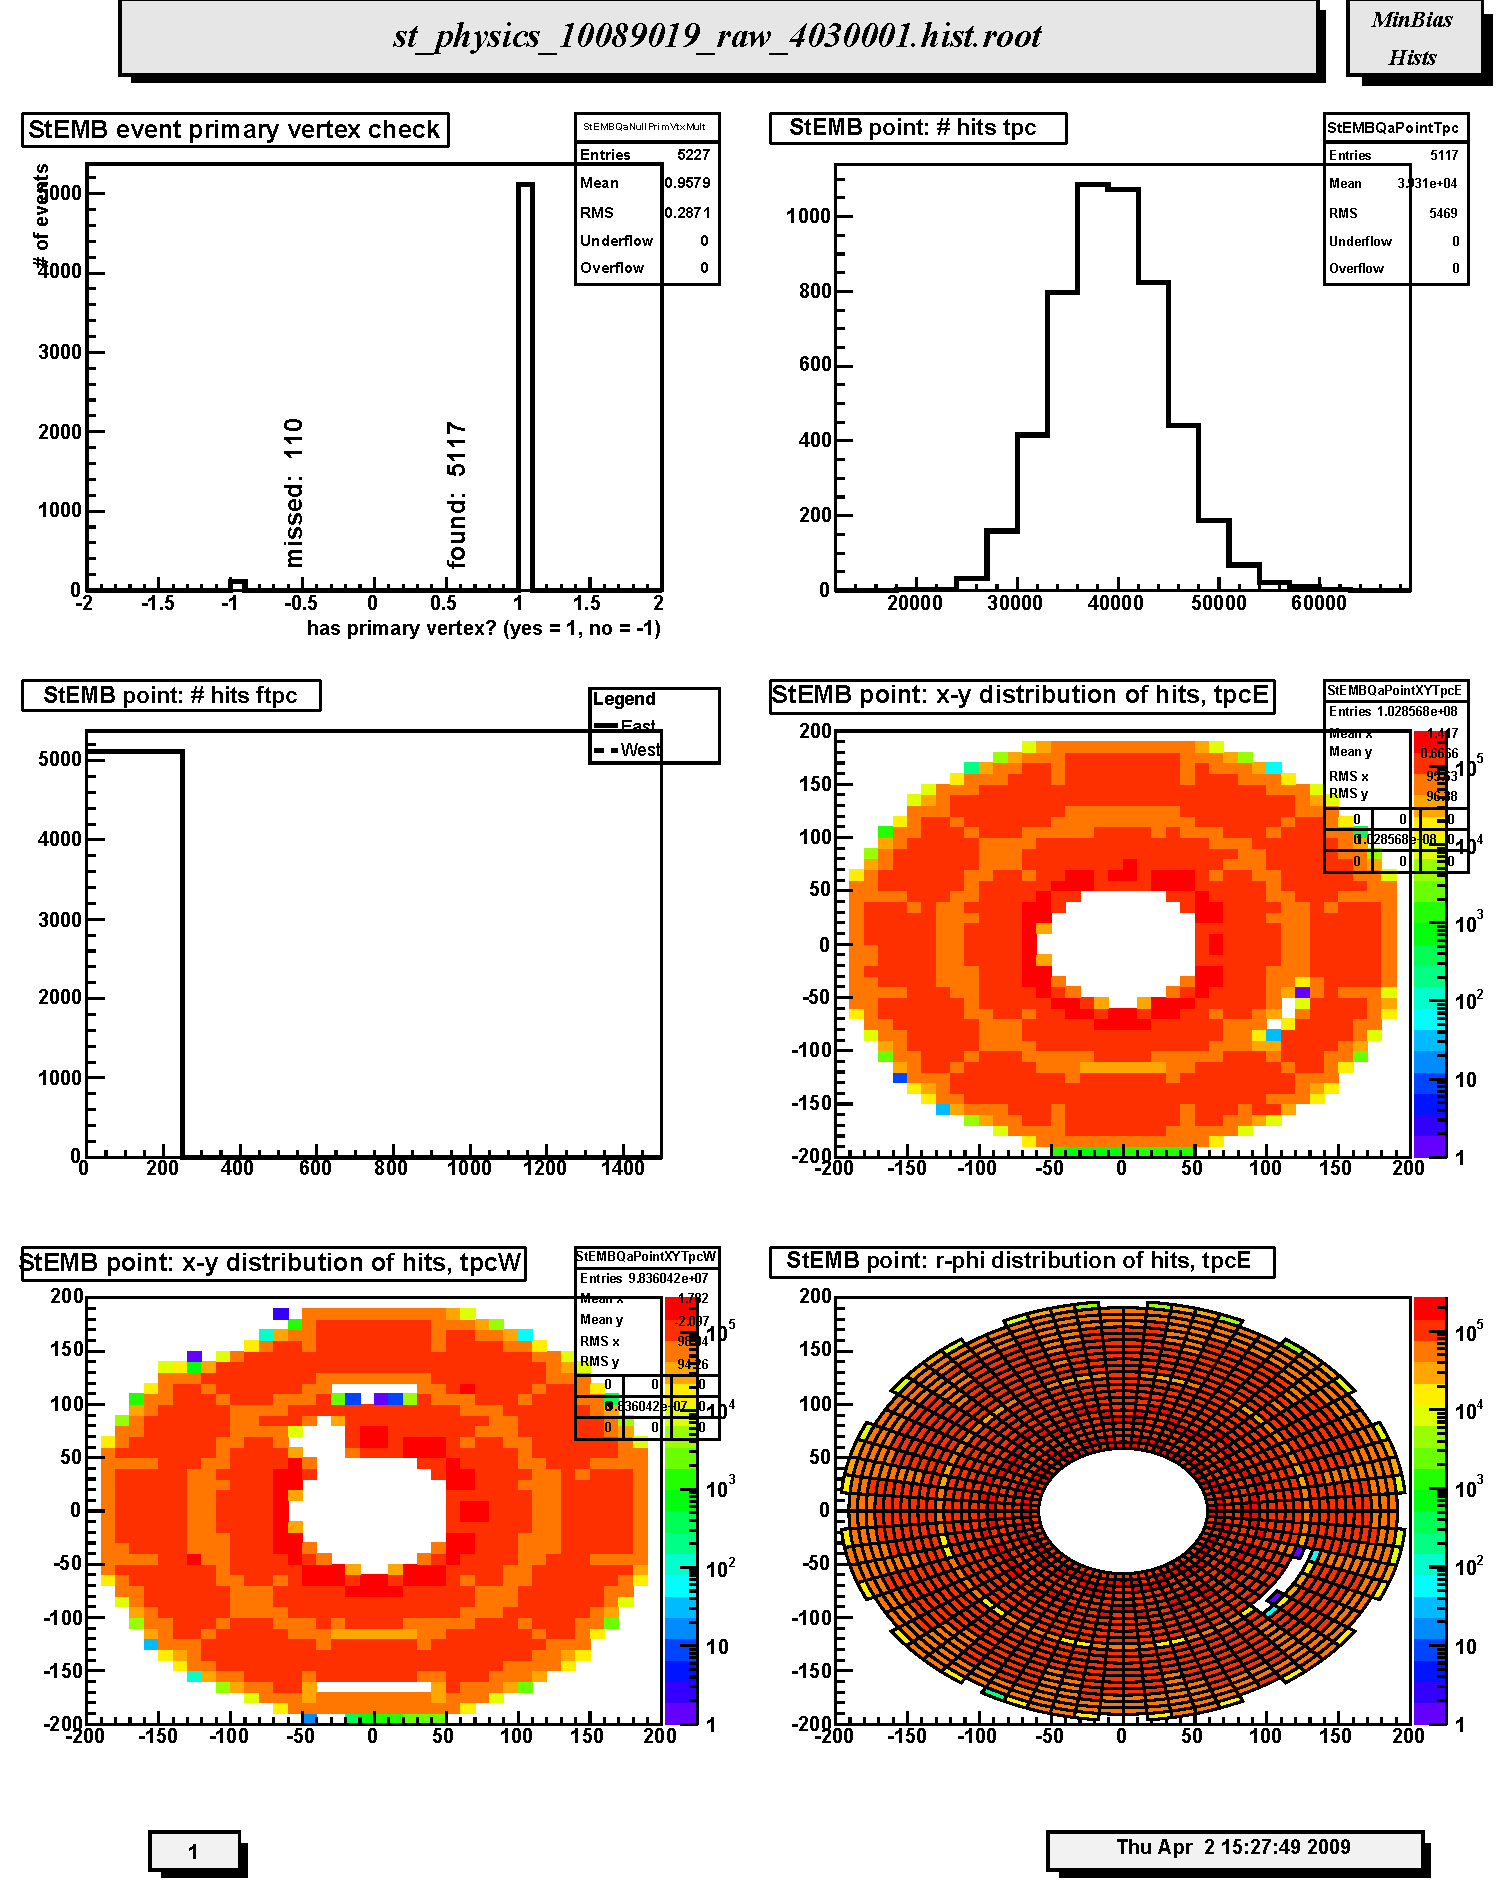
1. StEMB event primary vertex check: Primary vertex finding status for run; events with (1) and without (-1) final vertex. The relative fraction of events with primary vertex depends on trigger, beam diamond width and position.
2. StEMB point: # hits tpc : Distribution of number of reconstructed space points in TPC per event. Should scale with centrality, depends on multiplicity cut and trigger.
3. StEMB point: # hits ftpc: Not filled in this run. Distribution of number of reconstructed space points in FTPC East (solid line) and West (dashed line) per event. Scales with centrality, depends on multiplicity cut and trigger.
4. StEMB point: x-y distribution of hits, tpcE: Scatter plot of the azimuthal distribution of reconstructed space points in the East TPC. The distribution should be azimuthally uniform except for the 12 sector structure of the TPC (lighter areas indicate sector boundaries). Density should decrease radially but inner and outer sector structure should be present (darker areas in the innermost pads of the inner and outer sectors). Watch for empty areas (typically masked RDOs) and hot spots. Notify TPC experts if new empty area or hot spot appears.
5. StEMB point: x-y distribution of hits, tpcW: Scatter plot of the azimuthal distribution of reconstructed space points in the West TPC. The distribution should be azimuthally uniform except for the 12 sector structure of the TPC (lighter areas indicate sector boundaries). Density should decrease radially but inner and outer sector structure should be present (darker areas in the innermost pads of the inner and outer sectors). Watch for empty areas (typically masked RDOs) and hot spots. Notify TPC experts if new empty area or hot spot appears.
6. StEMB point: r-phi distribution of hits, tpcE: Same as the x-y scatter plot except in polar coordinates.
Page 2
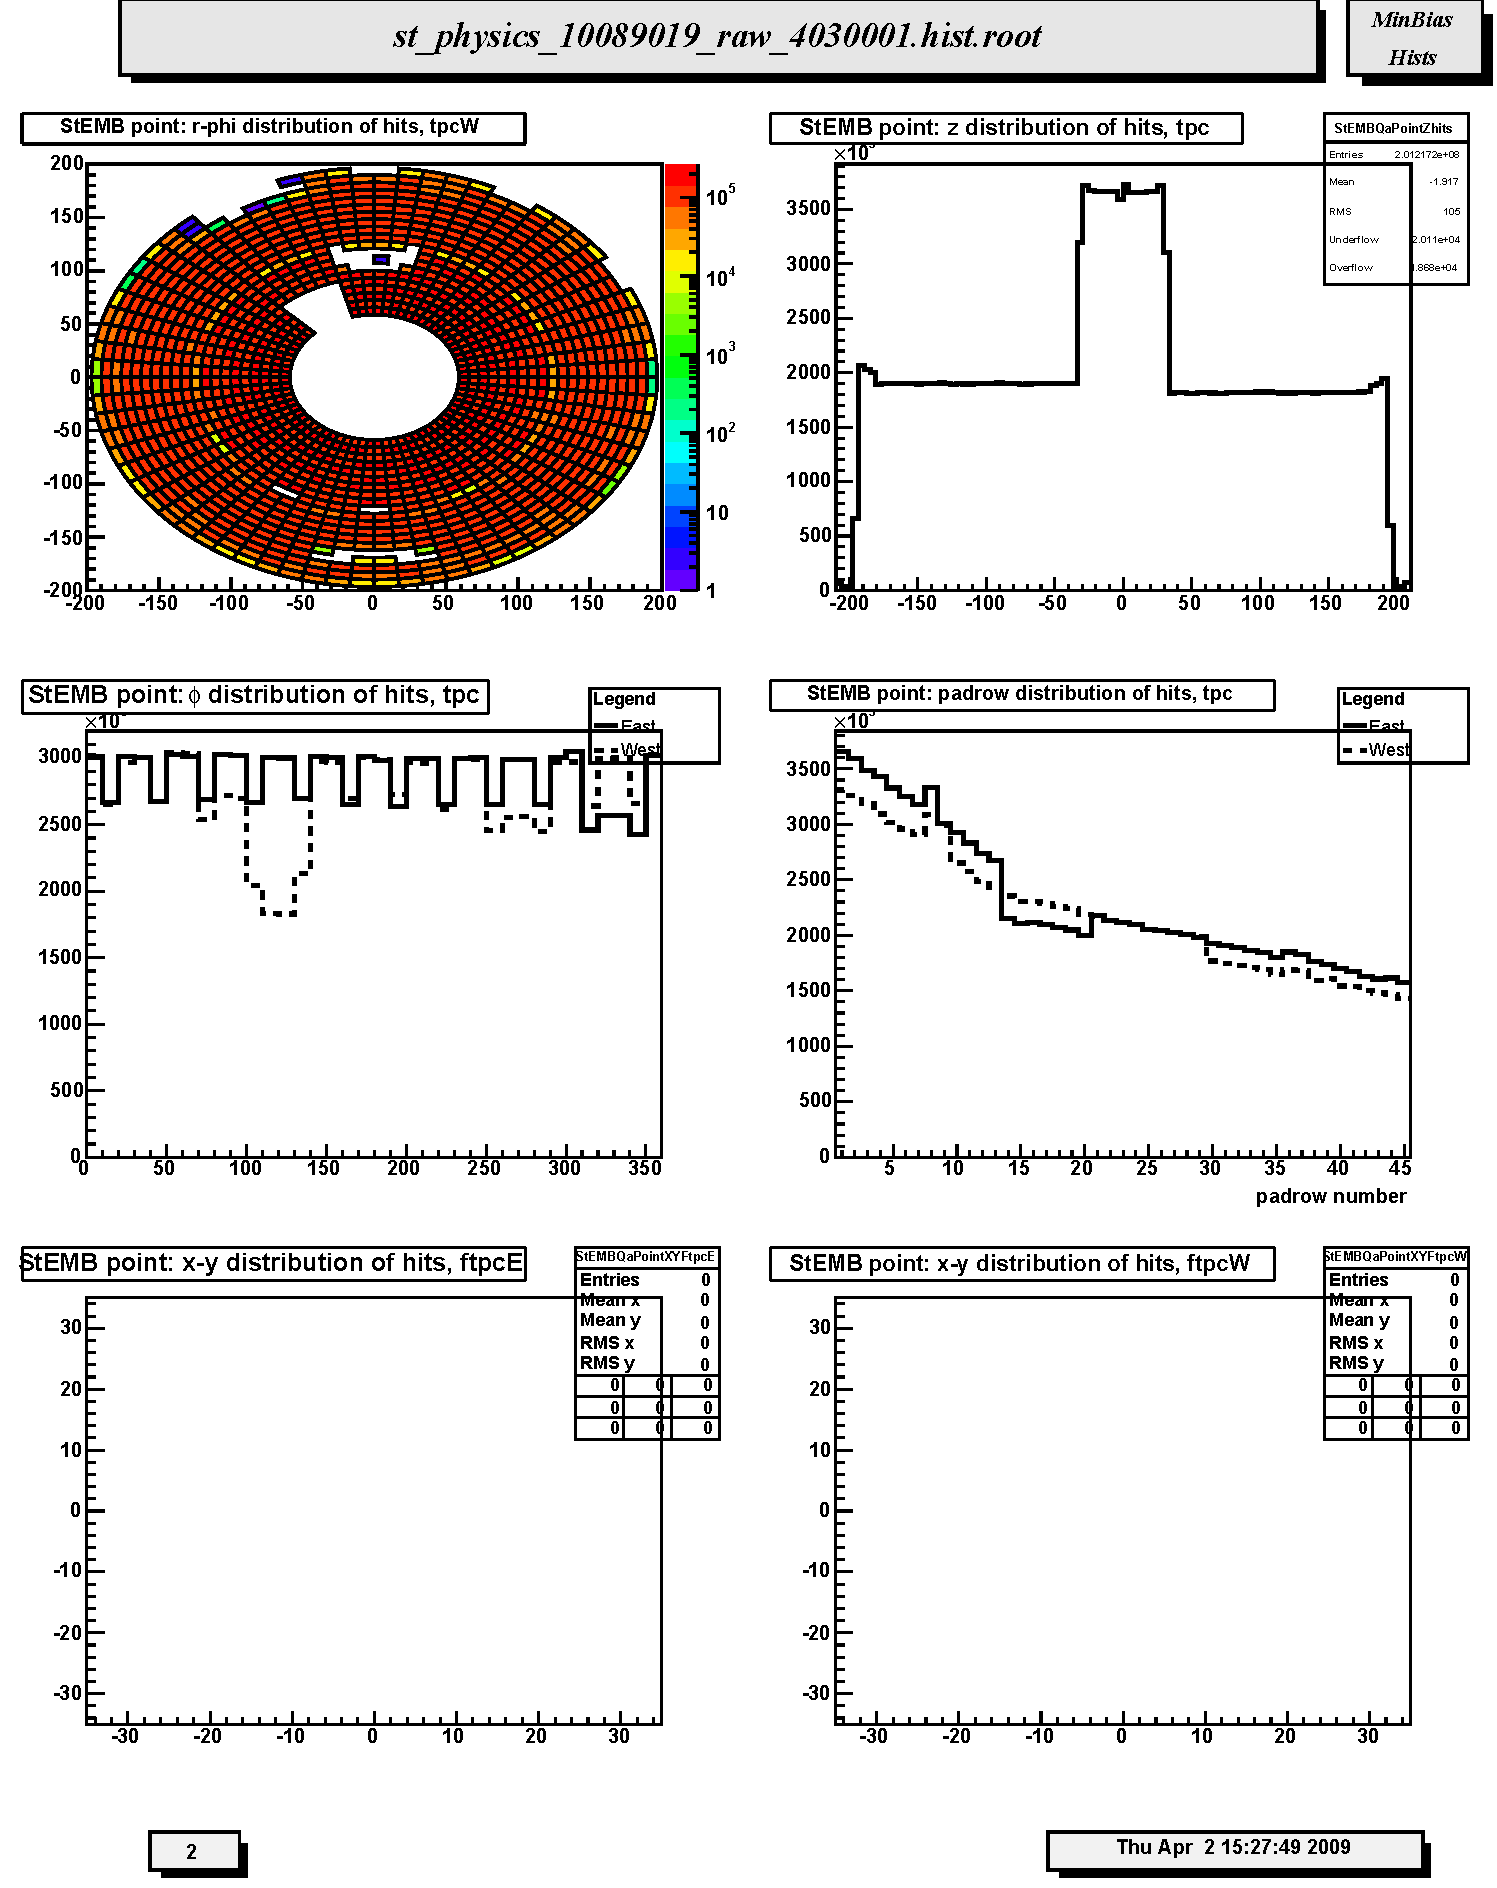
1. StEMB point: r-phi distribution of hits, tpcW: Same as the x-y scatter plot except in polar coordinates.
2. StEMB point: z distribution of hits, tpc: Distribution of reconstructed space points in TPC with respect to z-coordinate. For p-p running there is a broad peak above the nominally flat background at z=0. This is intentional and is done in order to allow identification of post-trigger pileup events. Watch out for any other anamolous steps or unusual spikes or dips.
3. StEMB point: #phi distribution of hits, tpc: Distribution of reconstructed space points in TPC with respect to azimuthal coordinate (phi) for east (solid line) and west (dashed line) halves. Should be flat except for the 12-fold sector structure or masked RDOs (as shown). Dead RDO's will produce dips and gaps; hot pads or FEE cards will produce spikes.
4. StEMB point: padrow distribution of hits, tpc: Distribution of reconstructed space points in TPC with respect to padrow number 1-45. Should display gradual fall-off; watch for anamolous spikes and dips. Padrow 13 has been restored for Run 9.
5. StEMB point: x-y distribution of hits, ftpcE: Not filled in this run. Radial distribution of reconstructed space points in FTPC East. The distribution should be uniform except for the insensitive gaps between the six readout sectors. Localized denser areas are due to noise. Ideally noisy pads are flagged in the FTPC gain tables so that they are not used for cluster finding. Less densely populated areas not on the sector boundaries are due to dead electronics. Empty areas not on the sector boundaries indicates a serious hardware problem. An FTPC expert should be contacted immediately if this is seen in fast offline-QA during data taking.
6. StEMB point: x-y distribution of hits, ftpcW: Not filled in this run. Radial distribution of reconstructed space points in FTPC West. The distribution should be uniform except for the insensitive gaps between the six readout sectors. Localized denser areas are due to noise. Ideally noisy pads are flagged in the FTPC gain tables so that they are not used for cluster finding. Less densely populated areas not on the sector boundaries are due to dead electronics. Empty areas not on the sector boundaries indicates a serious hardware problem. An FTPC expert should be contacted immediately if this is seen in fast offline-QA during data taking.
Page 3

1. StEMB point: plane distribution of hits, ftpc: Not filled in this run. Number of reconstructed space points assigned to tracks in FTPC East (solid line) and West (dashed line) in each padrow. The horizontal axis shows padrow numbers where FTPC-West is 1-10 and FTPC-East is 11-20. Padrows #1 and #11 are closest to the center of STAR. East and West should be similar in shape but West will have less magnitude than east for d+Au. Spikes indicate noisy electronics; dips indicate dead electronics.
2. StEMB point: #pads vs #timebins of hits, ftpcE: Not filled in this run. Monitors the cluster quality in FTPC East. Ideally the clusters should have a pad length of 3-5 and a timebin length of 4-6. A prominent peak located at (2,2) indicates bad gas or loss of gain or excessive background.
3. StEMB point: #pads vs #timebins of hits, ftpcW: Not filled in this run. Monitors the cluster quality in FTPC West. Ideally the clusters should have a pad length of 3-5 and a timebin length of 4-6. A prominent peak located at (2,2) indicates bad gas or loss of gain or excessive background.
4. StEMB Number hits in cluster for bemc: Distribution of number of BEMC towers contributing to energy clusters.
5. StEMB Energy of cluster for bemc: Distribution of energy in reconstructed clusters in EMC barrel. The spike at 6 for minbias events seems anomalous.
6. StEMB Eta of clusters for bemc: Azimuthally integrated pseudorapidity distribution of reconstructed energy clusters in the EMC-barrel. Note there will be gaps due to missing and/or uninstrumented sectors. Report any unexpected gaps or unusual spikes. For Run 9 the full barrel is instrumented. The distribution should nominally be flat.
Page 4
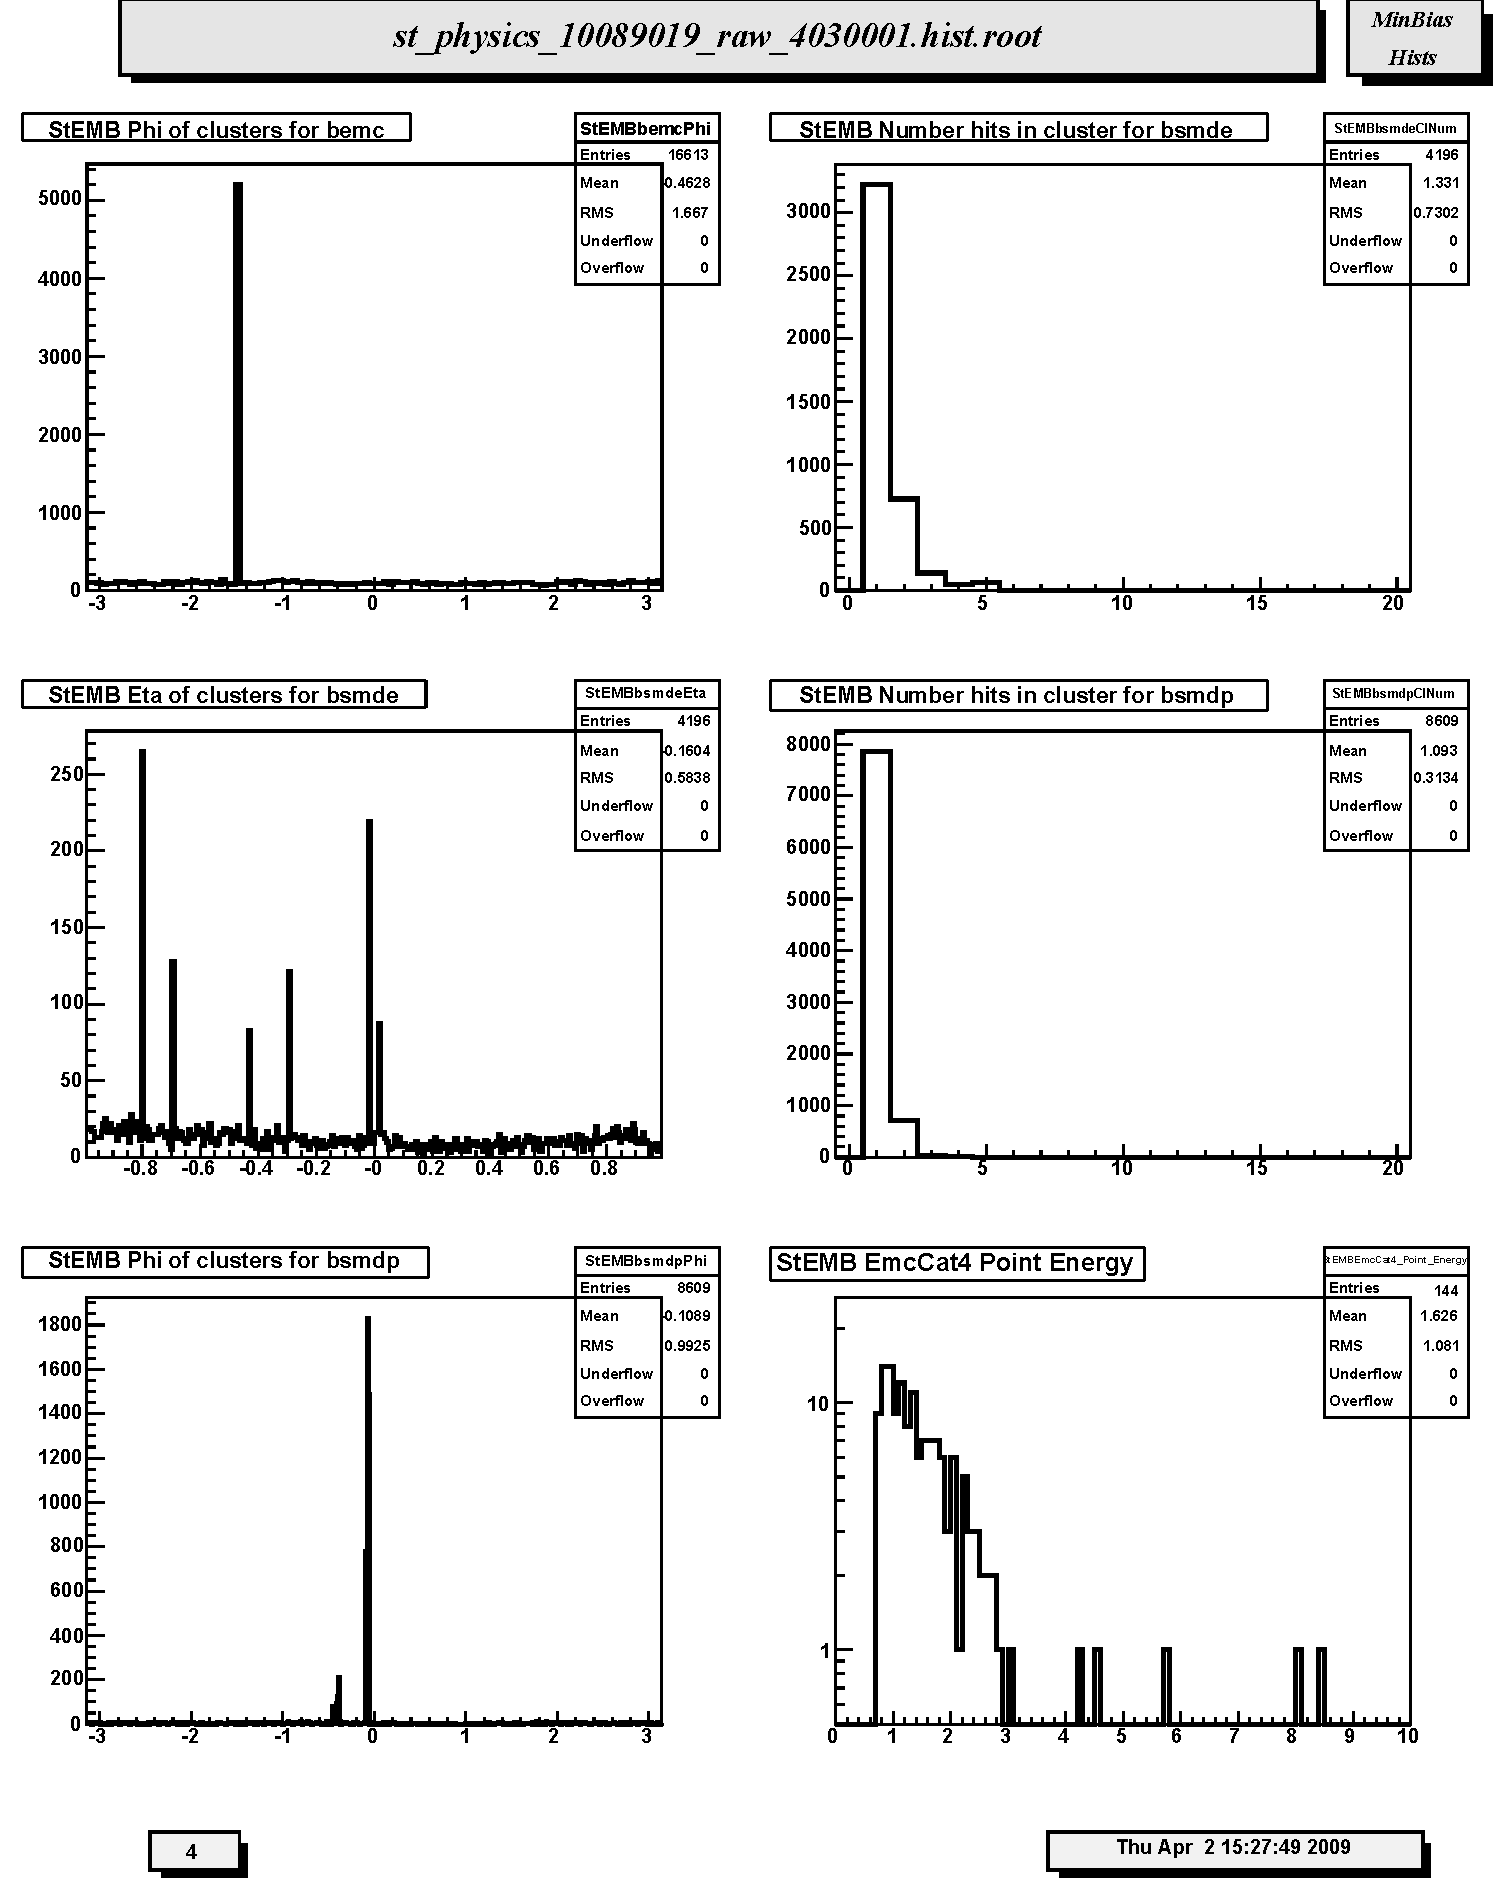
1. StEMB Phi of clusters for bemc: Pseudorapidity integrated azimuthal distribution (radians) of reconstructed energy clusters in the EMC-barrel. Note there will be gaps due to missing and/or uninstrumented sectors. Report any unexpected gaps or unusual spikes.
2. StEMB Number hits in cluster for bsmde: Distribution of numbers of hits (anodes) contributing to Barrel SMD clusters along pseudorapidity.
3. StEMB Eta of clusters for bsmde: Pseudorapidity distribution of reconstructed energy clusters in the BSMD anode grid along pseudorapidity. Note there will be gaps due to missing and/or uninstrumented sectors. Report any unexpected gaps or unusual spikes. Distribution should nominally be flat.
4. StEMB Number hits in cluster for bsmdp: Distribution of numbers of hits (anodes) contributing to Barrel SMD clusters along azimuth.
5. StEMB Phi of clusters for bsmdp: Azimuthal distribution of reconstructed energy clusters in the BSMD anode grid along azimuth angle (phi in radians). Note there will be gaps due to missing and/or uninstrumented sectors. Report any unexpected gaps or unusual spikes.
6. StEMB EmcCat4 Point Energy: Energy distribution for Barrel EMC-SMD Category 4 clusters. Cat4 clusters correspond to TPC track matched clusters in the EMC barrel, BSMD-eta and BSMD-phi detectors.
Page 5
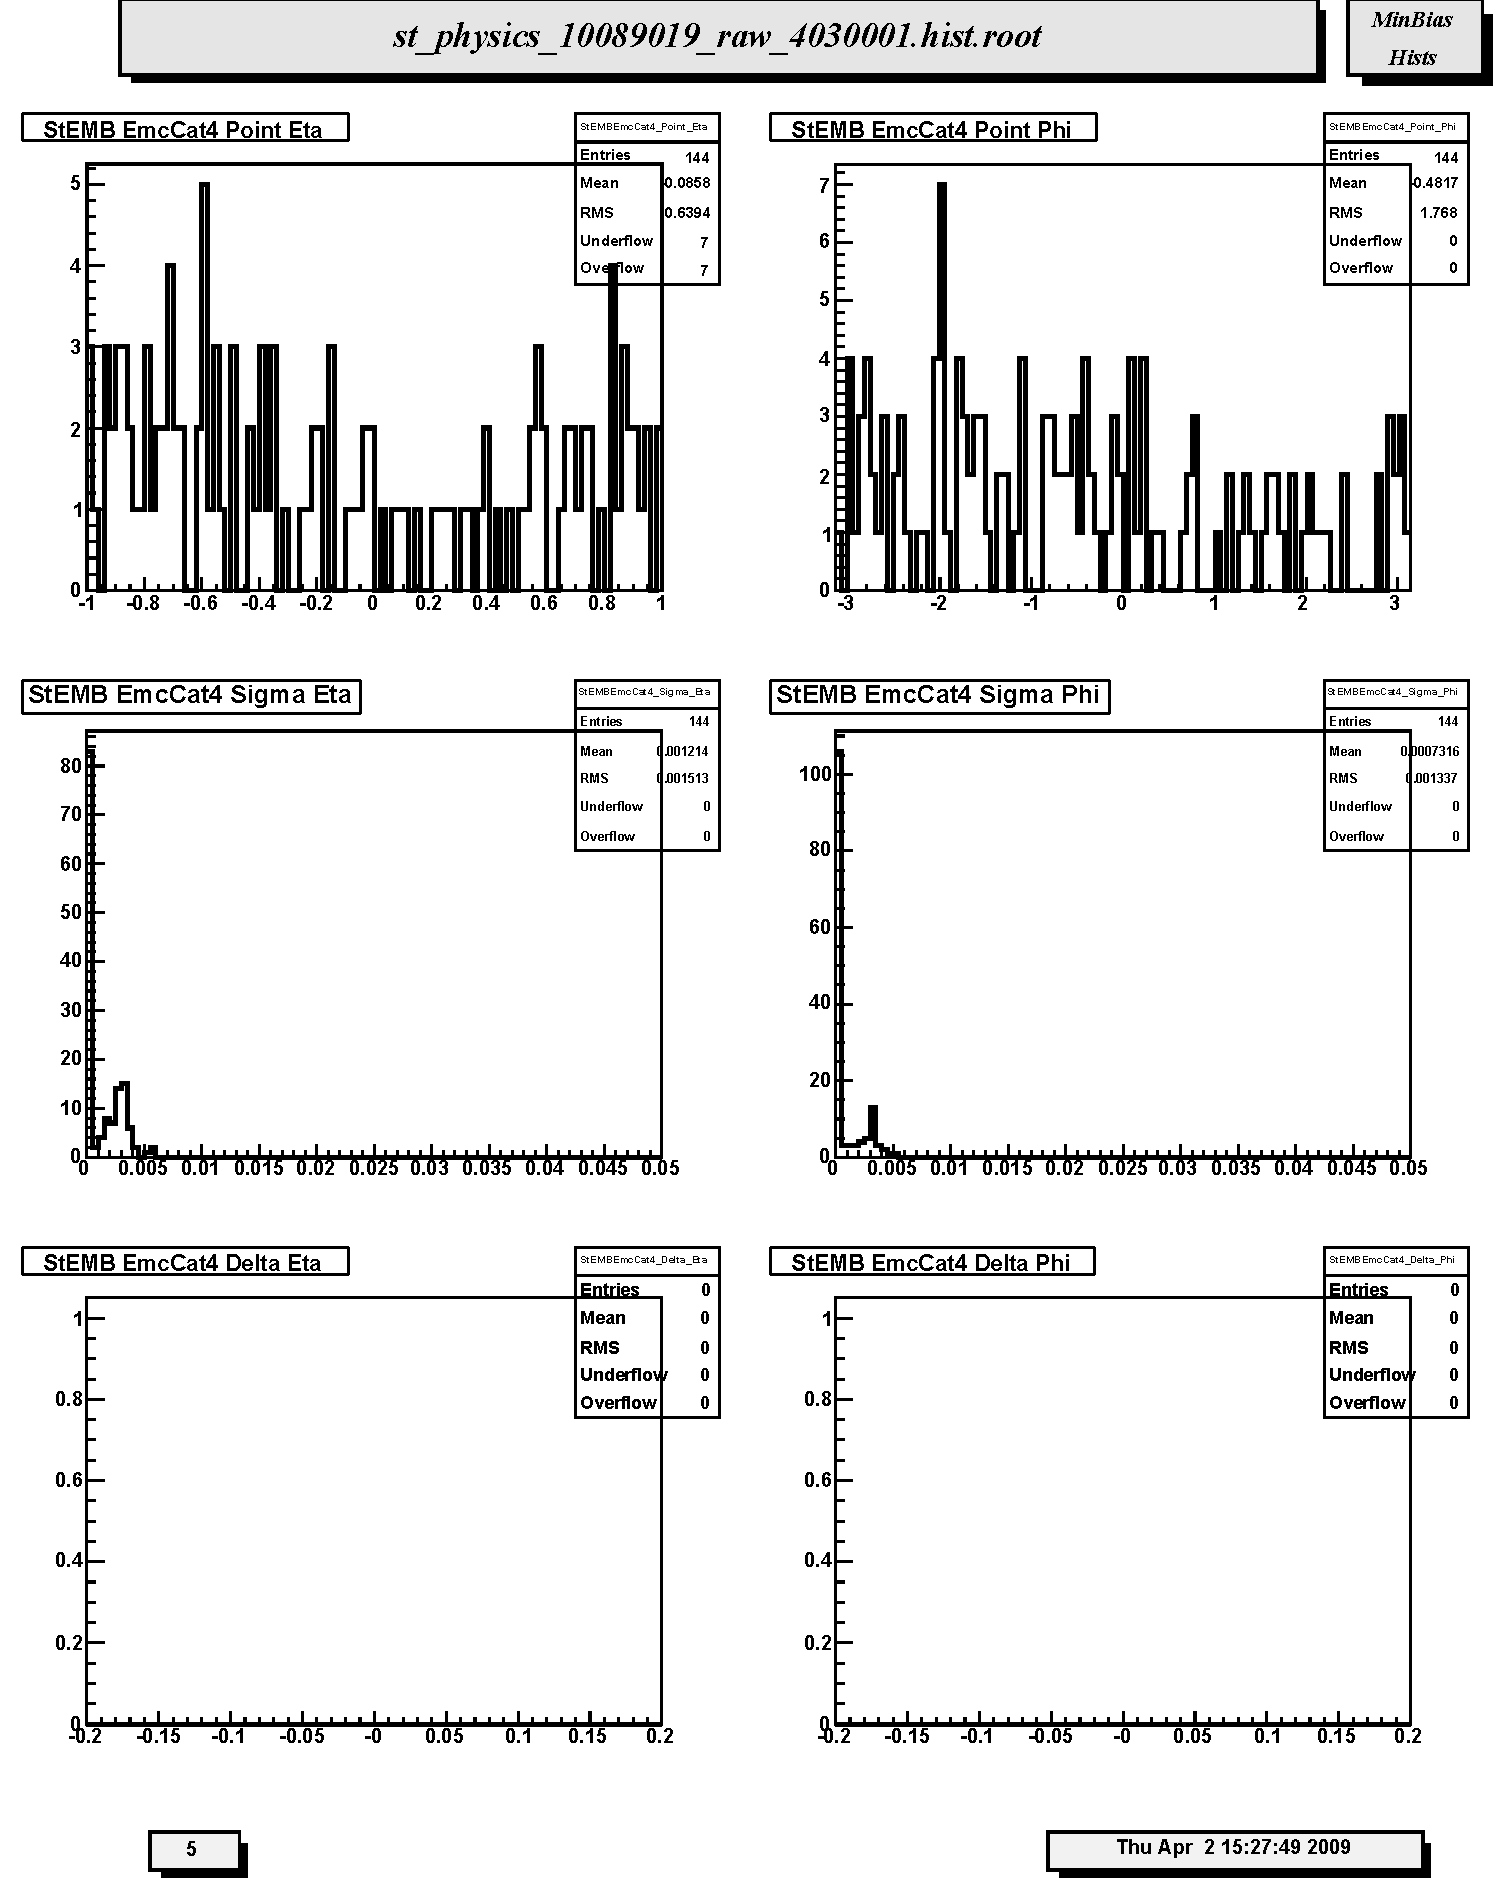
1. StEMB EmcCat4 Point Eta: Pseudorapidity distribution for EMC-SMD Category 4 clusters. Distribution should nominally be flat.
2. StEMB EmcCat4 Point Phi: Azimuthal distribution for EMC-SMD Category 4 clusters. Distribution should nominally be flat.
3. StEMB EmcCat4 Sigma Eta: Distribution of widths (sigma) of Category 4 Barrel EMC-SMD clusters with respect to pseudorapidity.
4. StEMB EmcCat4 Sigma Phi: Distribution of widths (sigma) of Category 4 Barrel EMC-SMD clusters with respect to azimuthal angle.
5. StEMB EmcCat4 Delta Eta: Differences between centroids of Category 4 Barrel EMC-SMD clusters and projected positions of TPC tracks at BEMC with respect to pseudorapidity. Should be peaked at ~0. Not filled in Run 9.
6. StEMB EmcCat4 Delta Phi: Differences between centroids of Category 4 Barrel EMC-SMD clusters and projected positions of TPC tracks at BEMC with respect to azimuthal angle. Should be peaked at ~0. Not filled in Run 9.
Page 6
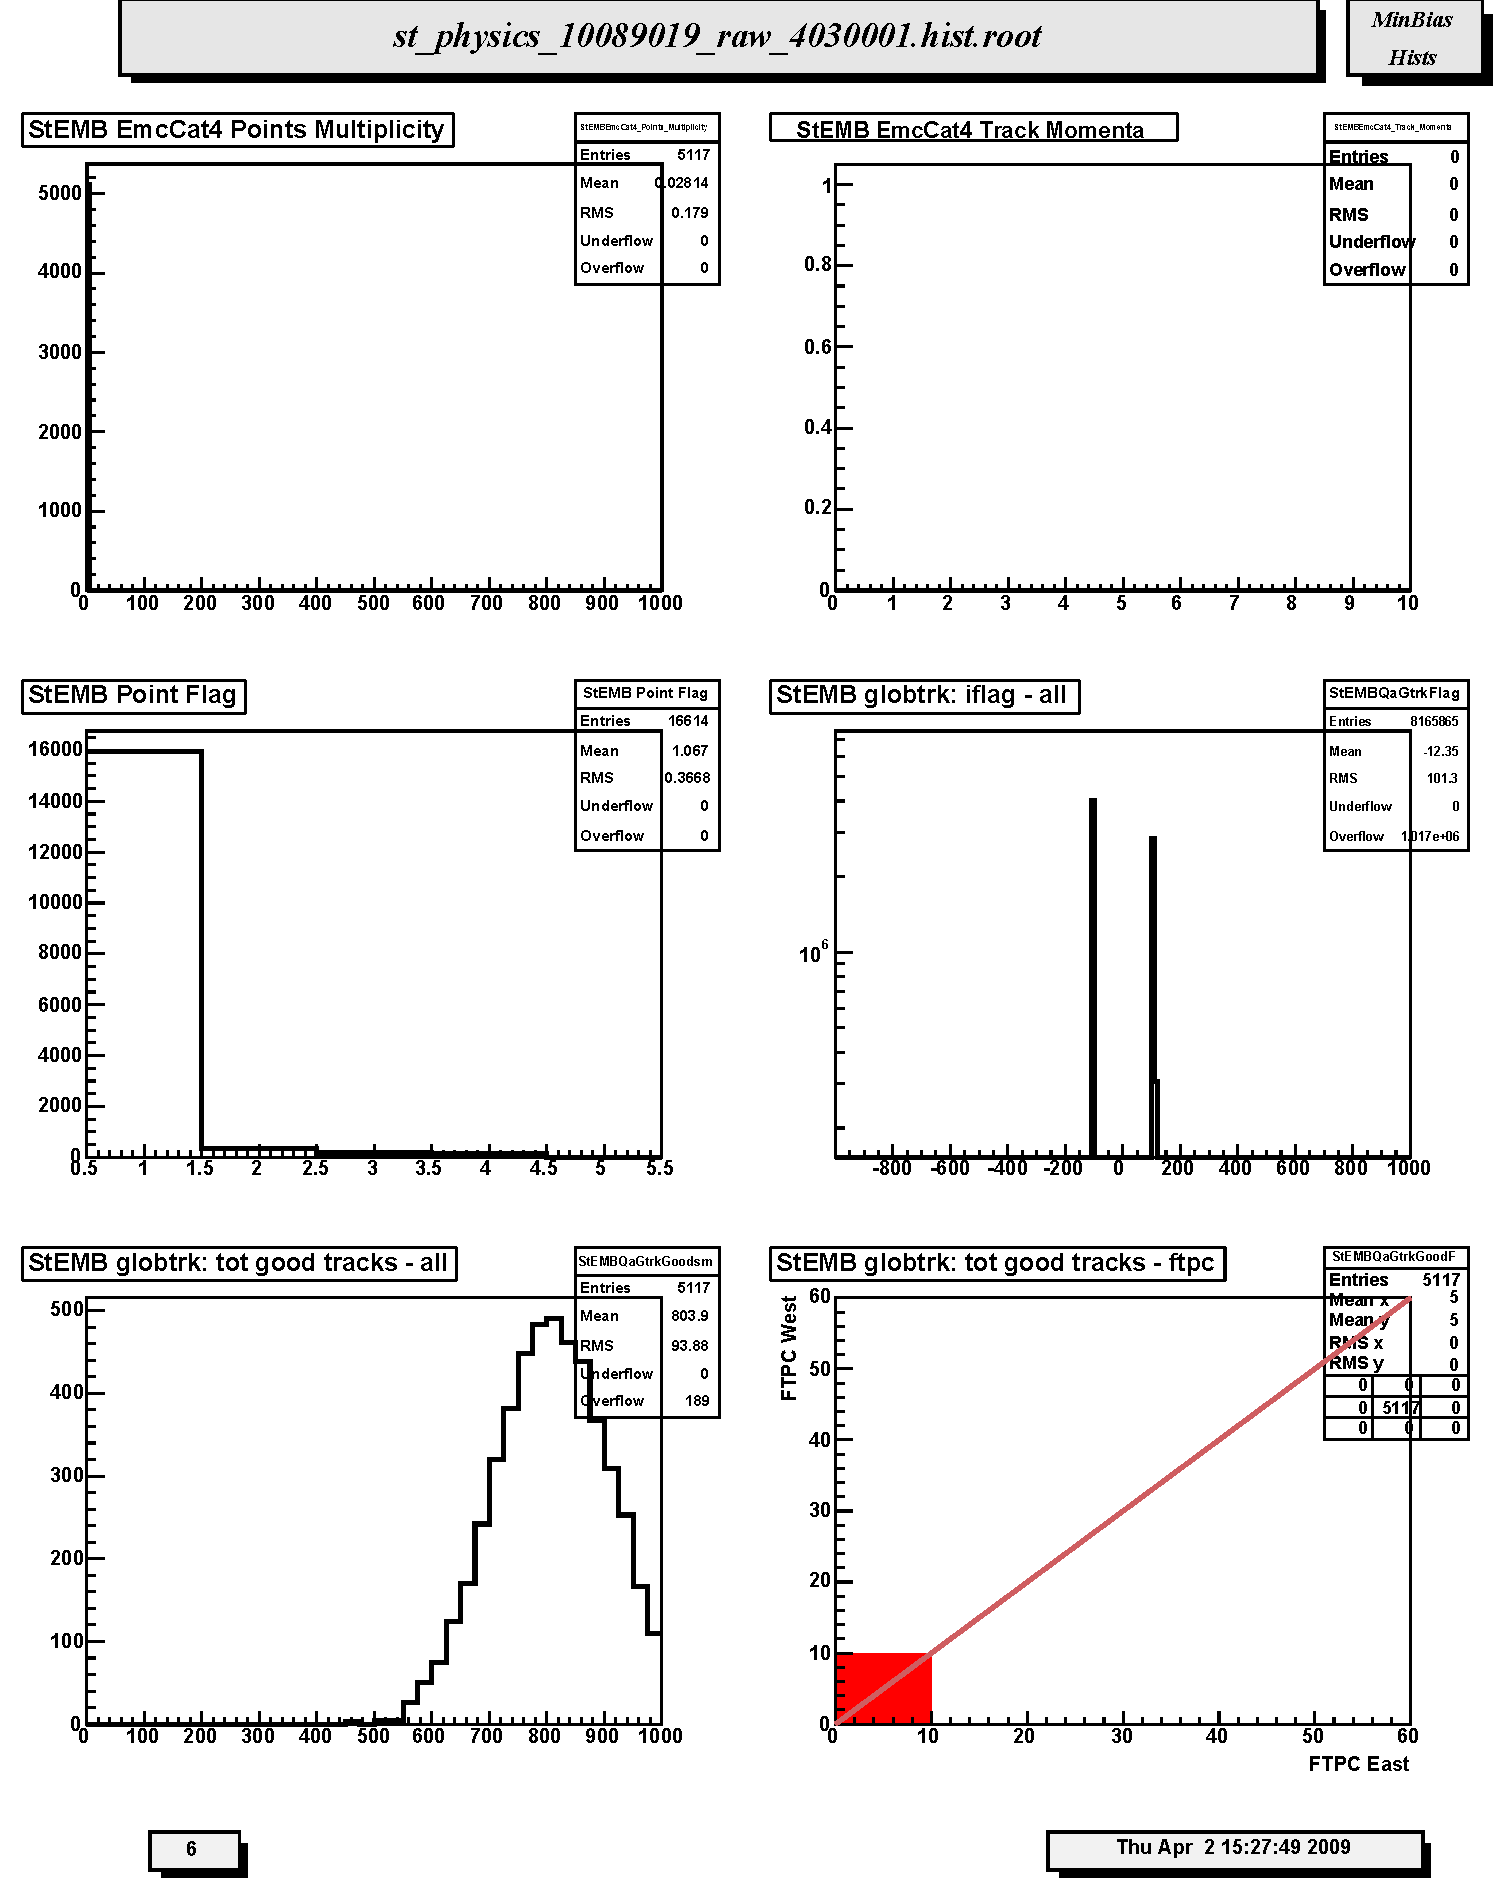
1. StEMB EmcCat4 Points Multiplicity: Frequency distribution of number of Category 4 clusters per event. Not filled in Run 9.
2. StEMB EmcCat4 Track Momenta : Distribution of TPC global track momentum for Barrel EMC-SMD Category 4 clusters. Not filled in Run 9.
3. StEMB Point Flag: Distribution of Barrel EMC and SMD cluster types by Category number. There should be a reasonable fraction of Cat4 clusters; report if less than 10% of total.
4. StEMB globtrk: iflag - all : Quality flag values for all global tracks. Some with large, negative values may not appear on plot; check stat. box for underflows. Majority of tracks should have iflag>0, corresponding to good, usable tracks. Refer to: dst_track_flags.html and kalerr.html for description of flag values. Note that in Runs 7-9 about half the tracks have iflag < 0 for unknown reasons.
5. StEMB globtrk: tot good tracks - all: Distribution of the number of good global tracks in the TPC per trigger; including pileup.
6. StEMB globtrk: tot good tracks - ftpc: Not filled in this run. Scatter plot of good global track multiplicities in FTPC West versus FTPC East.
Page 7
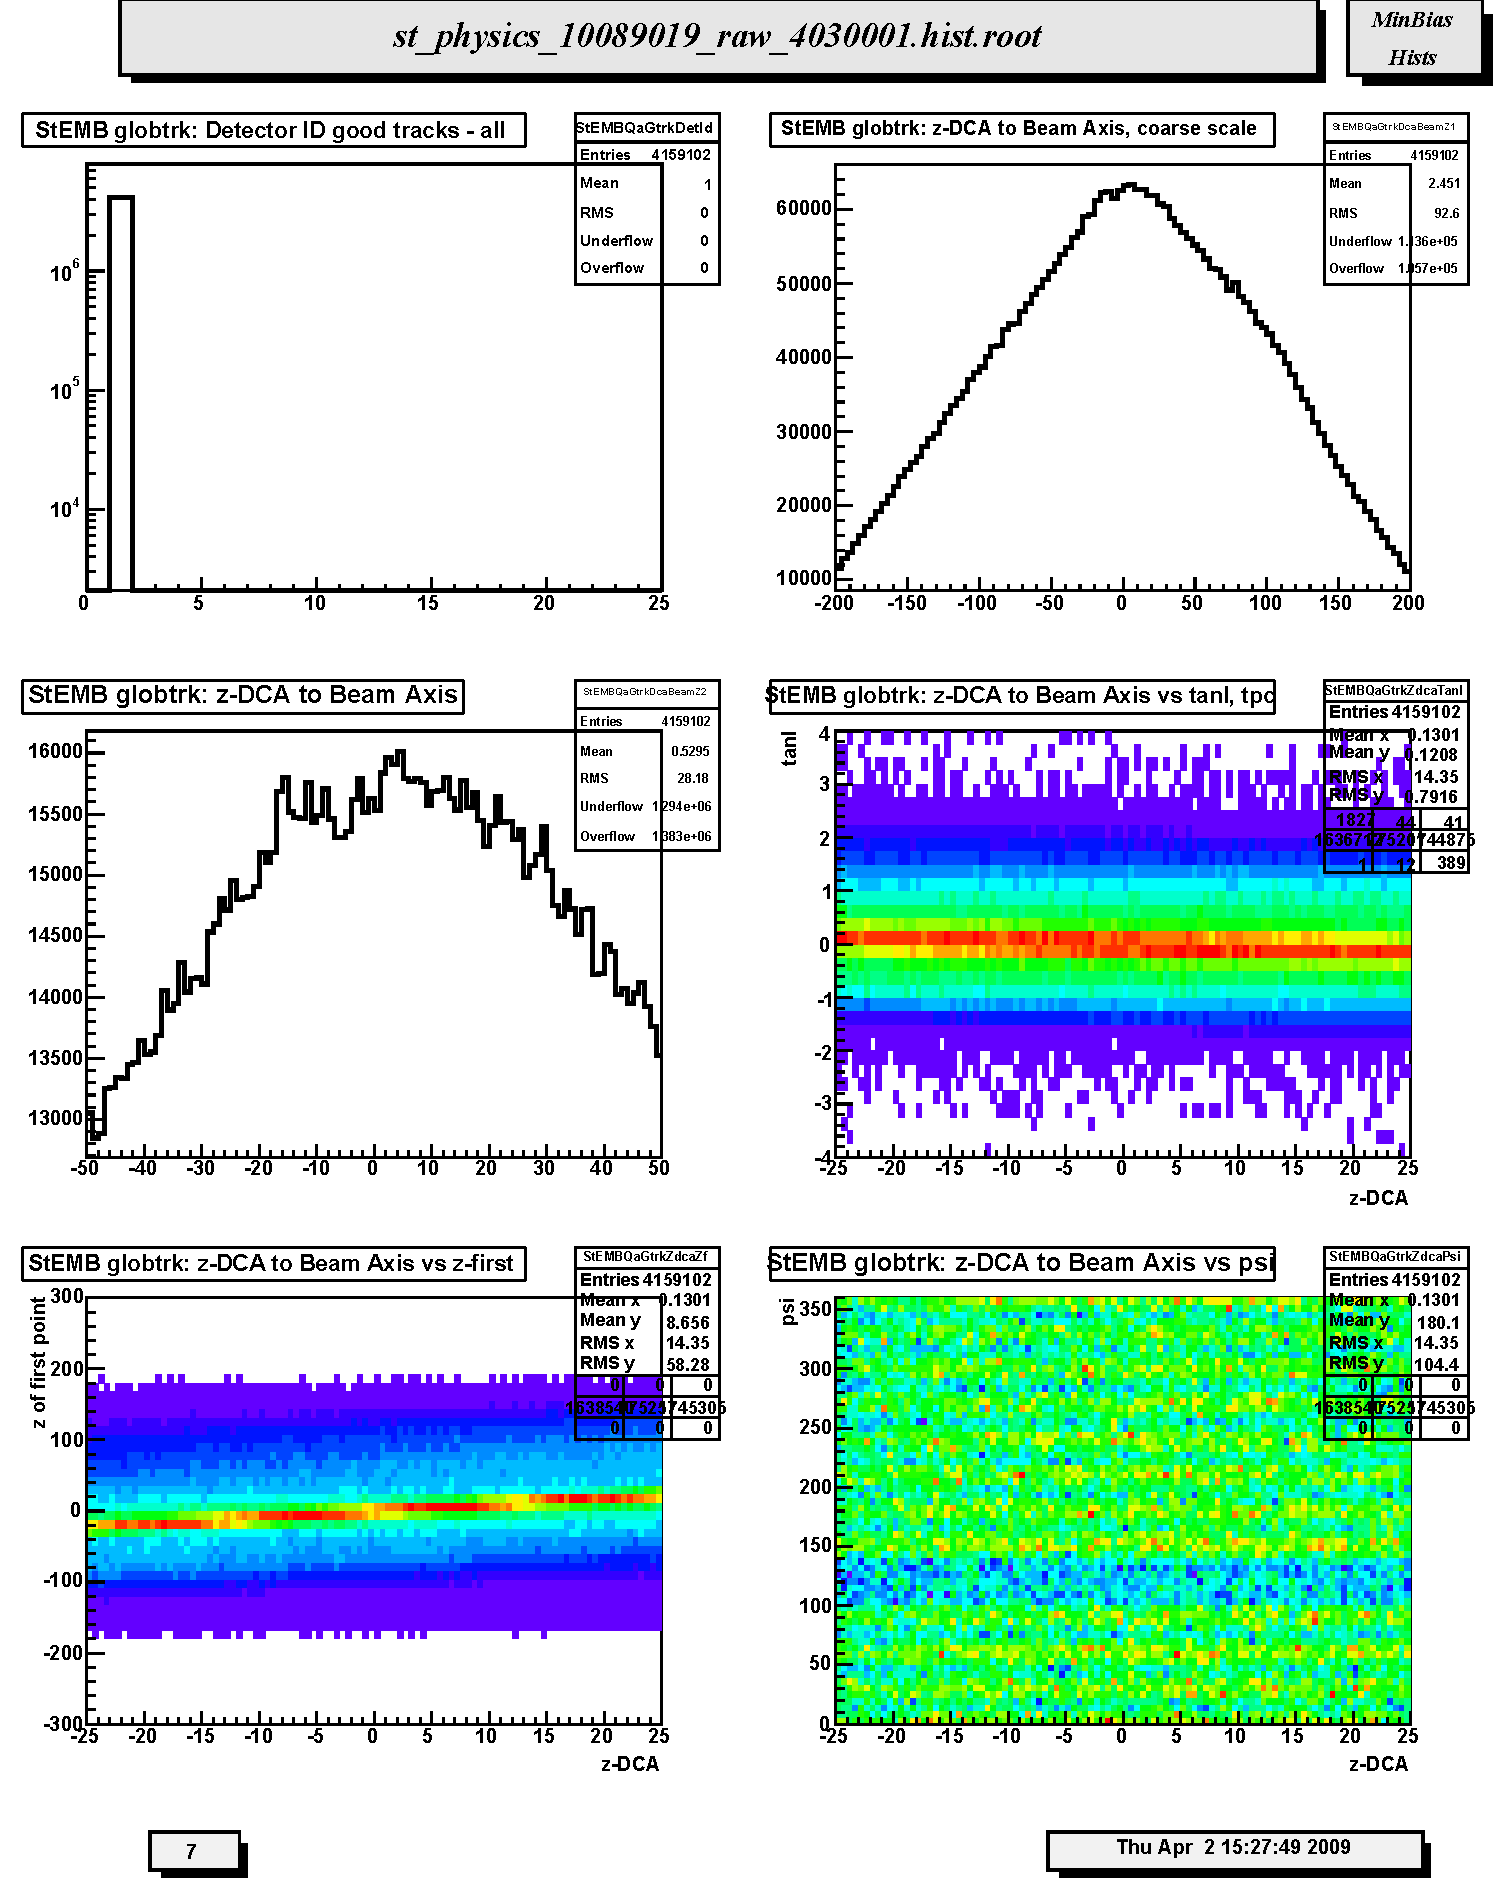
1. StEMB globtrk: Detector ID good tracks - all: Global track detector IDs for good tracks. Refer to: /afs/rhic/star/packages/DEV00/pams/global/inc/StDetectorDefinitions.h for Detector ID codes.
2. StEMB globtrk: z-DCA to Beam Axis, coarse scale: Coarse scale distribution along the z-axis (from -200 to +200 cm) of the DCA points to the nominal beam line (z-axis, x=y=0) for all TPC global tracks. Peaks indicate probable locations of individual collision vertices (not useful in p-p). Indentification of individual collision vertices is unlikely.
3. StEMB globtrk: z-DCA to Beam Axis: Fine scale distribution along the z-axis (from -50 to +50 cm) of the DCA points to the nominal beam line (z-axis, x=y=0) for all TPC global tracks. Peaks indicate probable locations of individual collision vertices. Indentification of individual collision vertices is unlikely in p-p.
4. StEMB globtrk: z-DCA to Beam Axis vs tanl, tpc: Not useful for p-p. Scatter plot of the tangent of the dip angle (tanl) versus the z-coordinate (from -25 to 25 cm) of the DCA points to the nominal beam line (z-axis, x=y=0) for all TPC global tracks. Vertical bands should be seen corresponding to individual events. The bands should be smooth and continuous; breaks at tanl=0 indicate probable TPC calibration errors in either the t0 offset or the drift speed. This is best seen for high multiplicity events. Cross reference for calibration errors with z-DCA to beam axis versus z-coord. of first hit on track.
5. StEMB globtrk: z-DCA to Beam Axis vs z-first: Not useful for p-p. Scatter plot of the z-coordinate of the first fitted hit in the TPC versus the z-coordinate (from -25 to 25 cm) of the DCA points to the nominal beam line (z-axis, x=y=0) for all TPC-only global in which the first point used in the fit lies in the TPC. Vertical bands should be seen corresponding to individual events. The bands should be smooth and continuous; breaks at z=0 indicate TPC calibration errors in either the t0 offset or the drift speed. This is best seen for high multiplicity events.
6. StEMB globtrk: z-DCA to Beam Axis vs psi: Not useful for p-p. Scatter plot of the azimuthal direction angle (psi) versus the z-coordinate (from -25 to 25 cm) of the DCA points to the nominal beam line (z-axis, x=y=0) for all TPC global tracks. Vertical bands should be seen corresponding to individual events. The bands should be smooth, straight and continuous indicating azimuthal symmetry in the tracking. Bends or offsets could indicate problems in individual TPC sectors such as voltage sags or drifts. These are best studied with high multiplicity events.
Page 8
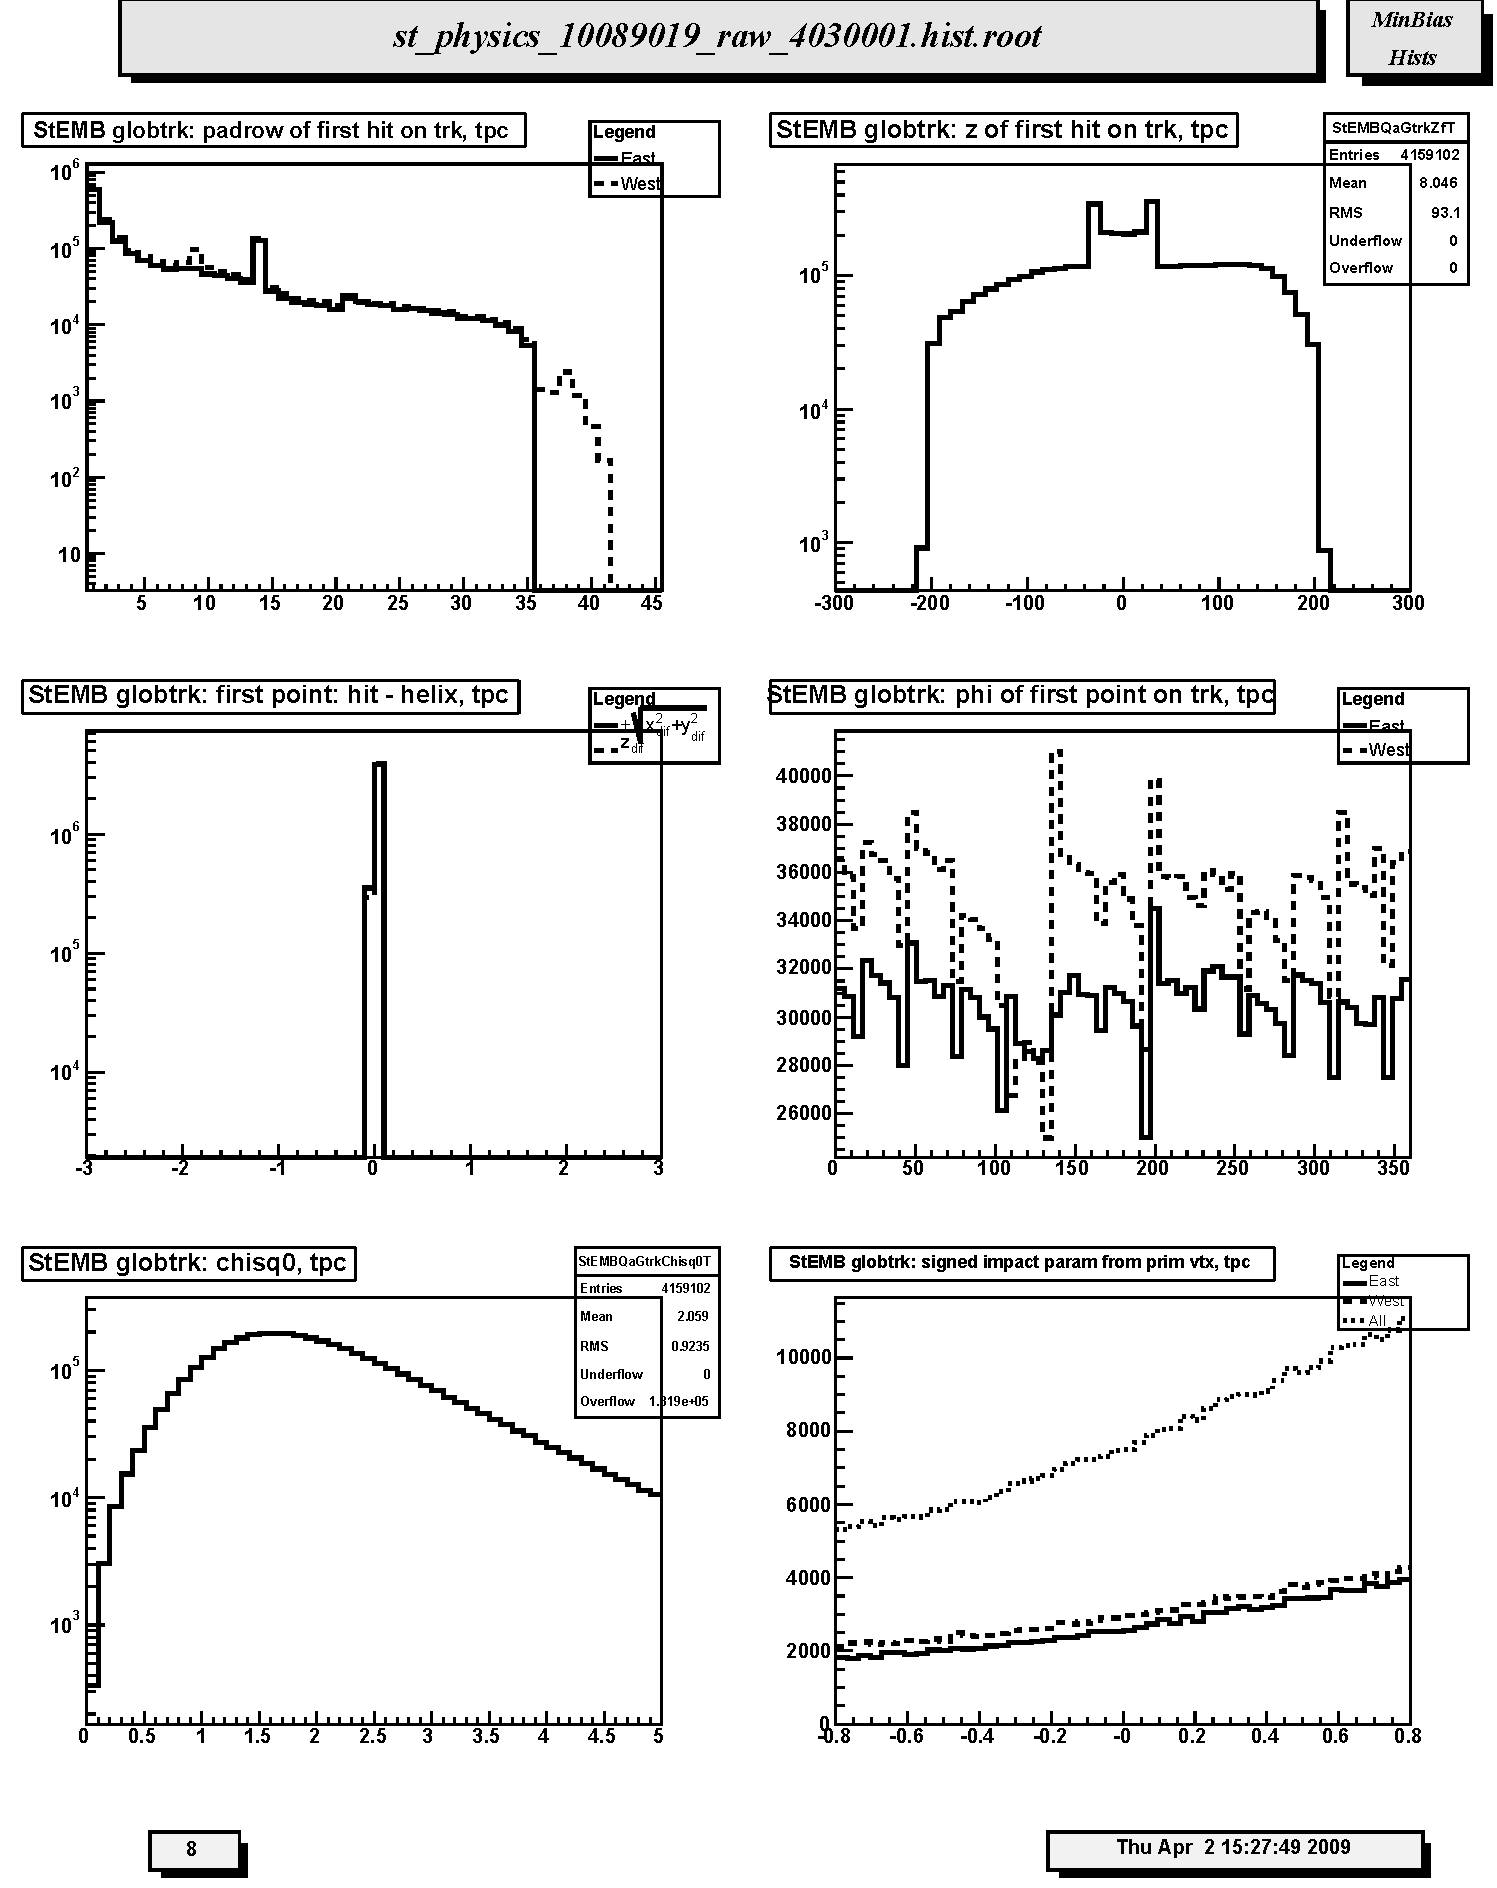
1. StEMB globtrk: padrow of first hit on trk, tpc: Distribution of first fitted space point with respect to pad row number for TPC-only global tracks. Should peak at 1 with a minor peak at padrow 14 (beginning of outer sector); the latter should not be too big relative to that at row 1. Other peaks may indicate large, missing sections of the TPC read-out causing breaks, and consequently additional, false new starting points for tracks. The excess data for TPC west beyond padrow 35 is due to EEMC tracking needs.
2. StEMB globtrk: z of first hit on trk, tpc: Distribution of first fitted space point with respect to z for TPC-only global tracks. Should be approx. symmetric. The spikes and broad peak near z=0 are due to including post-trigger pileup collisions.
3. StEMB globtrk: first point: hit - helix, tpc: Residuals at FIRST point on track for TPC-only global tracks. The quantities plotted are the longitudinal (along z-axis, dashed line) and transverse (in x-y plane, solid line) differences between the coordinates of the first hit and the DCA point on the helix fit to the first point. For the transverse residual, positive (negative) values correspond to hits inside (outside) the circular projection of the helix onto the bend plane. FWHM should be less than ~ 1cm.
4. StEMB globtrk: phi of first point on trk, tpc: Distribution of first fitted space point with respect to azimuthal angle (phi) for TPC-only global tracks. The solid (dashed) line is for the east (west) half of the TPC. These should be approximately equal and flat within statistics, except for the 12-sector structure.
5. StEMB globtrk: chisq0, tpc: Chi-square per degree of freedom for TPC global tracks. Should peak just below 1.
6. StEMB globtrk: signed impact param from prim vtx, tpc: Two-dimensional (2D) (in the transverse plane) signed impact parameter (in cm) from primary vertex for East (solid line), West (dashed line) and All (dotted line) TPC-only global tracks. Should be centered at zero.
Page 9
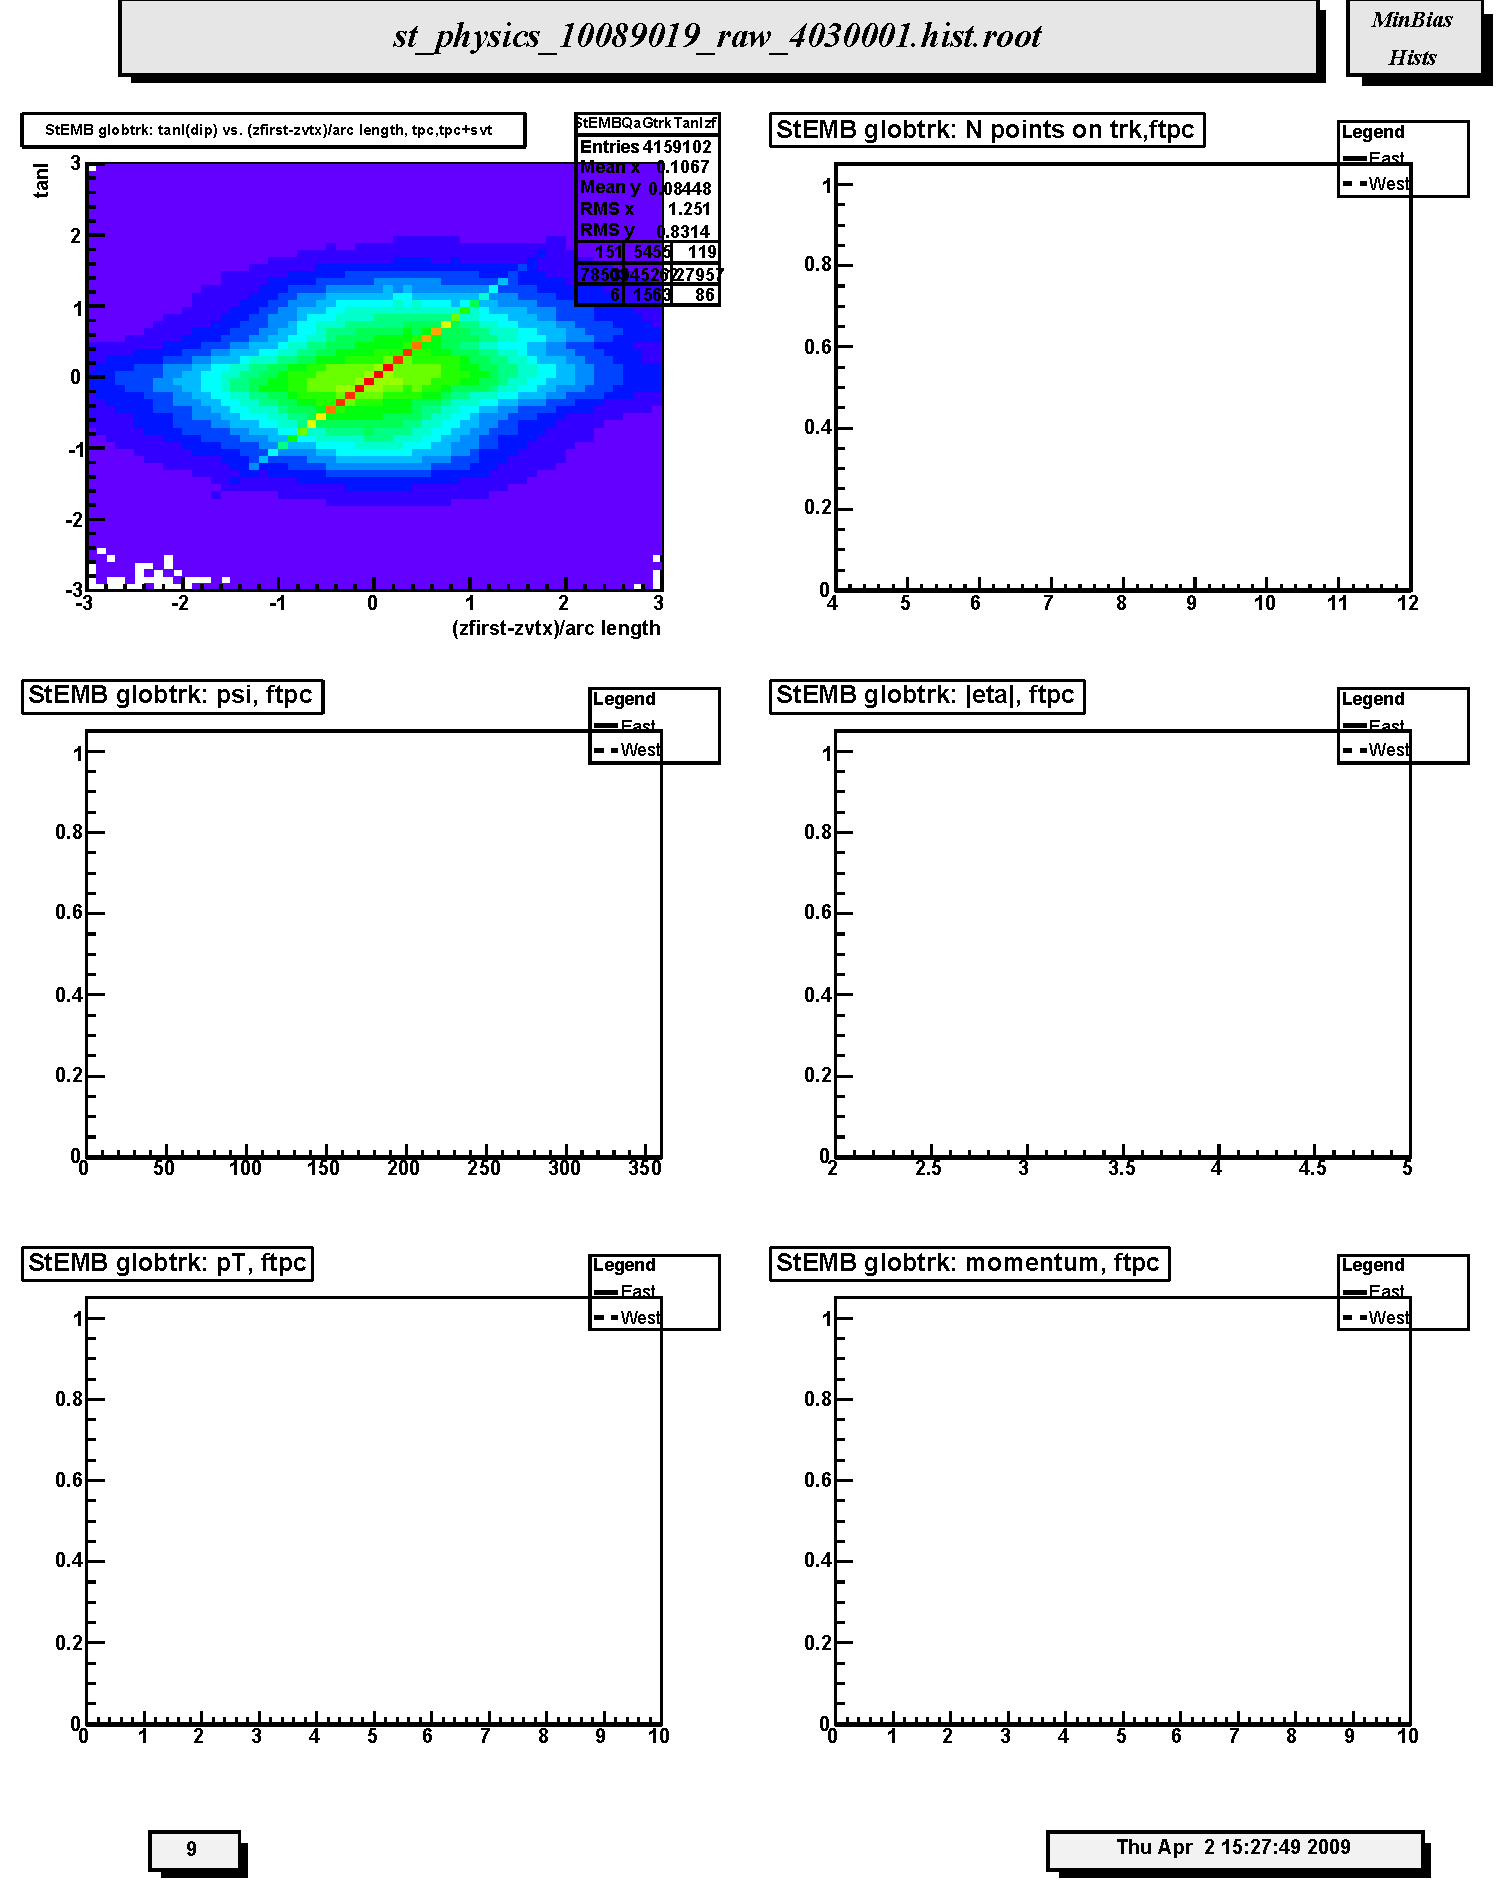
1. StEMB globtrk: tanl(dip) vs. (zfirst-zvtx)/arc length, tpc,tpc+svt: Scatter plot of tangent of dip angle (tanl) versus (z_first - z_primvrtx)/arc-length for TPC-only global tracks whose first fitted point is in the TPC. Variable 'z_first' is the z coordinate of the first fitted point in the TPC. Variable 'z_primvrtx' is the z-coordinate of the primary vertex for the event. Variable 'arc-length' is 2R*arcsin(delta_r/2R) where R = track radius of curvature and delta_r is the transverse distance between the primary vertex and the first hit on track. Primary tracks lie along the 45 deg diagonal. Secondary tracks and strays lie scattered to either side. The diagonal band should appear clearly and be straight and smooth without kinks, breaks or bends.
2. StEMB globtrk: N points on trk,ftpc: Not filled in Run 9. Distribution of the number of fitted points on track for FTPC-East (solid line) and FTPC-West (dashed line) global tracks. Distributions should be similar except fewer tracks for west than east. Also depends on the relative fraction of active readout in each detector.
3. StEMB globtrk: psi, ftpc: Not filled in Run 9. Azimuthal distributions for track direction angle (psi) for FTPC-East (solid line) and FTPC-West (dashed line) global tracks. These should be flat within statistics except for the hexagonal FTPC sector structure. There will be fewer west tracks than east for d+Au.
4. StEMB globtrk: |eta|, ftpc: Not filled in Run 9. Distributions of absolute value of pseudorapidity for FTPC-East (solid line) and FTPC-West (dashed line) global tracks. These should be similar (modulo for d+Au) and range from about 2.5 to 4.5.
5. StEMB globtrk: pT, ftpc: Not filled in Run 9. Transverse momentum (GeV/c) distributions for FTPC-East (solid line) and FTPC-West (dashed line) global tracks. These should be similar (modulo d+Au)within statistics.
6. StEMB globtrk: momentum, ftpc: Not filled in Run 9. Total momentum (GeV/c) distributions for FTPC-East (solid line) and FTPC-West (dashed line) global tracks. These should be similar (modulo d+Au) within statistics.
Page 10
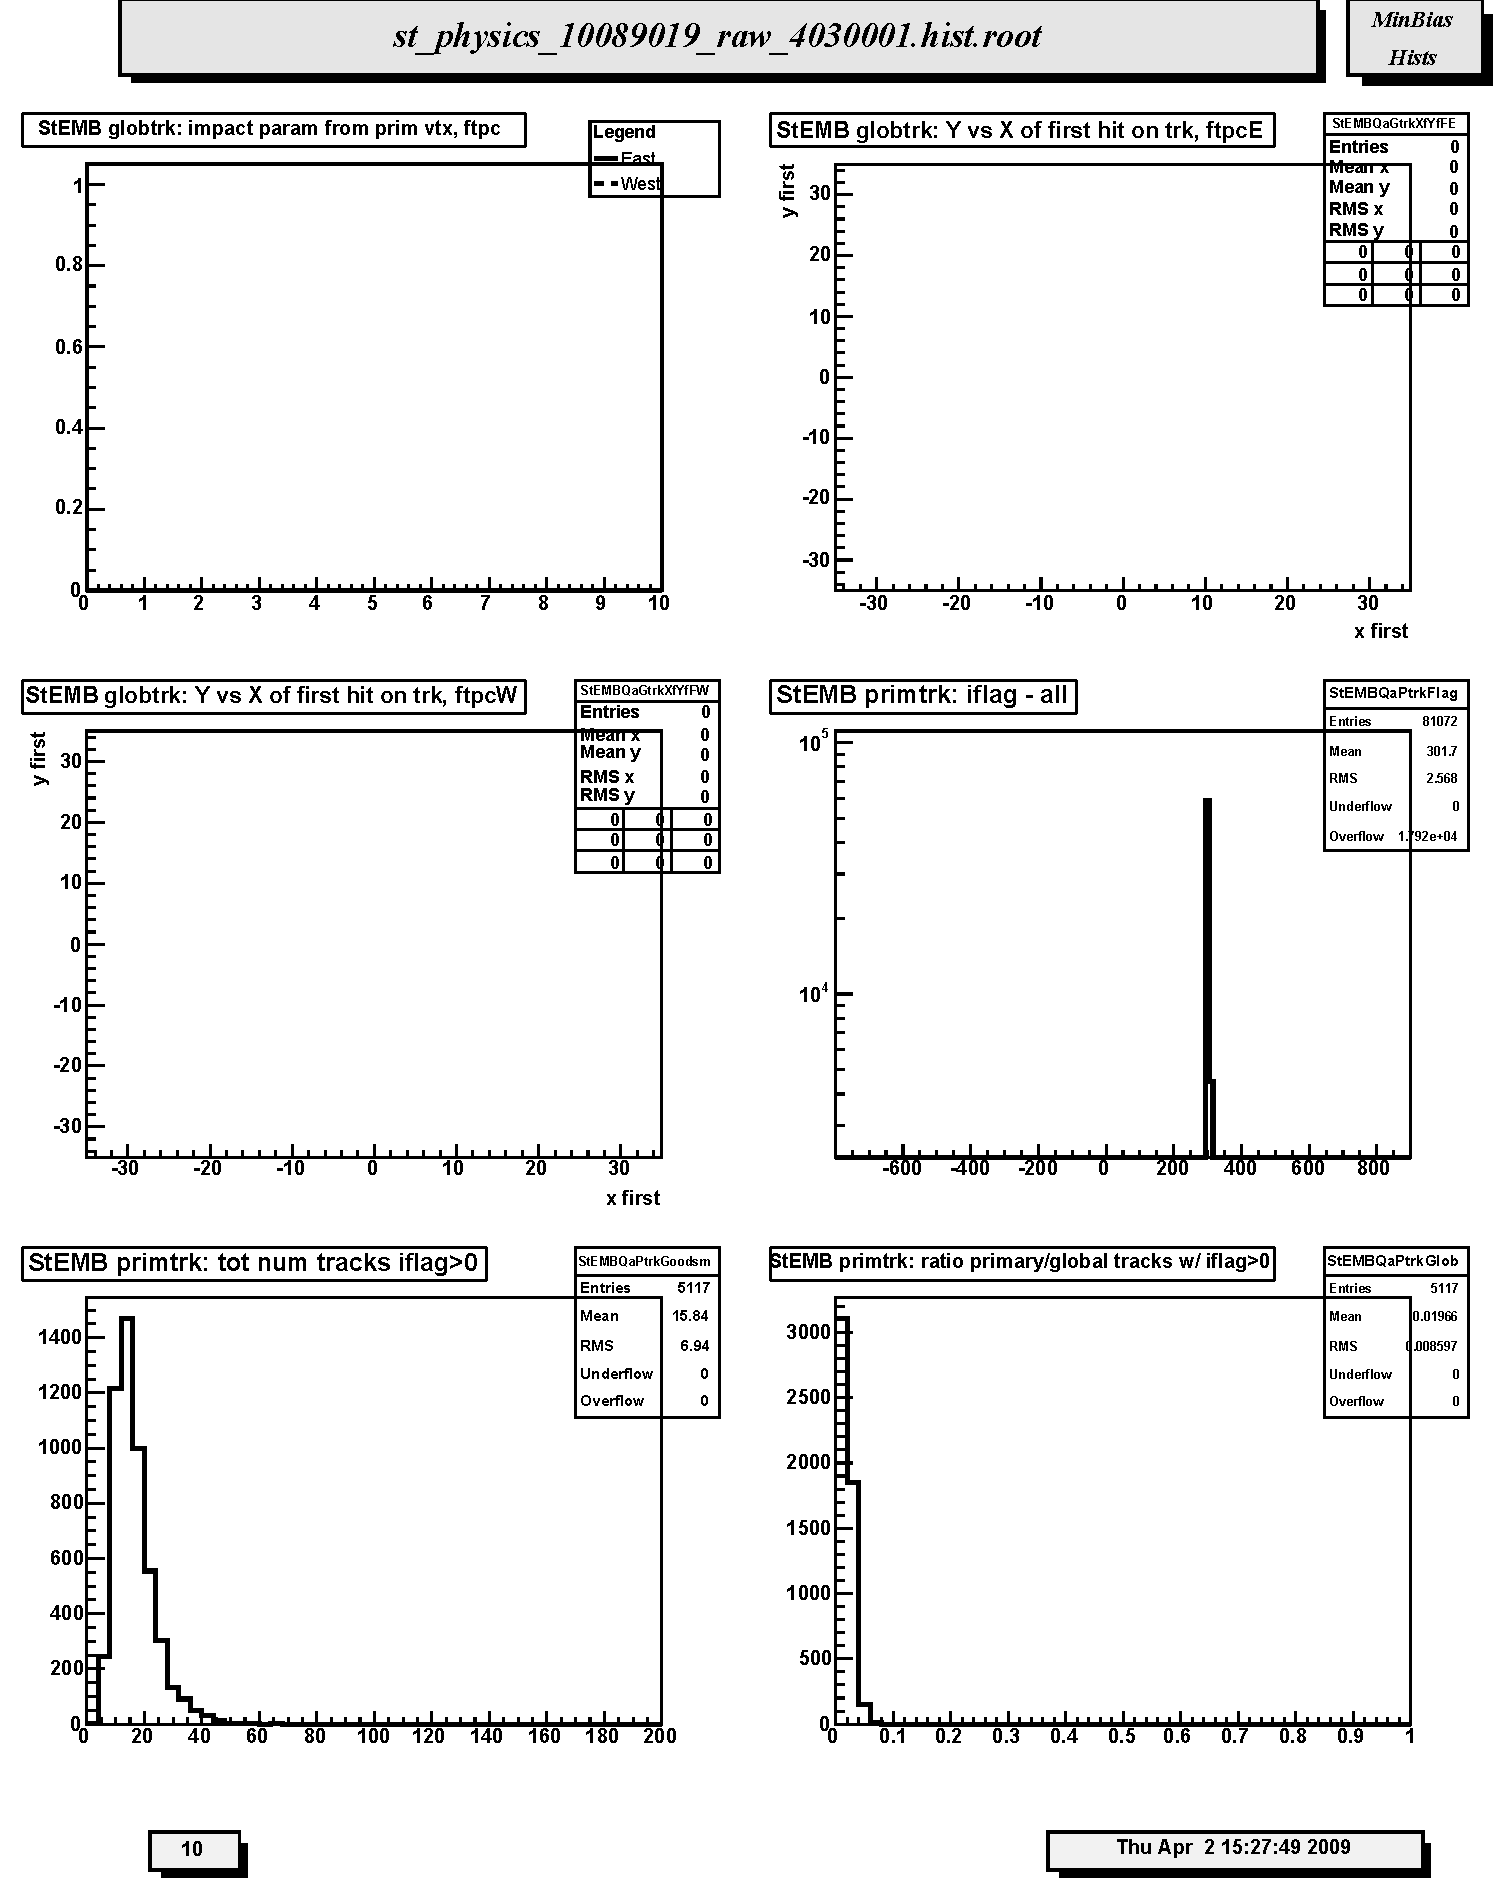
1. StEMB globtrk: impact param from prim vtx, ftpc: Not filled in Run 9. Distribution of impact parameter values for global FTPC East tracks (solid curve) and West tracks (dashed curve) with respect to the main TPC global track determined primary vertex.
2. StEMB globtrk: Y vs X of first hit on trk, ftpcE: Not filled in Run 9. Scatter plot of (x,y) coordinates for the first fitted space points in FTPC-East global tracks. These should be uniformly populated with hits; FTPC hexagonal structure is apparent.
3. StEMB globtrk: Y vs X of first hit on trk, ftpcW: Not filled in Run 9. Scatter plot of (x,y) coordinates for the first fitted space points in FTPC-West global tracks. These should be uniformly populated with hits; FTPC hexagonal structure is apparent.
4. StEMB primtrk: iflag - all: Quality flag values for all primary tracks. Some with large, negative values may not appear on plot; check stat. box for underflows. Majority of tracks should have iflag>0, corresponding to good, usable tracks. Refer to: dst_track_flags.html and kalerr.html for description of flag values.
5. StEMB primtrk: tot num tracks iflag>0: Distribution of total number of primary tracks per triggered event.
6. StEMB primtrk: ratio primary/global tracks w/ iflag>0: Ratio of good primary to good global tracks for all detectors. For p-p in Run 9 this ratio is very small due to the large pile-up contribution to the global track population.
Page 11
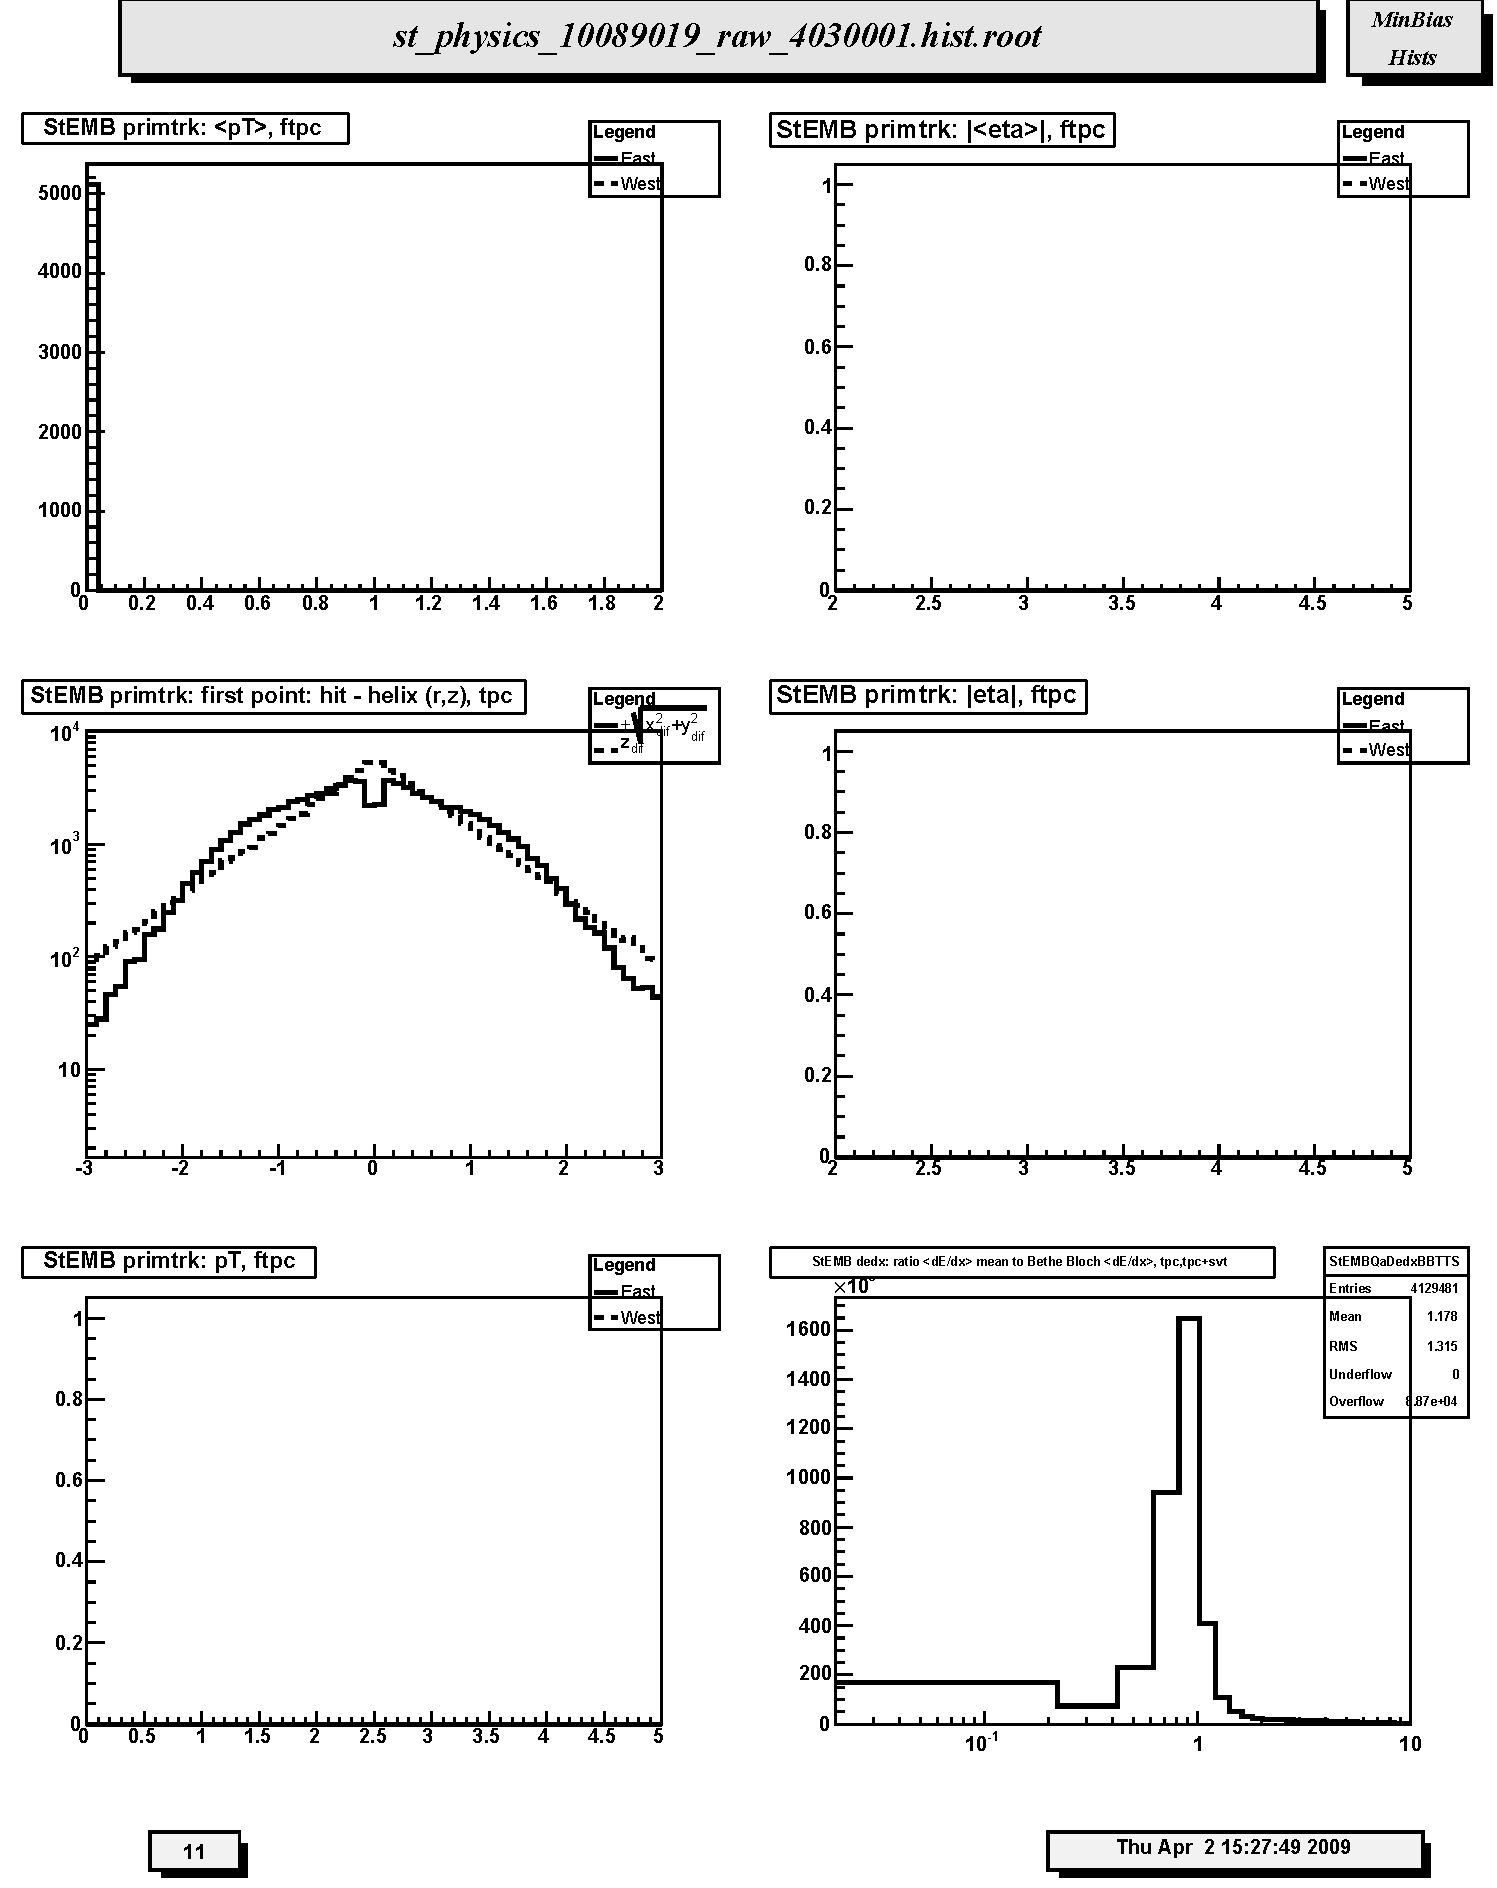
1. StEMB primtrk:, ftpc: Not filled in Run 9. Transverse momentum (GeV/c) distributions for FTPC-East (solid line) and FTPC-West (dashed line) primary tracks. These should be similar within statistics.
2. StEMB primtrk: ||, ftpc: Not filled in Run 9. Distributions of absolute value of mean pseudorapidity for FTPC-East (solid line) and FTPC-West (dashed line) primary tracks. These should be similar within statistics and range from about 2.5 to 3.5.
3. StEMB primtrk: first point: hit - helix (r,z), tpc: Residuals at first point on track for TPC-only primary tracks. The quantities plotted are the longitudinal (along z-axis, dashed line) and transverse (in x-y plane, solid line) differences between the coordinates of the first hit and the DCA point on the helix fit to the first point. For the transverse residual, positive (negative) values correspond to hits inside (outside) the circular projection of the helix onto the bend plane. FWHM should be less than ~ 1cm.
4. StEMB primtrk: |eta|, ftpc: Not filled in Run 9. Distributions of absolute value of mean pseudorapidity for FTPC-East (solid line) and FTPC-West (dashed line) primary tracks. These should be similar within statistics and range from about 2.5 to 3.5.
5. StEMB primtrk: pT, ftpc: Not filled in Run 9. Transverse momentum (GeV/c) distributions for FTPC-East (solid line) and FTPC-West (dashed line) primary tracks. These should be similar within statistics.
6. StEMB dedx: ratio Distribution of ratio of mean dE/dx to Bethe-Bloch dE/dx for pions at the same momentum for TPC-only global tracks. Should peak at ~1. Tests calibration of charge deposition in TPC gas.
Page 12
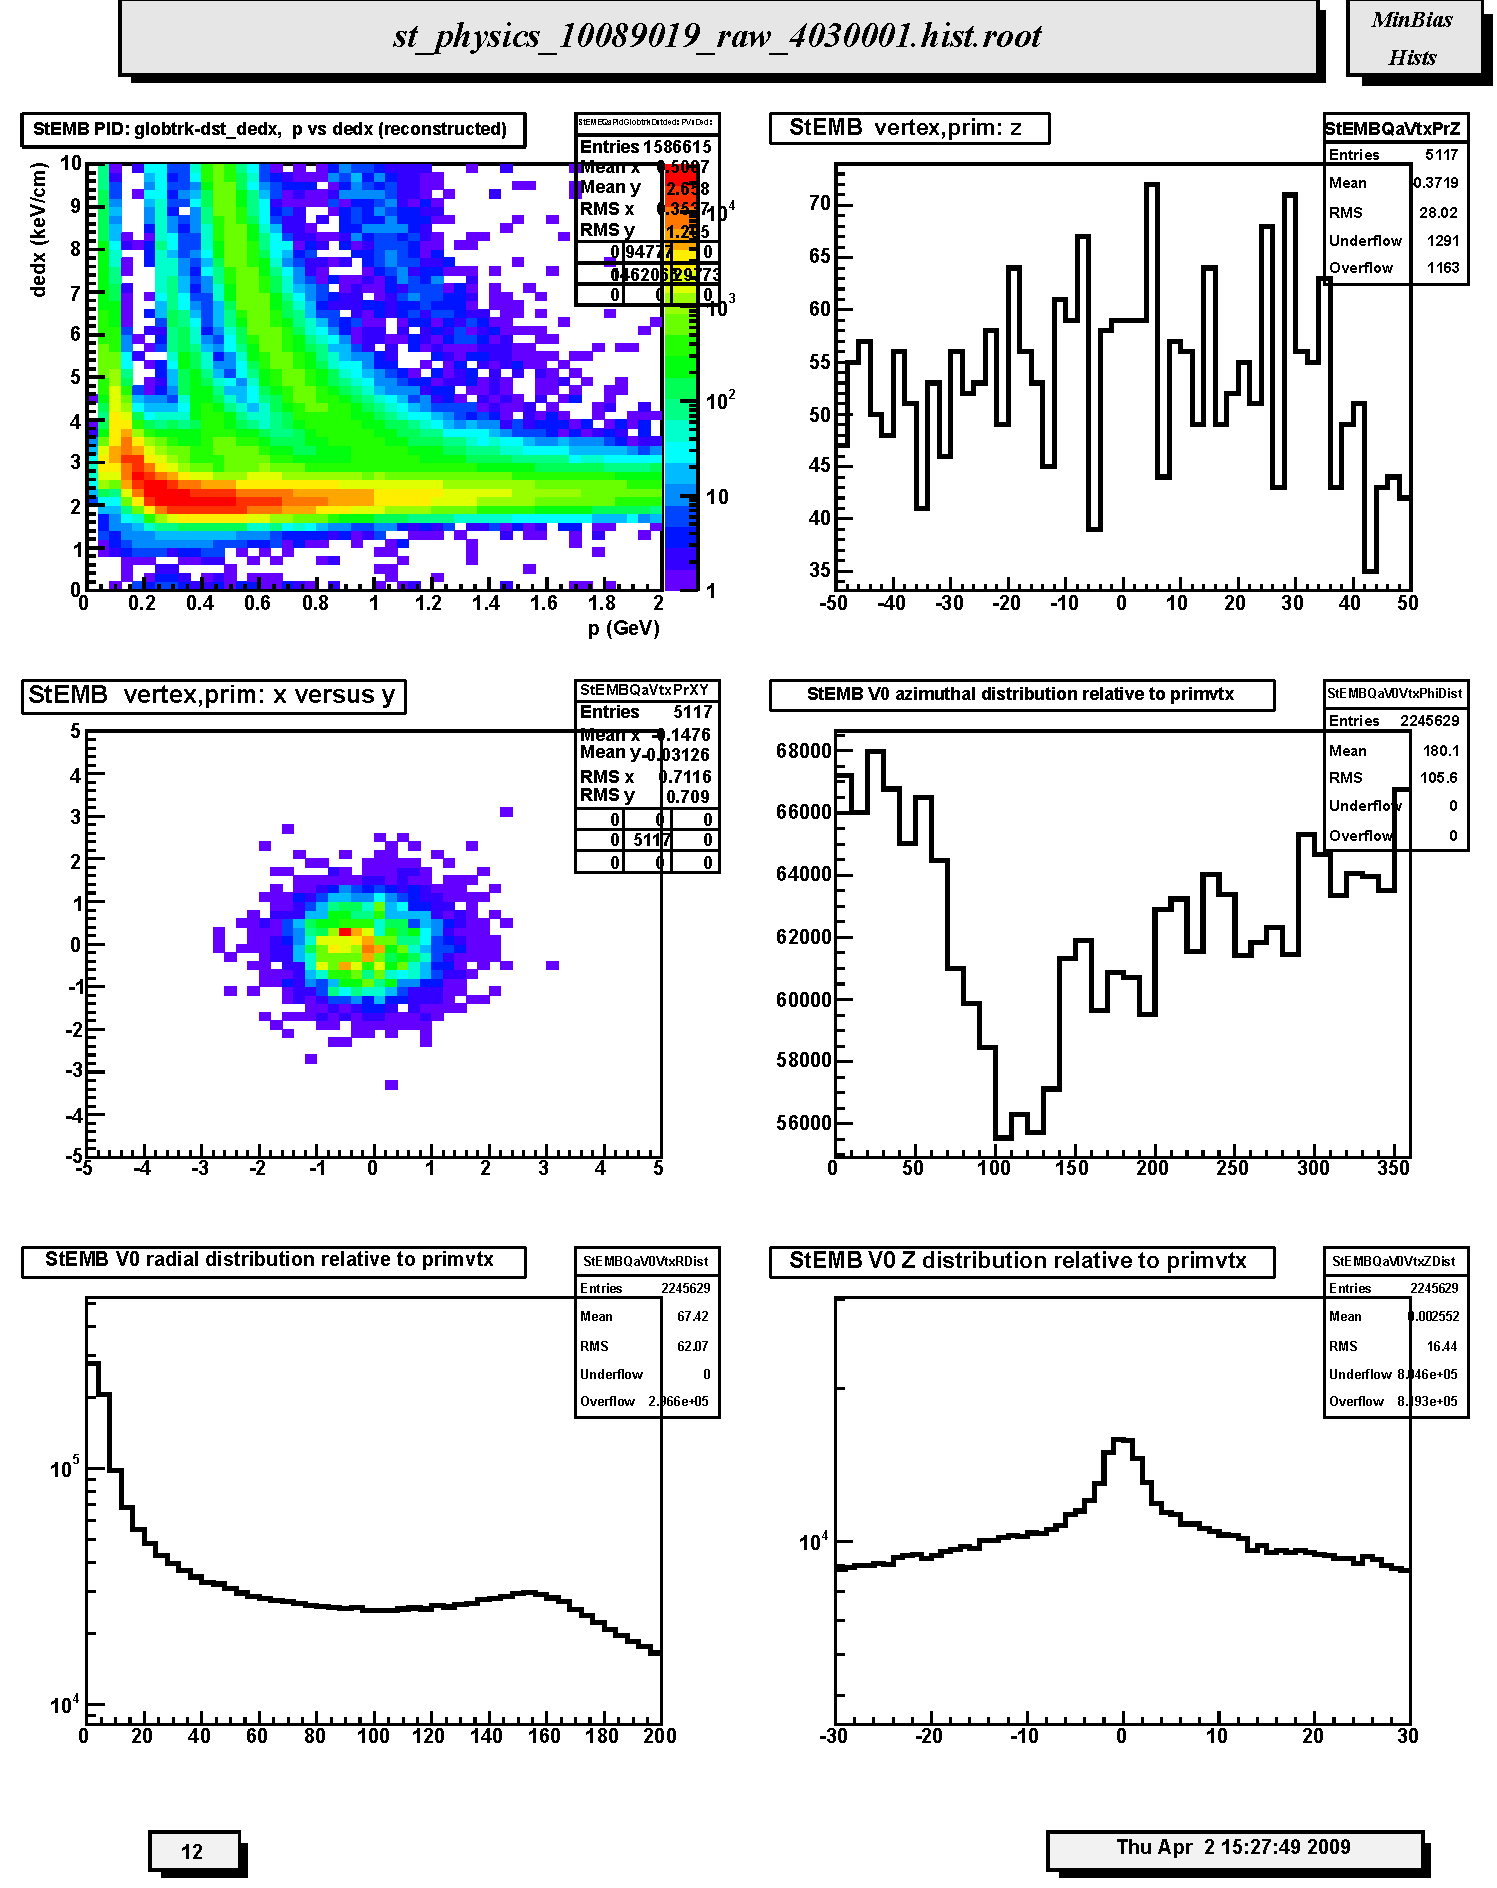
1. StEMB PID: globtrk-dst_dedx, p vs dedx (reconstructed): Scatter plot of truncated mean dE/dx versus total momentum (GeV/c) for TPC-only global tracks. Should be able to see Bethe-Bloch bands for pions, kaons and protons if statistics are sufficient.
2. StEMB vertex,prim: z : Distribution of primary vertex position along the z-axis out to abs(z) < 50 cm.
3. StEMB vertex,prim: x versus y: Scatter plot of the (x,y) coordinates of the primary vertex position. This should correspond to the determined beam transverse position. The amount of dispersion will depend on the trigger condition and multiplicity cuts and is large for p-p.
4. StEMB V0 azimuthal distribution relative to primvtx: Azimuthal distribution of V0 vertices relative to the primary vertex for each event. Should be flat within statistics.
5. StEMB V0 radial distribution relative to primvtx: Radial distribution of V0 vertices relative to the primary vertex for each event. Should fall off steeply with most vertices within ~10 cm.
6. StEMB V0 Z distribution relative to primvtx: Longitudinal (z) distribution of V0 vertices relative to the primary vertex for each event. Should fall off steeply with most vertices within ~10 cm.
Page 13
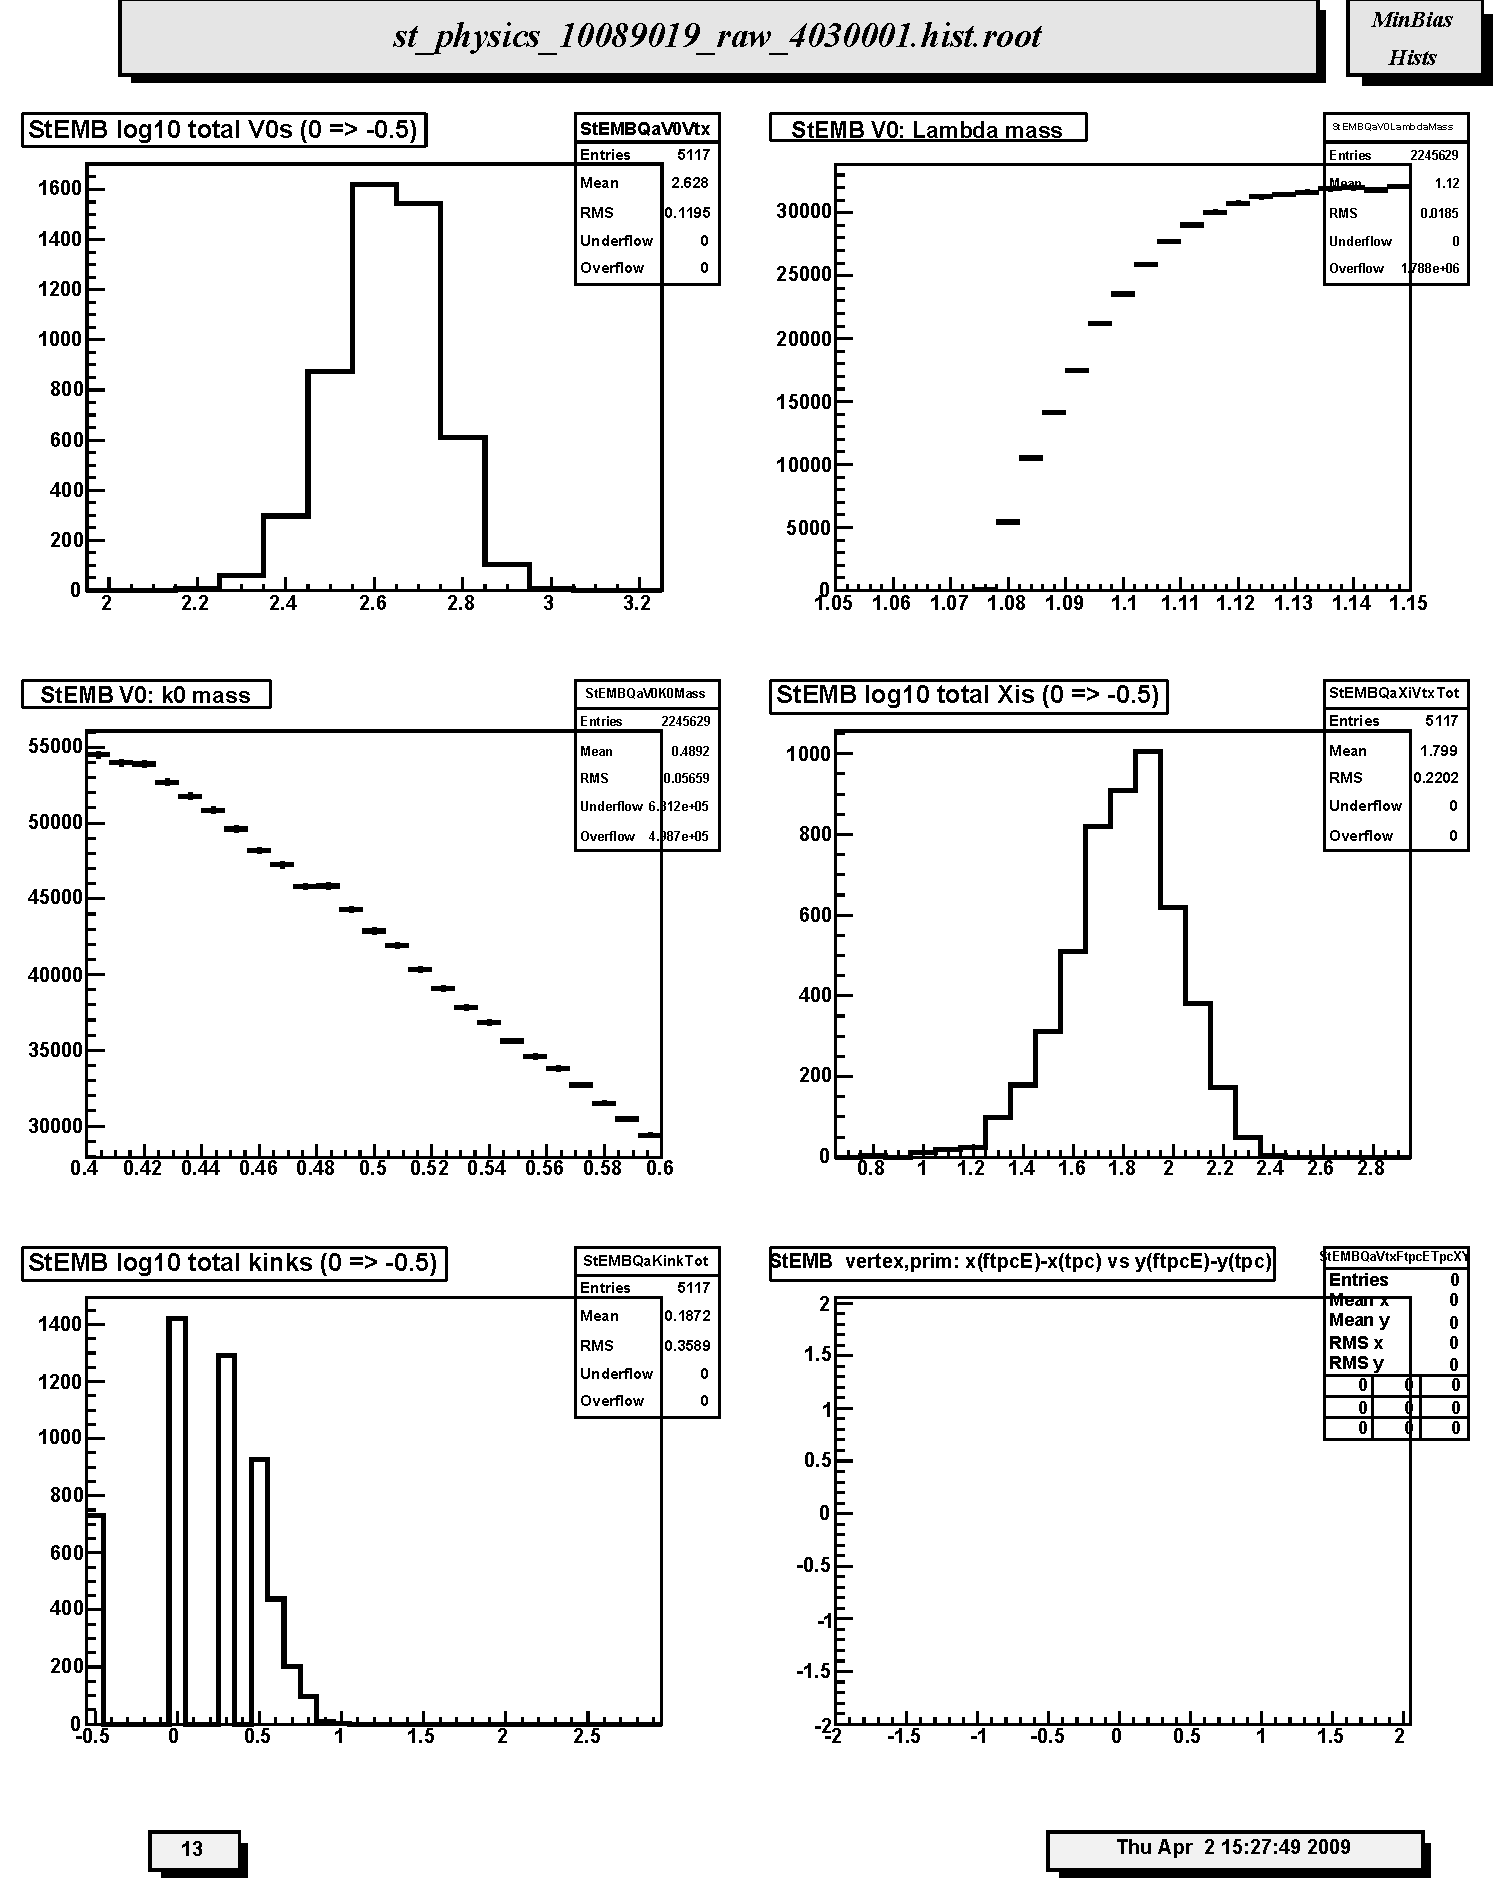
1. StEMB log10 total V0s (0 => -0.5): Log10 plot of the distribution of the number of V0 candidates found.
2. StEMB V0: Lambda mass:
3. StEMB V0: k0 mass:
4. StEMB log10 total Xis (0 => -0.5): Log10 plot of the distribution of the number of Xi (cascade) candidates found.
5. StEMB log10 total kinks (0 => -0.5): Log10 plot of the distribution of the number of track kink (single charge decay) candidates found.
6. StEMB vertex,prim: x(ftpcE)-x(tpc) vs y(ftpcE)-y(tpc): Not filled in Run 9. Scatter plot of the differences in x-y position (cm) for primary vertex positions determined by FTPC East global tracks and main TPC glbtrks. Should scatter about (0,0).
Page 14
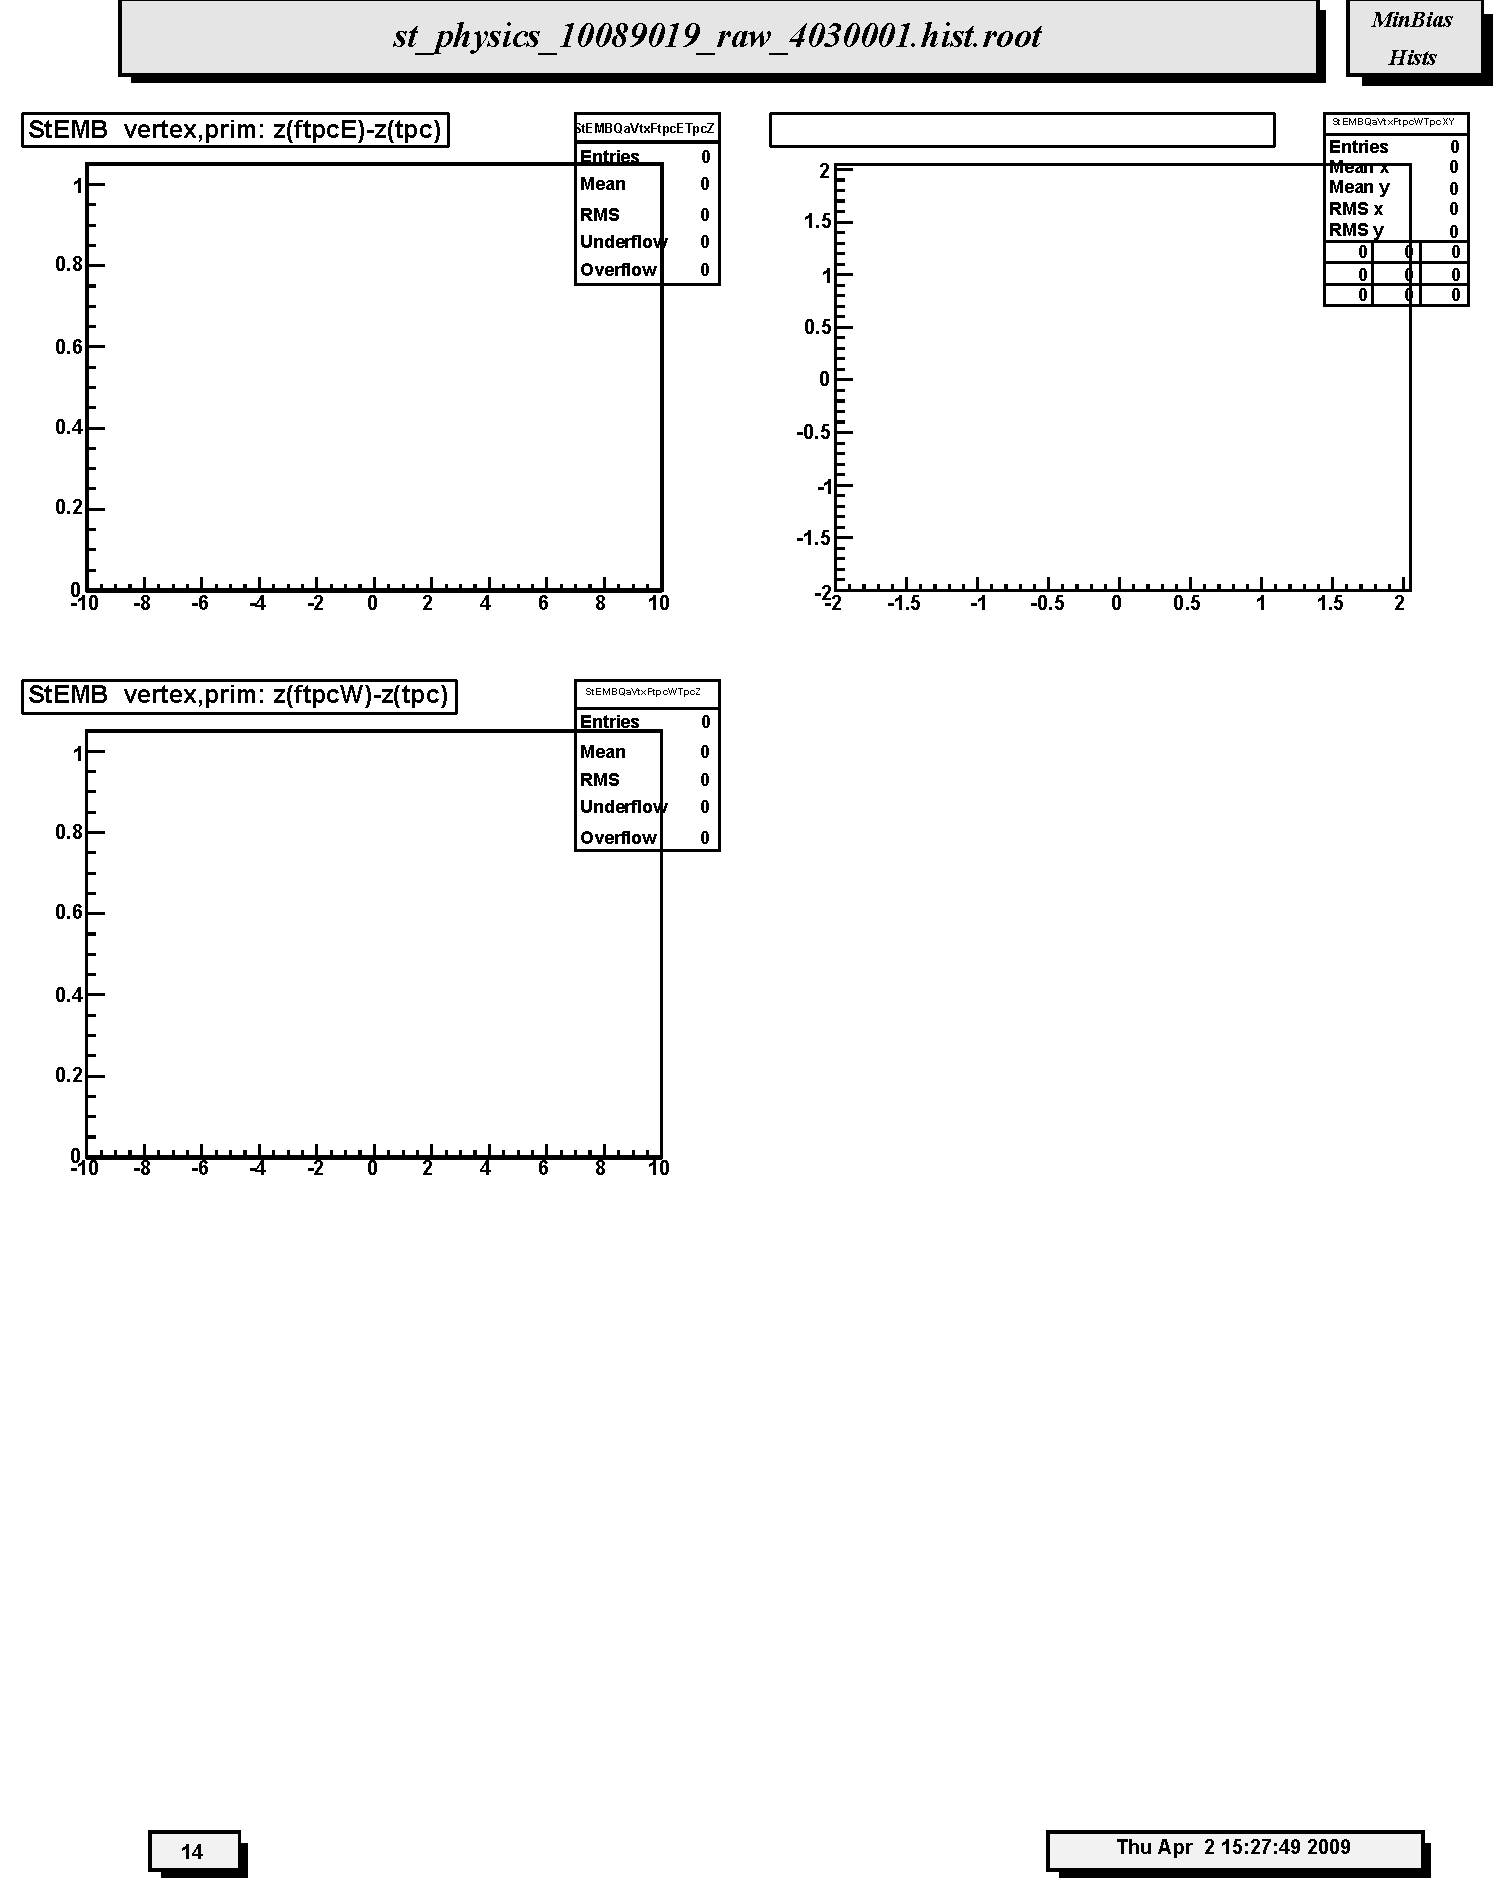
1. StEMB vertex,prim: z(ftpcE)-z(tpc): Not filled in Run 9. Distribution of the differences along the z-axis, i.e. beam direction, in cm for primary vertex positions determined by FTPC East global tracks and main TPC glbtrks. The mean should be near 0.
2. StEMB vertex,prim: x(ftpcW)-x(tpc) vs y(ftpcW)-y(tpc): Not filled in Run 9. Scatter plot of the differences in x-y position (cm) for primary vertex positions determined by FTPC West global tracks and main TPC glbtrks. Should scatter about (0,0).
3. StEMB vertex,prim: z(ftpcW)-z(tpc): Not filled in Run 9. Distribution of the differences along the z-axis, i.e. beam direction, in cm for primary vertex positions determined by FTPC West global tracks and main TPC glbtrks. The mean should be near 0.
Fast Offline QA Shift Report Preparation and Instructions for Run 8
Purpose of Form:
The main purpose of the shift report form is to guide the shift crew through the principal tasks which must be performed during the offline QA shifts. The QA team has made every effort to keep this form simple and compact. In Runs 3 - 7 we used a simplified form which we are again using for Run 8. The form again uses the special dialog box for reporting summaries of the Fast Offline QA which will be sent directly to the Shift Crew leaders and Period Coordinator for the appropriate run period. The emphasis of the reports should be on substantive, detailed comments. Comments should be succinct, but lucid enough so that anyone reading the report can understand the reason(s) for marking the job as suspect. The compactness of the report form does not however diminish the responsibility of each shift crew member to carefully scrutinize all the available information about each production job and to write a clear, verbal description of suspected problems.
Fast Offline QA reports are directed to the Shift Leaders and Period Coordinator for the appropriate shift-week. The summaries should emphasize only what changes day-to-day in the hardware, calibration and/or reconstruction software performance. Ongoing, persistent hardware/software problems should be reported for all runs where these issues occur for the archival record. The copy feature of the Shift Report Form is helpful for such reporting. Note that the QA Issues mechanism tracks day-to-day changes in reported problems and automatically notifies the shift leaders of those changes via starqa hypernews.
Web Based QA Shift Report Form:
An Offline QA Web based report form is provided. The fields are described on the form and should be self explanatory. Upon completion of this form an ASCII text version is automatically generated and emailed to 'starqa-hn' for distribution and archived as a permanent record. If the web page is unavailable an ASCII text template is also available (see year 2002 QA shift report instructions page). The QA reports are automatically linked to the Online Run Log for that run ID number.
Please follow the instructions in the top panel and elsewhere on the report web forms. Please complete all information on the forms.
If problems are suspected you must contact by email and telephone, if necessary, the appropriate "QA Experts" or "Other Experts". Enter the names of the people and/or mailing lists which were notified in the final section of the report form.
webmaster Last modified: Jan. 11, 2008
Fast Offline QA Shift Report Preparation and Instructions for Run 9
Purpose of Form:
The main purpose of the shift report form is to guide the shift crew through the principal tasks which must be performed during the offline QA shifts. The QA team has made every effort to keep this form simple and compact. In Runs 3 - 8 we used a simplified form which we are again using for Run 9. The form again uses the special dialog box for reporting summaries of the Fast Offline QA which will be sent directly to the Shift Crew leaders and Period Coordinator for the appropriate run period. The emphasis of the reports should be on substantive, detailed comments. Comments should be succinct, but lucid enough so that anyone reading the report can understand the reason(s) for marking the job as suspect. The compactness of the report form does not however diminish the responsibility of each shift crew member to carefully scrutinize all the available information about each production job and to write a clear, verbal description of suspected problems.
Fast Offline QA reports are directed to the Shift Leaders and Period Coordinator for the appropriate shift-week. The summaries should emphasize only what changes day-to-day in the hardware, calibration and/or reconstruction software performance. Ongoing, persistent hardware/software problems should be reported for all runs where these issues occur for the archival record. The copy feature of the Shift Report Form is helpful for such reporting. Note that the QA Issues mechanism tracks day-to-day changes in reported problems and automatically notifies the shift leaders of those changes via starqa hypernews.
Web Based QA Shift Report Form:
An Offline QA Web based report form is provided. The fields are described on the form and should be self explanatory. Upon completion of this form an ASCII text version is automatically generated and emailed to 'starqa-hn' for distribution and archived as a permanent record. If the web page is unavailable an ASCII text template is also available (see year 2002 QA shift report instructions page). The QA reports are automatically linked to the Online Run Log for that run ID number.
Please follow the instructions in the top panel and elsewhere on the report web forms. Please complete all information on the forms.
If problems are suspected you must contact by email and telephone, if necessary, the appropriate STAR QA links and contacts or Other Expert contacts and links. Enter the names of the people and/or mailing lists which were notified in the final section of the report form.
webmaster
Last modified: Feb. 18, 2009
Fast Offline QA Shift Report Preparation and Instructions for Run 10
Purpose of Form:
The main purpose of the shift report form is to guide the shift crew through the principal tasks which must be performed during the offline QA shifts. The QA team has made every effort to keep this form simple and compact. In Runs 3 - 9 we used a simplified form which we are again using for Run 10. The form again uses the special dialog box for reporting summaries of the Fast Offline QA which will be sent directly to the Shift Crew leaders and Period Coordinator for the appropriate run period. The emphasis of the reports should be on substantive, detailed comments. Comments should be succinct, but lucid enough so that anyone reading the report can understand the reason(s) for marking the job as suspect. The compactness of the report form does not however diminish the responsibility of each shift crew member to carefully scrutinize all the available information about each production job and to write a clear, verbal description of suspected problems.
Fast Offline QA reports are directed to the Shift Leaders and Period Coordinator for the appropriate shift-week. The summaries should emphasize only what changes day-to-day in the hardware, calibration and/or reconstruction software performance. Ongoing, persistent hardware/software problems should be reported for all runs where these issues occur for the archival record. The copy feature of the Shift Report Form is helpful for such reporting. Note that the QA Issues mechanism tracks day-to-day changes in reported problems and automatically notifies the shift leaders of those changes via starqa hypernews.
Web Based QA Shift Report Form:
An Offline QA Web based report form is provided. The fields are described on the form and should be self explanatory. Upon completion of this form an ASCII text version is automatically generated and emailed to 'starqa-hn' for distribution and archived as a permanent record. If the web page is unavailable an ASCII text template is also available (see year 2002 QA shift report instructions page). The QA reports are automatically linked to the Online Run Log for that run ID number.
Please follow the instructions in the top panel and elsewhere on the report web forms. Please complete all information on the forms.
If problems are suspected you must contact by email and telephone, if necessary, the appropriate STAR QA links and contacts or Other Expert contacts and links. Enter the names of the people and/or mailing lists which were notified in the final section of the report form.
Fast Offline QA Shift Report Preparation and Instructions for Run 11
Purpose of Form:
The main purpose of the shift report form is to guide the shift crew through the principal tasks which must be performed during the offline QA shifts. The QA team has made every effort to keep this form simple and compact. In Runs 3 - 10 we used a simplified form which we are again using for Run 11. The form again uses the special dialog box for reporting summaries of the Fast Offline QA which will be sent directly to the Shift Crew leaders and Period Coordinator for the appropriate run period. The emphasis of the reports should be on substantive, detailed comments. Comments should be succinct, but lucid enough so that anyone reading the report can understand the reason(s) for marking the job as suspect. The compactness of the report form does not however diminish the responsibility of each shift crew member to carefully scrutinize all the available information about each production job and to write a clear, verbal description of suspected problems.
Fast Offline QA reports are directed to the Shift Leaders and Period Coordinator for the appropriate shift-week. The summaries should emphasize only what changes day-to-day in the hardware, calibration and/or reconstruction software performance. Ongoing, persistent hardware/software problems should be reported for all runs where these issues occur for the archival record. The copy feature of the Shift Report Form is helpful for such reporting. Note that the QA Issues mechanism tracks day-to-day changes in reported problems and automatically notifies the shift leaders of those changes via starqa hypernews.
Web Based QA Shift Report Form:
An Offline QA Web based report form is provided. The fields are described on the form and should be self explanatory. Upon completion of this form an ASCII text version is automatically generated and emailed to 'starqa-hn' for distribution and archived as a permanent record. If the web page is unavailable an ASCII text template is also available (see year 2002 QA shift report instructions page). The QA reports are automatically linked to the Online Run Log for that run ID number.
Please follow the instructions in the top panel and elsewhere on the report web forms. Please complete all information on the forms.
If problems are suspected you must contact by email and telephone, if necessary, the appropriate QA Experts or Other Experts. Enter the names of the people and/or mailing lists which were notified in the final section of the report form.
Fast Offline QA Shift Report Preparation and Instructions for Run 12
Purpose of Form:
The main purpose of the shift report form is to guide the shift crew through the principal tasks which must be performed during the offline QA shifts. The QA team has made every effort to keep this form simple and compact. In Runs 3 - 11 we used a simplified form which we are again using for Run 12. The form again uses the special dialog box for reporting summaries of the Fast Offline QA which will be sent directly to the Shift Crew leaders and Period Coordinator for the appropriate run period. The emphasis of the reports should be on substantive, detailed comments. Comments should be succinct, but lucid enough so that anyone reading the report can understand the reason(s) for marking the job as suspect. The compactness of the report form does not however diminish the responsibility of each shift crew member to carefully scrutinize all the available information about each production job and to write a clear, verbal description of suspected problems.
Fast Offline QA reports are directed to the Shift Leaders and Period Coordinator for the appropriate shift-week. The summaries should emphasize only what changes day-to-day in the hardware, calibration and/or reconstruction software performance. Ongoing, persistent hardware/software problems should be reported for all runs where these issues occur for the archival record. The copy feature of the Shift Report Form is helpful for such reporting. Note that the QA Issues mechanism tracks day-to-day changes in reported problems and automatically notifies the shift leaders of those changes via starqa hypernews.
Web Based QA Shift Report Form:
An Offline QA Web based report form is provided. The fields are described on the form and should be self explanatory. Upon completion of this form an ASCII text version is automatically generated and emailed to 'starqa-hn' for distribution and archived as a permanent record. If the web page is unavailable an ASCII text template is also available (see year 2002 QA shift report instructions page). The QA reports are automatically linked to the Online Run Log for that run ID number. Please use the "play" version if you are a first-time user to practice before doing the real thing.
Please follow the instructions in the top panel and elsewhere on the report web forms. Please complete all information on the forms.
If problems are suspected you must contact by email and telephone, if necessary, the appropriate
or
Enter the names of the people and/or mailing lists which were notified in the final section of the report form.
Information for Fast Offline QA Shifts - Run 8
Purpose of Form:
The main purpose of the shift report form is to guide the shift crew through the principal tasks which must be performed during the offline QA shifts. The QA team has made every effort to keep this form simple and compact. In Runs 3 - 7 we used a simplified form which we are again using for Run 8. The form again uses the special dialog box for reporting summaries of the Fast Offline QA which will be sent directly to the Shift Crew leaders and Period Coordinator for the appropriate run period. The emphasis of the reports should be on substantive, detailed comments. Comments should be succinct, but lucid enough so that anyone reading the report can understand the reason(s) for marking the job as suspect. The compactness of the report form does not however diminish the responsibility of each shift crew member to carefully scrutinize all the available information about each production job and to write a clear, verbal description of suspected problems.
Fast Offline QA reports are directed to the Shift Leaders and Period Coordinator for the appropriate shift-week. The summaries should emphasize only what changes day-to-day in the hardware, calibration and/or reconstruction software performance. Ongoing, persistent hardware/software problems should be reported for all runs where these issues occur for the archival record. The copy feature of the Shift Report Form is helpful for such reporting. Note that the QA Issues mechanism tracks day-to-day changes in reported problems and automatically notifies the shift leaders of those changes via starqa hypernews.
Web Based QA Shift Report Form:
An Offline QA Web based report form is provided. The fields are described on the form and should be self explanatory. Upon completion of this form an ASCII text version is automatically generated and emailed to 'starqa-hn' for distribution and archived as a permanent record. If the web page is unavailable an ASCII text template is also available (see year 2002 QA shift report instructions page). The QA reports are automatically linked to the Online Run Log for that run ID number.
Please follow the instructions in the top panel and elsewhere on the report web forms. Please complete all information on the forms.
If problems are suspected you must contact by email and telephone, if necessary, the appropriate "QA Experts" or "Other Experts". Enter the names of the people and/or mailing lists which were notified in the final section of the report form.
Last modified: Jan. 11, 2008
Information for QA Shifts
Information for Fast Offline QA Shifts - Run 9
Welcome to the STAR Fast Offline Quality Assurance and Offline DST Production QA Shift home page. In Run 9 the TPC, SSD, EMC-barrel, EMC-SMD-eta grid, EMC-SMD-phi grid, EMC End Cap, End Cap SMD, FTPC-East, FTPC-West, TOF-MRPCs, BBC, and FPD will be active. The SVT was permanently removed in Run 8. Run 9 is devoted to the 200 GeV polarized p-p spin program. Our job is to monitor the validity of the data, calibrations and event reconstruction from the full experiment for the Fast Offline event reconstruction. From a practical standpoint it is only possible for Offline QA to detect fairly large problems and to monitor only a few percent of the total Fast Offline productions. But even this level of QA is beneficial. In the following I will attempt to answer the most common questions about the shift work. Following this is a link to the relevent pages which you will need to become familiar with prior to your first week on shift in Run 9.
No programming skills, such as C++, are required. All the tasks are web based "point-and-click" activities. However, you should have valid RCF and AFS accounts since you may need direct access to the histogram postscript files or reference QA histograms. Note that there are new login security measures in effect at the RCF.
General knowledge of the STAR detector, reconstruction methods and calibration issues are expected since the purpose of these shifts is to spot problems with the hardware and event reconstruction, or with the calibrations. Expert level knowledge is not required however.
All persons are required to be at BNL for their first week of Offline QA shift service. This is motivated by the fact that many unforeseen problems will very likely arise during these shifts and quick, real time help, which is more likely to be available at BNL, is essential to insure daily shift productivity.
Subsequent Offline QA shifts may be done from non-BNL sites provided adequate web access to the Auto QA system can be demonstrated from the remote site.
The offline QA shift may be done any time throughout the day but it is expected that a serious effort will require at least 8 hours a day.
There are no special QA training schools; the web based documentation is intended to fulfill such needs. But if you have further questions please send email to Lanny Ray, ray@physics.utexas.edu.
The Fast Offline QA shift work involves the following tasks, all of which are web based:
Fetch the latest set of Fast offline production jobs using the Auto QA browser and compare a standard set of histograms to a reference. Due to changing run conditions these reference histograms will not be ready until some reasonable data have been collected in the first week or so of the new run.
Fill in a web based report form listing the jobs which have been QA-ed and giving detailed comments as needed. Summarize observed changes in hardware/software performance for the Fast Offline data and report directly to the three Shift Leaders and Period Coordinator on duty.
New this year - Provide a data/run quality summary based on the Online Run Log information and comments and the QA work.
Notify the appropriate people about suspected problems with the hardware, calibrations, production, or reconstruction software.
Check the Online-to-Offline data base migration using the "Database Migration Monitor" link on the first page of the QA browser after you login. When data are being taken the first several tables should appear in green font. If no data have been acquired for a day or so then all the tables should be in red. If there are any red fonts in the first several tables labelled "RunLog_onl" while data are being taken then this may indicate a problem and you should notify starqa-hn explicitly.
If you are not already subscribed to the 'starqa-hn' and 'starprod-hn' hypernews forums then please do so since this is the principal means for communicating with the production crew. See the HyperNews home page or select "hypernews" from the left panel on the STAR Home page. Follow the instructions for subscribing.
Lanny Ray and Gene van Buren will be available to assist and supervise the shift crew to insure that meaningful QA work is getting done.
Welcome aboard!
Lanny Ray, The University of Texas at Austin
February 18, 2009
STAR QA Documentation
Contacts:
Last modified:
Information for QA Shifts
Information for Fast Offline QA Shifts - Run 10
Welcome to the STAR Fast Offline Quality Assurance and Offline DST Production QA Shift home page. In Run 10 the TPC, EMC-barrel, EMC-SMD-eta grid, EMC-SMD-phi grid, EMC End Cap, End Cap SMD, FTPC-East, FTPC-West, and TOF-MRPCs will be active. Run 10 is devoted to energy dependent scan for Au-Au. Our job is to monitor the validity of the data, calibrations and event reconstruction from the full experiment for the Fast Offline event reconstruction. From a practical standpoint it is only possible for Offline QA to detect fairly large problems and to monitor only a few percent of the total Fast Offline productions. But even this level of QA is beneficial. In the following I will attempt to answer the most common questions about the shift work. Following this is a link to the relevent pages which you will need to become familiar with prior to your first week on shift in Run 10.
-
No programming skills, such as C++, are required. All the tasks are web based "point-and-click" activities. However, you should have valid RCF and AFS accounts since you may need direct access to the histogram postscript files or reference QA histograms. Note that there are new login security measures in effect at the RCF.
-
General knowledge of the STAR detector, reconstruction methods and calibration issues are expected since the purpose of these shifts is to spot problems with the hardware and event reconstruction, or with the calibrations. Expert level knowledge is not required however.
-
All persons are required to be at BNL for their first week of Offline QA shift service. This is motivated by the fact that many unforeseen problems will very likely arise during these shifts and quick, real time help, which is more likely to be available at BNL, is essential to insure daily shift productivity.
-
Subsequent Offline QA shifts may be done from non-BNL sites provided adequate web access to the Auto QA system can be demonstrated from the remote site.
-
The offline QA shift may be done any time throughout the day but it is expected that a serious effort will require at least 8 hours a day.
-
There are no special QA training schools; the web based documentation is intended to fulfill such needs. But if you have further questions please send email to Lanny Ray, ray@physics.utexas.edu.
-
The Fast Offline QA shift work involves the following tasks, all of which are web based:
-
Fetch the latest set of Fast offline production jobs using the Auto QA browser and compare a standard set of histograms to a reference. Due to changing run conditions these reference histograms will not be ready until some reasonable data have been collected in the first week or so of the new run.
-
Fill in a web based report form listing the jobs which have been QA-ed and giving detailed comments as needed. Summarize observed changes in hardware/software performance for the Fast Offline data and report directly to the three Shift Leaders and Period Coordinator on duty.
-
Provide a data/run quality summary based on the Online Run Log information and comments and the QA work.
-
Notify the appropriate people about suspected problems with the hardware, calibrations, production, or reconstruction software.
-
Check the Online-to-Offline data base migration using the "Database Migration Monitor" link on the first page of the QA browser after you login. When data are being taken the first several tables should appear in green font. If no data have been acquired for a day or so then all the tables should be in red. If there are any red fonts in the first several tables labelled "RunLog_onl" while data are being taken then this may indicate a problem and you should notify starqa-hn explicitly.
-
-
If you are not already subscribed to the 'starqa-hn' and 'starprod-hn' hypernews forums then please do so since this is the principal means for communicating with the production crew. See the HyperNews home page or select "hypernews" from the left panel on the STAR Home page. Follow the instructions for subscribing.
-
Lanny Ray and Gene van Buren will be available to assist and supervise the shift crew to insure that meaningful QA work is getting done.
Welcome aboard!
Lanny Ray, The University of Texas at Austin
December 15, 2009
STAR QA Documentation
Contacts:
Information for Fast Offline QA Shifts - Run 11
Welcome to the STAR Fast Offline Quality Assurance and Offline DST Production QA Shift home page. In Run 11 the TPC, EMC-barrel, EMC-SMD-eta grid, EMC-SMD-phi grid, EMC End Cap, End Cap SMD, TOF-MRPCs and FTPCs will be active. Run 11 is devoted to 500 GeV p-p spin and Au-Au 200, some more energy dependent scans and U-U commissioning. Our job is to monitor the validity of the data, calibrations and event reconstruction from the full experiment for the Fast Offline event reconstruction. From a practical standpoint it is only possible for Offline QA to detect fairly large problems and to monitor only a few percent of the total Fast Offline productions. But even this level of QA is beneficial. In the following I will attempt to answer the most common questions about the shift work. Following this is a link to the relevent pages which you will need to become familiar with prior to your first week on shift in Run 11. Please note that additional QA tools are available for testing which will enable all offline data files to be checked using automated algorithms. Information on this is now included in the documentation pages for Run 11. If your shift occurs after the first 2-3 weeks of QA please review these additional instructions.
-
No programming skills, such as C++, are required. All the tasks are web based "point-and-click" activities. However, you should have valid RCF and AFS accounts since you may need direct access to the histogram postscript files or reference QA histograms. Note that there are new login security measures in effect at the RCF.
-
General knowledge of the STAR detector, reconstruction methods and calibration issues are expected since the purpose of these shifts is to spot problems with the hardware and event reconstruction, or with the calibrations. Expert level knowledge is not required however.
-
All persons are required to be at BNL for their first week of Offline QA shift service. This is motivated by the fact that many unforeseen problems will very likely arise during these shifts and quick, real time help, which is more likely to be available at BNL, is essential to insure daily shift productivity.
-
Subsequent Offline QA shifts may be done from non-BNL sites provided adequate web access to the Auto QA system can be demonstrated from the remote site.
-
The offline QA shift may be done any time throughout the day but it is expected that a serious effort will require at least 8 hours a day.
-
There are no special QA training schools; the web based documentation is intended to fulfill such needs. But if you have further questions please send email to Lanny Ray, ray@physics.utexas.edu.
-
The Fast Offline QA shift work involves the following tasks, all of which are web based:
-
Fetch the latest set of Fast offline production jobs using the Auto QA browser and compare a standard set of histograms to a reference. Due to changing run conditions these reference histograms will not be ready until some reasonable data have been collected in the first week or so of the new run. With the new QA tools comparison with reference histograms will be much more transparent than it is has been in the past.
-
Fill in a web based report form listing the jobs which have been QA-ed and giving detailed comments as needed. Summarize observed changes in hardware/software performance for the Fast Offline data and report directly to the three Shift Leaders and Period Coordinator on duty.
-
Provide a data/run quality summary based on the Online Run Log information and comments and the QA work.
-
Notify the appropriate people about suspected problems with the hardware, calibrations, production, or reconstruction software.
-
Check the Online-to-Offline data base migration using the "Database Migration Monitor" link on the first page of the QA browser after you login. When data are being taken the first several tables should appear in green font. If no data have been acquired for a day or so then all the tables should be in red. If there are any red fonts in the first several tables labelled "RunLog_onl" while data are being taken then this may indicate a problem and you should notify starqa-hn explicitly.
-
-
If you are not already subscribed to the 'starqa-hn' and 'starprod-hn' hypernews forums then please do so since this is the principal means for communicating with the production crew. See the HyperNews home page or select "hypernews" from the left panel on the STAR Home page. Follow the instructions for subscribing.
-
Lanny Ray and Gene van Buren will be available to assist and supervise the shift crew to insure that meaningful QA work is getting done.
Welcome aboard!
Lanny Ray, The University of Texas at Austin
February 5, 2011
STAR QA Documentation
Contacts:
Information for Fast Offline QA Shifts - Run 12
Welcome to the STAR Fast Offline Quality Assurance and Offline DST Production QA Shift home page. In Run 12 the TPC, EMC-barrel, EMC-SMD-eta grid, EMC-SMD-phi grid, EMC End Cap, End Cap SMD, TOF-MRPCs and partial GEM and MTD detector subsystems will be active. Run 12 is devoted to 200 and 500 GeV p-p spin and hopefully some tests of U+U with 15 GeV Au-Au and 200 GeV Cu-Au. Our job is to monitor the validity of the data, calibrations and event reconstruction from the full experiment for the Fast Offline event reconstruction. From a practical standpoint it is only possible for Offline QA to detect fairly large problems and to monitor only a few percent of the total Fast Offline productions. But even this level of QA is beneficial. In the following I will attempt to answer the most common questions about the shift work. Following this is a link to the relevent pages which you will need to become familiar with prior to your first week on shift in Run 12. Please note that new QA tools introduced last year for testing are now available for routine use. These new features enable all offline data files to be checked using automated algorithms. Information on this is included in the documentation pages for Run 12.
-
No programming skills, such as C++, are required. All the tasks are web based "point-and-click" activities. However, you should have valid RCF and AFS accounts since you may need direct access to the histogram postscript files or reference QA histograms. Note that there are new login security measures in effect at the RCF.
-
General knowledge of the STAR detector, reconstruction methods and calibration issues are expected since the purpose of these shifts is to spot problems with the hardware and event reconstruction, or with the calibrations. Expert level knowledge is not required however.
-
All persons are required to be at BNL for their first week of Offline QA shift service. This is motivated by the fact that many unforeseen problems will very likely arise during these shifts and quick, real time help, which is more likely to be available at BNL, is essential to insure daily shift productivity.
-
Subsequent Offline QA shifts may be done from non-BNL sites provided adequate web access to the Auto QA system can be demonstrated from the remote site.
-
The offline QA shift may be done any time throughout the day but it is expected that a serious effort will require at least 8 hours a day.
-
There are no special QA training schools; the web based documentation is intended to fulfill such needs. But if you have further questions please send email to Lanny Ray, ray@physics.utexas.edu.
-
The Fast Offline QA shift work involves the following tasks, all of which are web based:
-
Fetch the latest set of Fast offline production jobs using the Auto QA browser and compare a standard set of histograms to a reference. Due to changing run conditions these reference histograms will not be ready until some reasonable data have been collected in the first week or so of the new run. With the new QA tools comparison with reference histograms is much more transparent than it is has been in the past.
-
Fill in a web based report form listing the jobs which have been QA-ed and giving detailed comments as needed. Summarize observed changes in hardware/software performance for the Fast Offline data and report directly to the three Shift Leaders and Period Coordinator on duty. Note that there is a "play" mode which can be used to practice using the QA Shift report form.
-
Provide a data/run quality summary based on the Online Run Log information and comments and the QA work.
-
Notify the appropriate people about suspected problems with the hardware, calibrations, production, or reconstruction software.
-
Check the Online-to-Offline data base migration using the "Database Migration Monitor" link on the first page of the QA browser after you login. When data are being taken the first several tables should appear in green font. If no data have been acquired for a day or so then all the tables should be in red. If there are any red fonts in the first several tables labelled "RunLog_onl" while data are being taken then this may indicate a problem and you should notify starqa-hn explicitly.
-
-
If you are not already subscribed to the 'starqa-hn' and 'starprod-hn' hypernews forums then please do so since this is the principal means for communicating with the production crew. See the HyperNews home page or select "hypernews" from the left panel on the STAR Home page. Follow the instructions for subscribing.
-
Lanny Ray and Gene van Buren will be available to assist and supervise the shift crew to insure that meaningful QA work is getting done.
Welcome aboard!
Lanny Ray, The University of Texas at Austin
January 30, 2012
STAR QA Documentation
Contacts:
Integrating QA Histograms into Makers
(Instructions provided by Gene Van Buren, November 17, 2004)
It is generally the responsibility of the subsystem software leaders to select the appropriate histograms for quality assurance studies of the data and to integrate those histograms into their event reconstruction Makers. The following are some helpful instructions provided by Gene Van Buren for integrating QA histograms into subsystem Makers. This process involves a collaborative effort between the subsystem software expert and Gene Van Buren.
Lanny RayThere are two possible ways to do this:
- Create the histograms in your own Maker, use StMaker::AddHist() on them, and tell me (Gene Van Buren) what your maker is called.
- Write up the code that would be necessary to produce the histograms from StEvent and give it to me. This option only works if your data is available in StEvent, but allows reproduction of the histograms from event.root files as well as during production.
After that, there are two more issues:
- Do you want the histograms to be viewed by the QA shift crew? Such histograms are a subset of the total set of QA histograms. The rest can be viewed by more interested experts at any time. Please be very conservative in selecting histograms for the QA shift crew to review; a few well chosen plots are optimal.
- Do you want the histograms to be viewed by trigger type or not? For most histograms in QA, we make separate instances of the histograms for different trigger sets (for example, central triggers, minbias triggers, high tower triggers, etc.). This is only available with option 2) above. Some histograms have only one instance, filled for all trigger types of interest in each file sequence. (Note: trigger types are not the same as file streams, though file streams are usually correlated with trigger types. For example, the st_physics file stream may contain several trigger types, while the st_mtd file stream may only contain one.)
A note that the QA team uses a small wrapper class to book histograms in an effort to standardize naming, particularly for the case of trigger-type-separated histograms, and simplify some common, repetitive booking procedures: St_QA_Maker/QAH.
Lastly, we can add colors or lines or log axes or whatever graphics you'd like when the plots are drawn. This is controlled in the class StAnalysisUtilities/StHistUtil.
Gene Van Buren
Created: Wed Nov 17 10:33:14 EDT 2004; Last Modified: Tue March 10 12:30 EDT 2015
Manual generation of QA histograms
When there is a need or other interest in generating the Fast Offline QA histograms by hand, these are the steps to follow. You will need an account on rcf, the exact path to the hist.root files of the data you want.
To create a graphics output from a hist.root file
(see note at bottom if you do not have a hist.root file),
you will want to use the macro found here:
    $STAR/StRoot/macros/analysis/bfcread_hist_to_ps.C
This macro is already in a path that will automatically
be found when running root4star.

The macro's arguments which may need attention are:
    - MainFile: the full path name for
      hist.root file you want. FastOffline hist.root
      files can typically be found on the disks
      /star/data09,10,11,12.
    - psFile: you can use the default of "QA_hist.ps", but
      customizing this will avoid overwriting if you want
      to make multiple sets of plots. A PDF can be obtained
      by using a filename ending in ".pdf" .
    - PrintList: for the short QA histogram output insert "qa_shift"
      in the argument of PrintList.  If you want the full 100+ page
      output just leave the default, i.e. PrintList="" .

Here's an example of what your executed macro could look like:

root4star -l 'bfcread_hist_to_ps.C(\
"/star/data08/reco/cu62productionMinBias/FullField/dev/2005/077/st_physics_6077050_raw_1010009.hist.root",\
"EventQA",\
"bfcTree",\
"st_physics_6077050_raw_1010009.ps",\
"",\
"qa_shift",\
2,3)'

Running the macro in batch mode (root4star's "-b" option) will
help it run more quickly by not showing the plots as they are
generated.

That's all there is to it.  View the QA histos however you wish and
your in business.

If you want to combine statistics from multiple histogram files,
you can add them together using the bfcread_hist_files_add.C
macro first. Here is an example of doing so:

ls /star/data{09,1[012]}/reco/production_15GeV_2014/ReversedFullField/dev/2014/054/15054005/st_physics*.hist.root > filelist
root4star -b -q -l 'bfcread_hist_files_add.C(1000,"filelist","run15054005")'
root4star -b -q -l 'bfcread_hist_to_ps.C("run15054005.hist.root")'


_________________

If you do not have a hist.root file, you can process a DAQ
file by any usual receonstruction chain (you can check that
the 'EventQA' chain option gets used), or you can process
an existing event.root file with the macros:
bfcread_event_QAhist.C  (skips hist.root file and draws plots)
or
bfcread_event_QA_outhistfile.C  (creates a hist.root file)
(both are in $STAR/StRoot/macros/analysis)
webmaster Created: Fri April 21 13:54:24 EDT 2006; Last modified Tue March 10 12:30 EDT 2015
Offline QA Histogram Trigger Types
Offline QA Histogram Trigger Types
- By default, the Offline QA histogramming code (under StRoot/St_QA_Maker) creates multiple sets of QA histograms (those booked in StQABookHist) for different trigger types.
- This can be overridden by including the option QAalltrigs in the reconstruction BFC chain. This forces only a single set of histograms to be booked, and all events, regardless of offline trigger ID, are used to fill the histograms.
- Standard procedure is to run FastOffline with the QAalltrigs option until we have reached physics production mode at the experiment.
- Each histogram set is booked only upon the first instance of an event which matches the trigger type criteria. This means that if no events matching a specific trigger type are encountered, the histograms for that type will not even be booked.
- Each event has the potential to match multiple trigger types, and all matching trigger type histogram sets will be filled for each event. This implies that summing histograms from all trigger types can lead to multiple-counting of events.
- The Offline Trigger IDs stored in each event, StEvent->triggerIDCollection()->nominal()->triggerIds(), are used to determine trigger types.
- Offline Trigger IDs below 10000 are ignored (assumed to be test triggers), unless the QAalltrigs override is on.
- Histogram references (for each histogram within a set) to be used by Offline QA may be defined generally for all trigger types, or overridden by a separate reference histogram for specific trigger types.
Any criteria can be used to define a trigger type using the Offline TriggerIDs. We have traditionally used the "hundreds digit" of the Offline Trigger ID is a sufficient tag (i.e. for an Offline Trigger ID of '210987', the hundreds digit is '9'). As of March 16, 2012 (Run 12, start of pp500 operations), the trigger types associated to Offline Trigger IDs are as follows:
| Trigger Type | Shorthand | Description | Offline Trigger ID (hundreds digit) |
|---|---|---|---|
| MinBias-like | MB | basic collision triggers | 0 |
| Central-like | CL | multiplicity bias | 1 |
| High Tower | HT | single tower energy | 2,3 |
| Jet Patch | JP | tower cluster energy | 4,5 |
| Other Physics* | XX | various | 6-9 |
* Other Physics histograms usually suffer two-fold for QA purposes: (1) they may be a mixture of a variety of triggers, whose relative composition may change from run to run, and (2) they often have fewer statistics than the other triggers.
_______________________
Some history: chasing a moving target in the st_physics* file steams
Form many years, nothing other than the provided links was posted regarding what Offline Trigger IDs should be used to categorize events for Offline QA and we were left to react. Hopefully, this is now past us.
- We first started separating histograms by multiplicity class during Run 1.
- We began using trigger IDs to separate event classes in February, 2003.
- A request was made to standardize the Offline Trigger IDs in January, 2004, and a convention of 'x5Nxx' was declared, using the hundreds digit N to differentiate physics triggers, with '0' for MinBias, '1' for Central, '2' for EMC (High Tower), '3' for Other Physics, and '4' for L2/L3.
- In Run 5, physics triggers appeared without restricting the thousands digit to 5.
- In Run 8, High Tower triggers began to use '5' for the hundreds digit, so we narrowed "Other Physics" to 6-9.
- In Run 9, there was interest in having histograms for Jet Patch using hundreds digit '4' (i.e. EMC triggers were dividied into two separate groups for High Tower and Jet Patch).
- In Run 11, MinBias triggers began to use the '1' hundreds digit, so the Cental trigger type was dropped. There were TOF1 and TOF0*VPDMB triggers which used '3' so they were ignored by Offline QA (other TOF triggers used the '0' and '1' digit and were clasified as MinBias). Jet Patch triggers used '6', so they were classified as Other Physics. There were also EMC High Tower triggers (EHT0?, using the EEMC?), which used '8' and were classified as Other Physics. The atomcules triggers used '5', so they were classified as High Tower.
- In Run 12 pp200 operations, (still no guidance), there are likely the same mis-labelings as in Run 11: an unclassified trigger (BBCMB*TOF0) using the '3' digit (10% of the data?), Jet Patch using the '6' digit, and High Tower (EHT0 : EEMC?) using the '8' digit.
- In Run 12 pp500, we have agreed on a convention (the one shown above).
Offline QA Shifts (Y2000 run)
Peter Jacobs, July 11, 2000
This document is a first try at describing procedures for the Offline QA shift crew. As you will see, there are a number of open questions concerning what should be done during this shift and how to do it, whose answers we will have only after we gain experience with real data. Please give feedback to the STAR QA links and contacts on what you find confusing, what could be done better, and what doesn't make any sense to you.- Scope of the Offline QA shift activities
The proposed scope of the Offline QA shift is to assess the quality of
the DSTs being produced by the Offline Production team. There are
several classes of data to be examined:
- Large scale production of real data: data that will be used for physics analysis
- Large scale production of MC data: MC data that will be used for detailed physics studies and corrections for data analysis.
- Nightly tests of real and MC data: limited number of events run in the DEV or NEW branches of the library. These are used to test the libraries and validate them prior to a new r elease and migration DEV->NEW->PRO.
- Express queue of real data: a small fraction (~5%?) of real data will be channeled to an express production queue during the running of the experiment, to serve as feedback to the crews running the experiment. The results of this production should be reported as soon as possible, typically at the 5 p.m. meeting in the counting house.
- Use of autoQA
The principal tool for the Offline QA shift crew is the autoQA web
page. Discussion of QA in general and detailed usage of that page
can be found STAR QA for Offline Software, which you should be
familar with before you read the rest of this document. Usage of
autoQA version 2 is very similar to the old autoQA (version 1), so if
you used that you should be able to understand the following.
There have however been many changes behind the scenes. The major changes are
- autoQA now interfaces to the MySQL databases. It queries the Production File Catalog for completed jobs, and writes QA information back to a QA database. The latter can be used in future in the tag DB or some other mechanism, once a reliable QA cycle is established.
- autoQA can now handle the range of data classes specified in the introduction.
- All QA ROOT jobs are now run on rcas under LSF. This change was necessary in anticipation of a large volume of QA processes once large scale data taking starts. This of course also introduces another layer of complexity into the QA framework, and monitoring of autoQA jobs on rcas will be part of the QA shift work.
- Offline QA Shift Tasks
- Which runs to examine?
Discuss the recent production with the Production Crew and establish a
prioritized list of runs to QA. The express queue mechanism is still
under discussion and is not set up yet, but once it is established it
should recieve highest priority for timely feedback to the counting
house. The other criteria for setting priorities is whether urgent
feedback is needed for a library release, or other runs require
special attention. Otherwise, the shift crew should look at the most
recent production that has been QA-ed under the various classes of
data.
Since the autoQA mechanism queries the File Catalog once an hour (for real data, less frequently for other data classes) and submits QA batch jobs on rcas, there may be a significant delay between when production is run and when the QA results become available. We will have to monitor this process and adjust the procedures as necessary. Feedback on this point from the shift crew is essential.
- How to look at a run
I will specify how to look at a run in the data class "Real Data
Production". Other data classes will have different selection
procedures, reflecting the differences in the File Catalog structure
for these different classes, but the changes should be obvious.
- Select "Real Data Production" from the pulldown menu in the banner.
- Use the pulldown menus to compose a DB query that includes the run you are interested in. The simplest procedure at the moment is to specify the runID and leave all other fields at "any". In the near future these selections will include trigger, calibration and geometry information. Note that the default for "QA status" is "done".
- Press "Display Datasets". A listing of all catalogued runs corresponding to you query will appear in the upper frame.
- To examine the QA histograms, press the "QA details" button. In the lower panel, a set of links to the histogram files will appear. The format is gzipped postscript. If your browser is set up to launch ghostview for files of type "ps", these files will be automatically unzipped and displayed. Otherwise, you will have to do something more complicated, such as save the file and view it another way. Note that if the macro "bfcread_hist_to_ps" is reported to have crashed, some or all histograms may be missing.
- To examine the QA scalars and tests, scroll past the histogram links in the lower panel and push the button. Tables of scalars for all the data branches will appear in the auxilliary window.
- To commpare the QA scalars to similar runs, press the "Compare reports" button. Details on how to procede are found in the autoQA documentation. Note that until more refined selections are available for real data (e.g. comparing runs with idenitical trigger conditions and processing chains), this facility will be of limited utility. Note also that the planned functionality of automatically comparing to a standard reference run has not yet been implemented, for similar reasons.
- What QA data to examine
This area needs significant discussion. What we are generally looking
for is that all data are present and can be read (scalar values should
appear in all branches) and that the results look physically
meaningful (e.g. vertex distribution histograms). Comparison to
previous, similar runs to check for stability is highly desirable but
it is not clear how to carry this out at present, for reasons
described above. We should revisit this question as we gain more
experience.
The principal QA tool is the histograms, generated by bfcread_hist_to_ps. The number of QA histograms has grown enormously over the past six months and needs to be pruned back to be useful to the non-expert. This work is going on now (week of July 10) and more information will be forthcoming.
Description of all the macros run by autoQA is found here. This documentation is important for understanding the meaning of the QA scalars.
Here are some general guidelines on what to report:
- Status of run - completed, if not give error status (segmentation violation etc)
- Macros that crashed
- Macros whose QA status is not "O.K." (At present, this means simply that there is no data in the branch that macro is trying to read. No additional tests are applied to the data.)
- Anomalous histograms and scalars - this is necessarily vague at this point.
- How to report results
Once per shift you should send a status report to the QA
hypernews forum:
starqa-hn@www.star.bnl.gov
If you are doing Offline QA shifts, you should subscribe to this forum.
The autoQA framework has a "comment" facility that allows the user to annotate particular runs or to enter a "global comment" that will appear chronologically in the listing of all runs. These are displayed together with the datasets, and while not appropriate for lengthy reports, can serve as flags for specific problems and supply hyperlinks to longer reports. Note that this is not a high security system (anyone can alter or delete you messages).
You do not need the QA Expert's password to use this facility. Press the button "Add or edit comments" in the upper right part of the upper panel. You will be asked for some identifying string that will be attached to your comments. Enter you name and press return. You will have to press "Display Datasets" again, at which point a button "Add global comment" will appear below the pulldown menus, and each run listing will have an "Add comment" button. Follow the instructions. Messages are interpreted as html, so links to other pages can be introduced. One possibility is to enter the hyperlink to the QA report you have sent to starqa-hn. This can obviously be automated, but it isn't yet and doing it by hand should be straightforward.
- Checking QA jobs on rcas Every two hours you should check the status of autoQA jobs running on rcas, by clicking on "RCAS/LSF monitor" (upper right, under the "Add or Edit Comments" button). You cannot alter jobs using this browser unless you have the Expert's password, so there is no possibility of doing damage. Select jobs called QA_TEST. Each of these is a set of QA macros for a single run, that should require up to 10 minutes CPU time. The throughput of this system for QA is as yet unknown, but you should check that jobs are not sitting in the PENDING queue for more than an hour or two, and are not stalling while running (should not take more than 15 minutes CPU). In case of problems, contact an expert.
Peter Jacobs Last modified: Tue Jul 11 02:35:05 EDT 2000 - Which runs to examine?
Discuss the recent production with the Production Crew and establish a
prioritized list of runs to QA. The express queue mechanism is still
under discussion and is not set up yet, but once it is established it
should recieve highest priority for timely feedback to the counting
house. The other criteria for setting priorities is whether urgent
feedback is needed for a library release, or other runs require
special attention. Otherwise, the shift crew should look at the most
recent production that has been QA-ed under the various classes of
data.
Other Expert contacts and links
STAR Expert Contacts and Other Links
STARQA Hypernews forum: archive
send mail to starqa-hn@www.star.bnl.govSTAR DST Production Hypernews forum: archive
send mail to starprod-hn@www.star.bnl.govSTAR Software and Computing Organization: Organization
Phone numbers for STAR Experiment Control Room:
Shift Leader, main number: 631-344-4242
Online QA crew member: 631-344-2243
Lanny Ray
Last modified: Fri Nov 12 11:47:05 EDT 2004
QuickStart Instructions for the Auto QA Browser - Run 8
- Go to the STAR Computing Offline QA home page (from the STAR Home Page select "Computing" in the left panel, then select "Offline QA" or go directly to the "Offline QA home page" and open the Auto QA browser by clicking on the "Automated Offline QA Browser" button in the upper portion of the page.
- If the browser fails to open contact the "QA Experts" ASAP. If you cannot get to the Auto QA browser then you are S.O.L.
- Enter your RCF login name.
- Generally you should follow the menu on page 2. Buttons 1.1 and 2.1 direct you to pages where Real Data Production jobs and Fast Offline Production jobs can be selected. Note that for Run 8 the Offline QA shift crew are only responsible for the fast-offline production.
- For Real Data Production (Button 1.1) you will typically want to filter out previously reviewed jobs and select all other run numbers for production within the past 24 hours. Queries can be made based on QA status, run number or date, and software production version.
- For the Fast Offline Production QA (Button 2.1) select the most recent run numbers which have not yet been QA reviewed. Other queries are available as explained above. At a minimum please examine QA histograms for each trigger set for at least one file sequence per run number. Do more if you have time.
- Once you select a job to examine the QA shift or full set of QA histograms may be selected. Generally the smaller, "QA shift" set of histograms will suffice however you may need to examine the full set of QA plots in order to better diagnos a suspected problem. The postscript and/or pdf files are generated on the fly and displayed on your terminal. Generally it is best to have the QA shift report web form open in a different window so that you can fill it out as you check each set of histograms, job-by-job. Please follow the instructions on the QA shift web forms and supply all requested information about yourself and the jobs you have examined.
- Sample QA shift histograms from Run 7 (Au-Au) are in the Description of Offline QA Shift Histograms for Run 7. Reference QA Histograms for Run 8 d-Au at 200 GeV are now available. You should become familiar with the QA Shift plots and have some idea of what to expect before taking your shift.
- Be sure to select the "MARK" button on the page for each job examined and reported.
- After completing all the listed jobs add whatever comments you think are useful and appropriate to the QA Shift Report. Be sure to include a useful summary for Fast Offline Data that will be helpful to the shift crew, i.e. report any changes from the previous day including new problems or resolution of old problems. Note that the QA Issues mechanism of the web based QA shift reportform automatically monitors day-to-day changes in these issues and lists them in the QA shift report summary that is mailed to starqa-hn.
- MOST IMPORTANT!!! If you suspect any problem with the detector(s), calibrations, reconstruction or production you must contact the appropriate expert(s). This is the basic reason for having the Auto QA system and these dedicated shifts. The experts may be contacted via either the "QA Experts" or "Other Experts" web pages.
- Complete your QA Shift Report and submit it. The ASCII text version will be emailed to 'starqa-hn'.
- Links to QA documentation, contacts, the Rcas/LSF monitor, Online Run Log, and the QA shift report web form are available from Page 2.
- Finally, you are done for the day; go get some rest!
webmaster Last modified: Jan 11, 2008
QuickStart Instructions for the Auto QA Browser - Run 9
- Go to the STAR Computing Offline QA home page on drupal (i.e. from the STAR Home Page select "Computing" in the left panel, then select "Offline QA" in the table row labelled "Production" or go directly to the Offline QA and open the Auto QA browser by clicking on the "Automated Offline QA Browser" button in the upper portion of the page. You may have to enter the STAR protected area username and password. Contact your local STAR council representative or me if you do not know it.
- If the browser fails to open contact the STAR QA links and contacts ASAP. If you cannot get to the Auto QA browser then you are S.O.L.
- Enter your RCF login name.
- Generally you should follow the menu on page 2. Buttons 1.1 and 2.1 direct you to pages where Real Data Production jobs and Fast Offline Production jobs can be selected. Note that for Run 9 the Offline QA shift crew are only responsible for the fast-offline production (button 2.1) and monitoring database migration (button 2.3).
- At the beginning of your shift please check the status of the online-to-offline database migration and notify the QA experts and QA hypernews if the migration appears to be stalled.
- For Real Data Production (Button 1.1) you will typically want to filter out previously reviewed jobs and select all other run numbers for production within the past 24 hours. Queries can be made based on QA status, run number or date, and software production version.
- For the Fast Offline Production QA (Button 2.1) select the most recent run numbers which have not yet been QA reviewed. Other queries are available. You may examine the 24 TPC sectors or view the entire set of QA histograms by selecting the appropriate options in the upper portion of page 2.1. For Run 9 you may need to use the "Combine several jobs together" feature in order to have enough statistics in the histograms for proper evaluation. At a minimum please examine QA histograms for each trigger set for at least one file sequence per run number. Do more if you have time.
- Once you select a job to examine the QA shift or full set of QA histograms may be selected. Generally the smaller, "QA shift" set of histograms will suffice however you may need to examine the full set of QA plots in order to better diagnos a suspected problem. The postscript and/or pdf files are generated on the fly and displayed on your terminal. Generally it is best to have the QA shift report web form open in a different window so that you can fill it out as you check each set of histograms, job-by-job. Please follow the instructions on the QA shift web forms and supply all requested information about yourself and the jobs you have examined.
- You may refer to the sample QA shift histograms from Run 7 (Au-Au) in the Description of Offline QA Shift Histograms for Run 7 and the Reference QA Histograms for Run 8 d-Au at 200 GeV until Run 9 p-p reference histograms are ready, usually about 2 weeks into the run. You should become familiar with the QA Shift plots and have some idea of what to expect before taking your shift.
- Be sure to select the "MARK" button on the page for each job examined and reported.
- Please mark the job as "Good" or "Bad" on this same page. Normally jobs will be "good" but under extraordinary conditions the QA shift crew may mark jobs as bad. Please consult with the QA experts before marking jobs or runs as bad.
- After completing all the listed jobs add whatever comments you think are useful and appropriate to the QA Shift Report. Be sure to include a useful summary for Fast Offline Data that will be helpful to the shift crew, i.e. report any changes from the previous day including new problems or resolution of old problems. Note that the QA Issues mechanism of the web based QA shift reportform automatically monitors day-to-day changes in these issues and lists them in the QA shift report summary that is mailed to starqa-hn.
- MOST IMPORTANT!!! If you suspect any problem with the detector(s), calibrations, reconstruction or production you must contact the appropriate expert(s). This is the basic reason for having the Auto QA system and these dedicated shifts. The experts may be contacted via either the STAR QA links and contacts or Other Expert contacts and links web pages.
- Complete your QA Shift Report and submit it. The ASCII text version will be emailed to 'starqa-hn'.
- Links to QA documentation, contacts, the Rcas/LSF monitor, Online Run Log, and the QA shift report web form are available from Page 2.
- Finally, you are done for the day; go get some rest!
webmaster
Last modified: Feb 18, 2009
QuickStart Instructions for the Auto QA Browser - Run 10
- Go to the STAR Computing Offline QA home page on drupal (i.e. from the STAR Home Page select "Computing" in the left panel, then select "Offline QA" in the table row labelled "Production" or go directly to the Offline QA and open the Auto QA browser by clicking on the "Automated Offline QA Browser" button in the upper portion of the page. You may have to enter the STAR protected area username and password. Contact your local STAR council representative or me if you do not know it.
- If the browser fails to open contact the STAR QA links and contacts ASAP. If you cannot get to the Auto QA browser then you are S.O.L.
- Enter your RCF login name.
- Generally you should follow the menu on page 2. Buttons 1.1 and 2.1 direct you to pages where Real Data Production jobs and Fast Offline Production jobs can be selected. Note that for Run 10 the Offline QA shift crew are only responsible for the fast-offline production (button 2.1) and monitoring database migration (button 2.3).
- At the beginning of your shift please check the status of the online-to-offline database migration and notify the QA experts and QA hypernews if the migration appears to be stalled.
- For Real Data Production (Button 1.1) you will typically want to filter out previously reviewed jobs and select all other run numbers for production within the past 24 hours. Queries can be made based on QA status, run number or date, and software production version.
- For the Fast Offline Production QA (Button 2.1) select the most recent run numbers which have not yet been QA reviewed. Other queries are available. You may examine the 24 TPC sectors or view the entire set of QA histograms by selecting the appropriate options in the upper portion of page 2.1. For Run 10 Au-Au data one file sequence should be sufficient, but if you need to increase the statistics please use the "Combine several jobs together" feature in order to have enough statistics in the histograms for proper evaluation. At a minimum please examine QA histograms for each trigger set for at least one file sequence per run number. Do more if you have time.
- Once you select a job to examine the QA shift or full set of QA histograms may be selected. Generally the smaller, "QA shift" set of histograms will suffice however you may need to examine the full set of QA plots in order to better diagnose a suspected problem. The postscript and/or pdf files are generated on the fly and displayed on your terminal. Generally it is best to have the QA shift report web form open in a different window so that you can fill it out as you check each set of histograms, job-by-job. Please follow the instructions on the QA shift web forms and supply all requested information about yourself and the jobs you have examined.
- You may refer to the sample QA shift histograms from Run 7 (Au-Au) in the Description of Offline QA Shift Histograms for Run 7 and the Reference QA Histograms for Run 8 d-Au at 200 GeV until Run 10 Au-Au reference histograms are ready, usually about 2 weeks into the run. You should become familiar with the QA Shift plots and have some idea of what to expect before taking your shift.
- Be sure to select the "MARK" button on the page for each job examined and reported.
- Please mark the job as "Good" or "Bad" on this same page. Normally jobs will be "good" but under extraordinary conditions the QA shift crew may mark jobs as bad. Please consult with the QA experts before marking jobs or runs as bad.
- After completing all the listed jobs add whatever comments you think are useful and appropriate to the QA Shift Report. Be sure to include a useful summary for Fast Offline Data that will be helpful to the shift crew, i.e. report any changes from the previous day including new problems or resolution of old problems. Note that the QA Issues mechanism of the web based QA shift reportform automatically monitors day-to-day changes in these issues and lists them in the QA shift report summary that is mailed to starqa-hn.
- MOST IMPORTANT!!! If you suspect any problem with the detector(s), calibrations, reconstruction or production you must contact the appropriate expert(s). This is the basic reason for having the Auto QA system and these dedicated shifts. The experts may be contacted via either the STAR QA links and contacts or Other Expert contacts and links web pages.
- Complete your QA Shift Report and submit it. The ASCII text version will be emailed to 'starqa-hn'.
- Links to QA documentation, contacts, the Rcas/LSF monitor, Online Run Log, and the QA shift report web form are available from Page 2.
- Finally, you are done for the day; go get some rest!
QuickStart Instructions for the Auto QA Browser - Run 10
- Go to the STAR Computing Offline QA home page on drupal (i.e. from the STAR Home Page select "Computing" in the left panel, then select "Offline QA" in the table row labelled "Production" or go directly to the Offline QA and open the Auto QA browser by clicking on the "Automated Offline QA Browser" button in the upper portion of the page. You may have to enter the STAR protected area username and password. Contact your local STAR council representative or me if you do not know it.
- If the browser fails to open contact the STAR QA links and contacts ASAP. If you cannot get to the Auto QA browser then you are S.O.L.
- Enter your RCF login name.
- Generally you should follow the menu on page 2. Buttons 1.1 and 2.1 direct you to pages where Real Data Production jobs and Fast Offline Production jobs can be selected. Note that for Run 10 the Offline QA shift crew are only responsible for the fast-offline production (button 2.1) and monitoring database migration (button 2.3).
- At the beginning of your shift please check the status of the online-to-offline database migration and notify the QA experts and QA hypernews if the migration appears to be stalled.
- For Real Data Production (Button 1.1) you will typically want to filter out previously reviewed jobs and select all other run numbers for production within the past 24 hours. Queries can be made based on QA status, run number or date, and software production version.
- For the Fast Offline Production QA (Button 2.1) select the most recent run numbers which have not yet been QA reviewed. Other queries are available. You may examine the 24 TPC sectors or view the entire set of QA histograms by selecting the appropriate options in the upper portion of page 2.1. For Run 10 Au-Au one file sequence should suffice. But if you need greater statistics you may use the "Combine several jobs together" feature in order to have enough statistics in the histograms for proper evaluation. At a minimum please examine QA histograms for each trigger set for at least one file sequence per run number. Do more if you have time.
- Once you select a job to examine the QA shift or full set of QA histograms may be selected. Generally the smaller, "QA shift" set of histograms will suffice however you may need to examine the full set of QA plots in order to better diagnos a suspected problem. The postscript and/or pdf files are generated on the fly and displayed on your terminal. Generally it is best to have the QA shift report web form open in a different window so that you can fill it out as you check each set of histograms, job-by-job. Please follow the instructions on the QA shift web forms and supply all requested information about yourself and the jobs you have examined.
- You may refer to the sample QA shift histograms from Run 7 (Au-Au) in the Description of Offline QA Shift Histograms for Run 7 and the Reference QA Histograms for Run 8 d-Au at 200 GeV until Run 10 Au-Au reference histograms are ready, usually about 2 weeks into the run. You should become familiar with the QA Shift plots and have some idea of what to expect before taking your shift.
- Be sure to select the "MARK" button on the page for each job examined and reported.
- Please mark the job as "Good" or "Bad" on this same page. Normally jobs will be "good" but under extraordinary conditions the QA shift crew may mark jobs as bad. Please consult with the QA experts before marking jobs or runs as bad.
- After completing all the listed jobs add whatever comments you think are useful and appropriate to the QA Shift Report. Be sure to include a useful summary for Fast Offline Data that will be helpful to the shift crew, i.e. report any changes from the previous day including new problems or resolution of old problems. Note that the QA Issues mechanism of the web based QA shift reportform automatically monitors day-to-day changes in these issues and lists them in the QA shift report summary that is mailed to starqa-hn.
- MOST IMPORTANT!!! If you suspect any problem with the detector(s), calibrations, reconstruction or production you must contact the appropriate expert(s). This is the basic reason for having the Auto QA system and these dedicated shifts. The experts may be contacted via either the STAR QA links and contacts or Other Expert contacts and links web pages.
- Complete your QA Shift Report and submit it. The ASCII text version will be emailed to 'starqa-hn'.
- Links to QA documentation, contacts, the Rcas/LSF monitor, Online Run Log, and the QA shift report web form are available from Page 2.
- Finally, you are done for the day; go get some rest!
QuickStart Instructions for the Auto QA Browser - Run 11
- Go to the STAR Computing Offline QA home page on drupal (i.e. from the STAR Home Page select "Computing" in the left panel, then select "Offline QA" in the table row labelled "Production" or go directly to the Offline QA home page and open the Auto QA browser by clicking on the "Automated Offline QA Browser" button in the upper portion of the page. You may have to enter the STAR protected area username and password. Contact your local STAR council representative or me if you do not know it.
- If the browser fails to open contact the QA Experts ASAP. If you cannot get to the Auto QA browser then you are S.O.L.
- Enter your RCF login name.
- Generally you should follow the menu on page 2. Buttons 1.1 and 2.1 direct you to pages where Real Data Production jobs and Fast Offline Production jobs can be selected. Note that for Run 11 the Offline QA shift crew are only responsible for the fast-offline production (button 2.1) and monitoring database migration (button 2.3).
- At the beginning of your shift please check the status of the online-to-offline database migration and notify the QA experts and QA hypernews if the migration appears to be stalled.
- For Real Data Production (Button 1.1) you will typically want to filter out previously reviewed jobs and select all other run numbers for production within the past 24 hours. Queries can be made based on QA status, run number or date, and software production version.
- For the Fast Offline Production QA (Button 2.1) select the most recent run numbers which have not yet been QA reviewed. Other queries are available. You may examine the 24 TPC sectors or view the entire set of QA histograms by selecting the appropriate options in the upper portion of page 2.1. For Run 11 Au-Au one file sequence should suffice. But if you need greater statistics (e.g. for the p-p data) you may use the "Combine several jobs together" feature in order to have enough statistics in the histograms for proper evaluation. At a minimum please examine QA histograms for each trigger set for at least one file sequence per run number. Do more if you have time.
- Beginning with Run 11 there are two additional options for selecting and reviewing QA jobs. These are noted by the buttons labelled "New: Select jobs that have been automatically combined" and the 3 job selection options listed as "TESTING" buttons. The former combined jobs option may give a more complete list of available jobs. The latter "TESTING" options, as the name implies, are still under development. This new feature enables automated comparisons between the data and a reference and provides an easy way to visually compare data and reference. You are encouraged to try this option and give feed-back to the QA team. For now this option can be used to easily compare the histograms to a reference and enables a convenient way to attach example histograms to QA issues. Hopefully before the end of Run 11 we can rely on the auto-comparison algorithms to check the data. For now, however, we must continue to rely on the shift crew's visual evaluation.
- TESTING option - If you use this job selection and QA evaluation option you will be directed to a new web page which enables the histograms to be both visually and algorithmically compared to a reference (defined by the QA experts). In the upper panel check the run year, trigger and version options for the data and click either "arrow" button, then click the "Plots only" button to obtain individual gifs of each histogram (useful for QA issues documentation) or the "Analyze" button and wait a few minutes for the results. Failed histogram auto-comparisons are listed by default, but all histogram results may be selected in the left-hand panel; the results are color coded. Clicking the "Examine" buttons on the right displays the results and a visual comparison of the histograms with the reference. Selecting the histogram set in the left panel (e.g. general, minbias, high tower, etc.) displays a list of buttons for all the histograms. Clicking those buttons displays the data and reference. Thus there are two ways to display the selected data and reference. For now the list of failed histograms (too dissimilar to the reference) can be examined but please do not rely on the algorithmic comparisons just yet. Note that there are several HELP buttons which link to useful descriptions of the new features briefly discussed here. To return to the QA run selection page you must use the "Go back to QA selection" button in the upper panel.
- Once you select a job to examine the QA shift or full set of QA histograms may be selected. Generally the smaller, "QA shift" set of histograms will suffice however you may need to examine the full set of QA plots in order to better diagnos a suspected problem. The postscript and/or pdf files are generated on the fly and displayed on your terminal. Generally it is best to have the QA shift report web form open in a different window so that you can fill it out as you check each set of histograms, job-by-job. Please follow the instructions on the QA shift web forms and supply all requested information about yourself and the jobs you have examined.
- You may refer to the sample QA shift histograms from Run 10 (Au-Au) in the Description of Offline QA Shift Histograms for Run 10 until Run 11 Au-Au reference histograms are ready (now available via the TESTING option), usually about 2 weeks into the run. You should become familiar with the QA Shift plots and have some idea of what to expect before taking your shift.
- Be sure to click the "MARK" button on the page for each job examined and reported.
- Please mark the job as "Good" or "Bad" on this same page. Normally jobs will be "good" but under extraordinary conditions the QA shift crew may mark jobs as bad. Please consult with the QA experts before marking jobs or runs as bad.
- After completing all the listed jobs add whatever comments you think are useful and appropriate to the QA Shift Report. Be sure to include a useful summary for Fast Offline Data that will be helpful to the shift crew, i.e. report any changes from the previous day including new problems or resolution of old problems. Note that the QA Issues mechanism of the web based QA shift report form automatically monitors day-to-day changes in these issues and lists them in the QA shift report summary that is mailed to starqa-hn.
- When new problems appear in the data please review the list of existing QA issues and use if appropriate before creating a new issue. Note that there is a key-word search tool to help you find previous, relevant issues. Please follow the naming convention established for the existing Run 11 issues. You are encouraged to document the issues with histograms using the browse/upload tool in the QA issues editor web page. The "TESTING" option of the browser and the "Plots only" option on the new QA page provide an easy way to grab and upload individual histogram plots (gifs). Refer to the Help buttons on the new page and click "full topic list", then select "Grabbing a histogram image and attaching to an issue" for instructions - i.e. right click on the image, save to your computer, then in the QA issues page select "Image attachments" and upload your saved gif file.
- MOST IMPORTANT!!! If you suspect any problem with the detector(s), calibrations, reconstruction or production you must contact the appropriate expert(s). This is the basic reason for having the Auto QA system and these dedicated shifts. The experts may be contacted via either the QA Experts or Other Experts web pages.
- Complete your QA Shift Report and submit it. The ASCII text version will be emailed to 'starqa-hn'.
- Links to QA documentation, contacts, the Rcas/LSF monitor, Online Run Log, and the QA shift report web form are available from Page 2.
- Finally, you are done for the day; go get some rest!
QuickStart Instructions for the Auto QA Browser - Run 12
- Note that you may at any time examine the available QA histograms. However, please do not MARK any runs (Good or Bad) unless you are performing your Offline QA shift duties.
- Go to the STAR Computing Offline QA home page on drupal (i.e. from the STAR Home Page select "Computing" in the left panel, then select "Offline QA" in the table row labelled "Production" or go directly to the Offline QA home page and open the Auto QA browser by clicking on the "Automated Offline QA Browser" button in the upper portion of the page. You may have to enter the STAR protected area username and password. Contact your local STAR council representative or me if you do not know it.
- If the browser fails to open contact the QA Experts ASAP. If you cannot get to the Auto QA browser then you are S.O.L.
- Enter your RCF login name.
- Generally you should follow the menu on page 2. Buttons 1.1 and 2.1 direct you to pages where Real Data Production jobs and Fast Offline Production jobs can be selected. Note that for Run 12 the Offline QA shift crew are only responsible for the fast-offline production (button 2.1) and monitoring database migration (button 2.3).
- At the beginning of your shift please check the status of the online-to-offline database migration and notify the QA experts and QA hypernews if the migration appears to be stalled.
- For Real Data Production (Button 1.1) you will typically want to filter out previously reviewed jobs and select all other run numbers for production within the past 24 hours. Queries can be made based on QA status, run number or date, and software production version.
- For the Fast Offline Production QA (Button 2.1) on the next page (Page 22) select the data grouping method buttons (A) - (D) [for p-p data the "Auto-combined" or "Combine several jobs" options are preferred in order to have sufficient statistics]. Select the job listing order (for options B and C), the date and run number ranges and click OK. At a minimum please examine QA histograms for each trigger set for at least one file sequence per run number. Do more if you have time.
- On the next page select the run to be examined with priority given to the most recent data that have not been examined and click OK.
- The next page displays the new features available this year. There are many buttons and options which the user should explore and test throughout the shift. Note that there are many Help buttons available. To get started: (1) select a reference data set which best matches the real data using the left arrow buttons to move from field to field (note that it is not required to have a reference), (2) select the plot option (none = svg format, pdf or ps), (3) select the QA histogram set to examine (Regular QA - required, or for more details see the TPC sectors, ALL, or among several subsystems), (4) select "Plots only" to view the data only, or "Analyze" to view both the data and reference and to get the results of the automated comparisons with the reference. This option can be used to easily compare the histograms to a reference and enables a convenient way to attach example histograms to QA issues (see instructions: www.star.bnl.gov/devcgi/qa/QAShiftReport/refHelp.php). Note that despite the use of automated examination tools the QA shift crew's visual evaluation of the data remains essential.
- The next window lists the QA histograms which may be viewed singly or all together along with the reference. Selecting the "Examine" buttons on the right displays the single plot and reference with a written description. Selecting the "All+Plots" button on the left lists all the plots and references. For the "Analyze" option failed histogram auto-comparisons are listed by default, but all histogram results may be selected in the left-hand panel; the results are color coded. Please do not rely on the algorithmic comparisons just yet. To return to the QA run selection page you must use the "Back to data selections" or "Back to QA options" buttons in the upper panel.
- After examining the data mark the run as examined by selecting the Good or Bad buttons on the left. Generally the data will be marked as Good but in extraordinary circumstances can be marked as Bad. Please consult with the QA team before marking any data as Bad.
- Generally it is best to have the QA shift report web form open in a different window so that you can fill it out as you check each set of histograms, job-by-job. Please follow the instructions on the QA shift web forms and supply all requested information about yourself and the jobs you have examined.
- After completing all the listed jobs add whatever comments you think are useful and appropriate to the QA Shift Report. Be sure to include a useful summary for Fast Offline Data that will be helpful to the shift crew, i.e. report any changes from the previous day including new problems or resolution of old problems. Note that the QA Issues mechanism of the web based QA shift report form automatically monitors day-to-day changes in these issues and lists them in the QA shift report summary that is mailed to starqa-hn.
- When new problems appear in the data please review the list of existing QA issues and use if appropriate before creating a new issue. Note that there is a key-word search tool to help you find previous, relevant issues. Please follow the naming convention established for the existing Run 12 issues. You are encouraged to document the issues with histograms using the browse/upload tool in the QA issues editor web page. The browser provides an easy way to grab and upload individual histogram plots (svg). Refer to the Help buttons on the new page and click "full topic list", then select "Grabbing a histogram image and attaching to an issue" for instructions - i.e. right click on the image, save to your computer, then in the QA issues page select "Image attachments" and upload your saved file.
- MOST IMPORTANT!!! If you suspect any problem with the detector(s), calibrations, reconstruction or production you must contact the appropriate expert(s). This is the basic reason for having the Auto QA system and these dedicated shifts. The experts may be contacted via either the QA Experts or Other Experts web pages.
- Complete your QA Shift Report and submit it. The ASCII text version will be emailed to 'starqa-hn'.
- Links to QA documentation, contacts, the Rcas/LSF monitor, Online Run Log, and the QA shift report web form are available from Page 2.
- Finally, you are done for the day; go get some rest!
STAR QA Documentation
Lanny Ray, University of Texas at Austin
June 11, 2002
Last Update, March 18, 2025
Index
-
Information for the Fast Offline QA Shift Crew for Run 25/26
-
General References
-
List of Contacts
-
QA Documents for Previous Runs
- Link for Runs 2 - 7
- See child pages below for other Runs (after 7, but prior to current Run)
-
Technical Documentation
Fast Offline QA Shift Report Preparation and Instructions for Run 13
Purpose of Form:
The main purpose of the shift report form is to guide the shift crew through the principal tasks which must be performed during the offline QA shifts. The QA team has made every effort to keep this form simple and compact. In Runs 3 - 12 we used a simplified form which we are again using for Run 13. The form again uses the special dialog box for reporting summaries of the Fast Offline QA which will be sent directly to the Shift Crew leaders and Period Coordinator for the appropriate run period. The emphasis of the reports should be on substantive, detailed comments. Comments should be succinct, but lucid enough so that anyone reading the report can understand the reason(s) for marking the job as suspect. The compactness of the report form does not however diminish the responsibility of each shift crew member to carefully scrutinize all the available information about each production job and to write a clear, verbal description of suspected problems.
Fast Offline QA reports are directed to the Shift Leaders and Period Coordinator for the appropriate shift-week. The summaries should emphasize only what changes day-to-day in the hardware, calibration and/or reconstruction software performance. Ongoing, persistent hardware/software problems should be reported for all runs where these issues occur for the archival record. The copy feature of the Shift Report Form is helpful for such reporting. Note that the QA Issues mechanism tracks day-to-day changes in reported problems and automatically notifies the shift leaders of those changes via starqa hypernews.
Web Based QA Shift Report Form:
An Offline QA Web based report form is provided. The fields are described on the form and should be self explanatory. Upon completion of this form an ASCII text version is automatically generated and emailed to 'starqa-hn' for distribution and archived as a permanent record. If the web page is unavailable an ASCII text template is also available (see year 2002 QA shift report instructions page). The QA reports are automatically linked to the Online Run Log for that run ID number. Please use the "play" version if you are a first-time user to practice before doing the real thing.
Please follow the instructions in the top panel and elsewhere on the report web forms. Please complete all information on the forms.
If problems are suspected you must contact by email and telephone, if necessary, the appropriate
or
Enter the names of the people and/or mailing lists which were notified in the final section of the report form.
Fast Offline QA Shift Report Preparation and Instructions for Run 25/26
Purpose of Form:
The main purpose of the shift report form is to guide the shift crew through the principal tasks which must be performed during the offline QA shifts. The QA team has made every effort to keep this form simple and compact. In Runs 3 - 16 we used a simplified form which we are again using for Run 25/26. The form again uses the special dialog box for reporting summaries of the Fast Offline QA which will be sent directly to the Shift Crew leaders and Period Coordinator for the appropriate run period. The emphasis of the reports should be on substantive, detailed comments. Comments should be succinct, but lucid enough so that anyone reading the report can understand the reason(s) for marking the job as suspect. The compactness of the report form does not however diminish the responsibility of each shift crew member to carefully scrutinize all the available information about each production job and to write a clear, verbal description of suspected problems.
Fast Offline QA reports are directed to the Shift Leaders and Period Coordinator for the appropriate shift-week. The summaries should emphasize only what changes day-to-day in the hardware, calibration and/or reconstruction software performance. Ongoing, persistent hardware/software problems should be reported for all runs where these issues occur for the archival record. The copy feature of the Shift Report Form is helpful for such reporting. Note that the QA Issues mechanism tracks day-to-day changes in reported problems and automatically notifies the shift leaders of those changes via starqa hypernews.
Web Based QA Shift Report Form:
An Offline QA Web based report form is provided. The fields are described on the form and should be self-explanatory. Upon completion of this form an ASCII text version is automatically generated and emailed to 'starqa-hn' for distribution and archived as a permanent record. If the web page is unavailable an ASCII text template is also available (see year 2002 QA shift report instructions page). The QA reports are automatically linked to the Online Run Log for that run ID number. Please use the "play" version if you are a first-time user to practice before doing the real thing.
Please follow the instructions in the top panel and elsewhere on the report web forms. Please complete all information on the forms.
If problems are suspected you must contact by email and telephone, if necessary, the appropriate
or
Enter the names of the people and/or mailing lists which were notified in the final section of the report form.
Information for Fast Offline QA Shifts - Run 13
Welcome to the STAR Fast Offline Quality Assurance and Offline DST Production QA Shift home page. In Run 13 the TPC, EMC-barrel, EMC-SMD-eta grid, EMC-SMD-phi grid, EMC End Cap, End Cap SMD, TOF-MRPCs and partial GEM and MTD detector subsystems will be active. Run 13 is devoted to 510 GeV p-p spin and maybe some 15 GeV Au-Au. Our job is to monitor the validity of the data, calibrations and event reconstruction from the full experiment for the Fast Offline event reconstruction. From a practical standpoint it is only possible for Offline QA to detect fairly large problems and to monitor only a few percent of the total Fast Offline productions. But even this level of QA is beneficial. In the following I will attempt to answer the most common questions about the shift work. Following this is a link to the relevent pages which you will need to become familiar with prior to your first week on shift in Run 13. Please note that new QA tools are available for routine use starting last year in Run 12. These new features enable all offline data files to be checked using automated algorithms. Information on this is included in the documentation pages for Run 13.
-
No programming skills, such as C++, are required. All the tasks are web based "point-and-click" activities. However, you should have valid RCF and AFS accounts since you may need direct access to the histogram postscript files or reference QA histograms.
-
General knowledge of the STAR detector, reconstruction methods and calibration issues are expected since the purpose of these shifts is to spot problems with the hardware and event reconstruction, or with the calibrations. Expert level knowledge is not required however.
-
All persons are required to be at BNL for their first week of Offline QA shift service. This is motivated by the fact that many unforeseen problems will very likely arise during these shifts and quick, real time help, which is more likely to be available at BNL, is essential to insure daily shift productivity.
-
Subsequent Offline QA shifts may be done from non-BNL sites provided adequate web access to the Auto QA system can be demonstrated from the remote site.
-
The offline QA shift may be done any time throughout the day but it is expected that a serious effort will require at least 8 hours a day.
-
There are no special QA training schools; the web based documentation is intended to fulfill such needs. But if you have further questions please send email to Lanny Ray, ray@physics.utexas.edu.
-
The Fast Offline QA shift work involves the following tasks, all of which are web based:
-
Fetch the latest set of Fast offline production jobs using the Auto QA browser and compare a standard set of histograms to a reference. Due to changing run conditions these reference histograms will not be ready until some reasonable data have been collected in the first week or so of the new run. With the new QA tools comparison with reference histograms is much more transparent than it is has been in the past.
-
Fill in a web based report form listing the jobs which have been QA-ed and giving detailed comments as needed. Summarize observed changes in hardware/software performance for the Fast Offline data and report directly to the three Shift Leaders and Period Coordinator on duty. Note that there is a "play" mode which can be used to practice using the QA Shift report form.
-
Provide a data/run quality summary based on the Online Run Log information and comments and the QA work.
-
Notify the appropriate people about suspected problems with the hardware, calibrations, production, or reconstruction software.
-
Check the Online-to-Offline data base migration using the "Database Migration Monitor" link on the first page of the QA browser after you login. When data are being taken the first several tables should appear in green font. If no data have been acquired for a day or so then all the tables should be in red. If there are any red fonts in the first several tables labelled "RunLog_onl" while data are being taken then this may indicate a problem and you should notify starqa-hn explicitly.
-
-
If you are not already subscribed to the 'starqa-hn' and 'starprod-hn' hypernews forums then please do so since this is the principal means for communicating with the production crew. See the HyperNews home page or select "hypernews" from the left panel on the STAR Home page. Follow the instructions for subscribing.
-
Lanny Ray and Gene van Buren will be available to assist and supervise the shift crew to insure that meaningful QA work is getting done.
Welcome aboard!
Lanny Ray, The University of Texas at Austin
February 20, 2013
STAR QA Documentation
Contacts:
Information, Requirements and Instructions for Fast Offline Quality Assurance Shifts for Run 25/26
Introduction and Requirements:
Welcome to the Final year of the STAR Fast Offline Quality Assurance Shift service. There are no new shift crew requirements or browser features for Run 25/26 compared to Run 24. Run 25 will be dedicated to Au+Au 200 GeV collisions for 20 weeks until the end of June 2025. There is a planned down time until mid-August when Run 26 begins featuring p+p collisions and possibly other species. The detectors for the forward physics program will be included. Last year (Run 24) the BSMD experts tested and developed QA histograms which we plan to use and examine in the fast-offline QA this year. Please familiarize yourself with the QA shift plots before starting your shift work.
The purposes of the Fast Offline QA shifts are to monitor the validity of the data, calibrations and event reconstruction from the full experiment and to provide near, real-time feed-back to the experiment as needed. An equally important purpose is to compile a record, in the form of reports, of QA issues associated with each run for later data filtering and diagnostics prior to physics analysis. From a practical standpoint it is only possible for Offline QA to detect fairly large problems, and in so doing we continue to strive to examine all of the data collected.
-
No programming skills are required. All the tasks are web based "point-and-click" activities.
-
Please use RACF's Mattermost Offline QA chat mechanism for recent QA information and updates and for communicating with the QA experts and with the detector experts during your shift. You may also send email directly to the QA experts or the detector experts. The STAR Mattermost Offline QA link is here: Mattermost.
-
General knowledge of the STAR detector, reconstruction methods and calibration issues are necessary because the purpose of this work is to spot problems with the hardware and event reconstruction, or with the calibrations. Expert level knowledge is not required however.
-
In the past, QA shift crew without previous experience were required to do their first QA shift week at BNL. However, due to travel limitations and on-site access restrictions the QA team is offering an online training video for collaborators who have not done QA shifts previously. Please notify Gene van Buren as soon as possible if you need this training. Good internet connection and access to the STAR web and protected areas are essential.
-
Subsequent Offline QA shifts may be done from non-BNL sites provided adequate web access to the Auto QA system can be demonstrated from the remote site.
-
The Offline QA shift may be done any time throughout the day but it is expected that a serious effort will require at least 8 hours a day.
-
Please refer to this and the other web based documentation as you prepare for the shift work and during your shift. If you have further questions please send email to Lanny Ray, ray@physics.utexas.edu and/or Gene van Buren.
Welcome aboard!
Responsibilities of the Fast Offline QA shift crew:
- Using the Automated QA browser review the QA Shift histograms for Fast Offline Data Production (highest priority) for all available runs which have not been examined for each trigger stream (st_physics and possibly others are expected in Run 25/26) and for each trigger group (e.g. general, minbias, high-tower, central etc.). You may combine the "general" QA results and the "Minbias" QA results into one report for each run number, trigger stream and trigger group.
- Complete a useful and informative Offline QA Shift report using a web-based form noting especially any and all suspected problems with the detectors, calibrations, and reconstruction. The report will be archived and the summary sent to 'starqa-hn' hypernews automatically. Please use the "play" mode if you are a first-time user to practice filling out the report.
- Review the Online Run Log and Electronic Shift Log book information and comments for each data run examined and summarize the Run/Data Quality status by marking the job as "Good" or "Bad." This will also indicate that the data have been examined by Offline QA. Jobs will normally be considered "Good" even when there are hardware outages or calibration/reconstruction issues. Please check with the QA experts before marking jobs as "Bad."
- Notify the appropriate experts and/or the QA contacts for any and all suspected problems with the detectors, calibrations, or fast-offline reconstruction.
Instructions for the Fast Offline QA Shift:
Getting Started:
- Go to the STAR Computing Offline QA home page on drupal (i.e. from the STAR Home Page select "Computing" in the left panel, then select "Offline QA" in the table row labelled "Production" or go directly to the Offline QA home page and open the Auto QA browser by clicking on the "Automated Offline QA Browser" button in the upper portion of the page. You will have to enter the STAR protected area username and password. Contact your local STAR council representative, Lanny Ray or Gene Van Buren if you do not know it.
- If the browser fails to open contact the QA Experts ASAP.
- Enter your RCF username.
- Select button 2.1 (shift work) and hit OK which takes you to the page where you may select data runs to examine. Note that for Run 25/26 the Offline QA shift crew are only responsible for the fast-offline production (button 2.1).
Selecting Data to examine:
- For the Fast Offline Production QA (Button 2.1) on the next page (Page 22) select the data grouping method using buttons (A) - (D). Generally the Auto-combined grouping is preferable as this combines all available files for the run to achieve the best possible statistics. Grouping method (C) allows the user to arbitrarily combine data from any of the available runs. Note that the ZDC coincidence rates are listed for each run/file sequence. Ideally multiple jobs should only be combined for similar ZDC rates as some QA histograms depend strongly on the amount of background and pileup which are affected by luminosity.
- Then select the job listing order (applies to data grouping options B and C only), the date and run number ranges and click OK.
- On the next page select the run (or the combination of runs for grouping option C) to be examined. Priority should be given to the most recent data that have not been examined yet. Click OK.
Examining the QA Histograms:
- The next page provides access to several new features available since 2012. You should examine all histograms visually, including all listed trigger groups, and file a report for each trigger group.
- There are numerous "Help" buttons, generally located in the upper-right of any given panel, which present instructional information in the context of what is being viewed at that moment.
- Automated QA testing is available and can be used, provided a suitable set of reference histograms are ready. These generally take about a week to load once stable physics data production and reconstruction have been achieved and are updated throughout the run period. If you wish to use the automated QA feature please select a reference data set which best matches the data conditions using the left arrow buttons to move from field to field.
- The default "QA Shift" histogram group is sufficient for shift work. However, the entire set of QA histograms can be selected with "All."
- Links to the Run Log and Electronic Shift Log book for the selected run are at the bottom of this panel.
- Select "Plots only" to view the data only, or "Analyze" to view both the data and reference and to get the results of the automated comparisons with the reference. This option can be used to easily compare the histograms to a reference and enables a convenient way to attach example histograms to QA issues (see instructions: www.star.bnl.gov/devcgi/qa/QAShiftReport/refHelp.php). Note that despite the use of automated examination tools the QA shift crew's visual evaluation of the data remains essential.
- After a hopefully brief wait the list of histograms appears. They may be viewed individually by selecting the "Examine" buttons on the right which will then display the plot with reference (if selected) and a written description.
- Selecting the "All+Plots" button on the left lists all the plots and references (if selected).
- For the "Analyze" option, failed histogram auto-comparisons are listed by default, but all histogram results may be selected in the left-hand panel; the results are color coded. If the auto-comparison option is used you must still examine the plots visually before completing the examination of the run.
- After examining the data, mark the run as examined by selecting the Good or Bad buttons on the left. Generally the data will be marked as Good but in extraordinary circumstances can be marked as Bad. Please consult with the QA team before marking any data as Bad.
- To return to the QA run selection page use the "Back to data selections" or "Back to QA options" buttons in the upper panel.
Special issues to watch for in Run 25; the following list may be updated throughout the run:
- General Histograms: Report dead TPC RDOs, dead/faulty anode wire grids, and RDO sections with large (~50% or more) outages. In general, do not report problems with individual FEEs or pads. However, if the number of bad FEE cards in the inner sectors (padrows 1-40) changes suddenly, or dramatically, then notify Richard Witt, Flemming Videbaek, and Irakli Chakaberia and include the incident in your QA shift report. The anode and RDO boundaries are marked on the plots. For dead RDOs there is no signal indicated by a blank white space. For dead/faulty anodes there is only noise or the color coded amplitude is substantially different from neighboring anode grids. Be sure to watch for anode voltage sags or outages that may have happened during the run but did not cause the run to be aborted. This issue is indicated by an unexpected, uniform drop (but not to zero) in the number of hits within the boundaries of an anode grid. The FMS histograms are for experts only - do not examine or report these.
- Trigger Group histograms -- trigger dependence: A few of the histograms are sensitive to the trigger(s) used to collect the events. StE**QaNullPrimVtxMult displays the number of good, missed and questionable primary vertices.
- Trigger Group histograms -- Luminosity dependence: High instantaneous luminosity increases pileup and the overall number of tracks in the TPC. The number of space points and global tracks will necessarily increase but their distributions in the detector should not change much. More subtle effects to watch for include: (1) signed DCA for global tracks, StE**QaGtrkSImpactT, which may be affected by the increased distortion in space point position caused by increased space charge accumulation. (2) global track slope versus position relative to primary vertex, StE**QaGtrkTanlzf, where tracks associated with the primary vertex lie along the main diagonal and pileup tracks fill up the rest of the plot (3) the ratio of primary to global tracks, StE**QaPtrkGlob, where this ratio will be distributed to smaller values when pileup increases. The average luminosity for each run will be provided by the QA browser and should be consulted when examining the histograms. Do not report the changes in the histograms described here if the run specific luminosity is high. When using the "Combine several jobs" option (C) you should avoid combining histograms from runs with widely varying luminosity as this will distort the distributions and make the QA examination more difficult.
- Trigger Group histograms -- For the distributions of energy clusters in the BEMC (BTOW and BSMD) do not report individual spikes or minor outages (few channels), but do report large sections of obviously excessive or reduced yields. The latter anomalies often indicate incorrect pedestal values which need to be updated by the experts.
- The MTD QA-Shift histograms display hits in the MTD. There are hit frequency and 2D plots for all hits and for hits matched to global TPC tracks. Report new outages in coverage, unexpected drops in the number of matched hits, or abnormal frequency distributions. Note that there are no MTD trays underneath the STAR magnet near both ends causing there to be reduced coverage for backlegs 12 through 20. The MTD will be included in Run 25.
- Watch for ETOF (end-cap time of flight), FTS and FCS histograms in Run 25. Information for QA evaluation of these additional histograms will be provided as these become available throughout the run.
Reporting the Results:
- Generally it is best to have the QA Shift Report web form open in a different window so you can fill it out as you check each set of histograms, job-by-job. Please follow the instructions on the QA shift web forms and supply all requested information about yourself and the jobs you have examined.
- If you have both the QA Browser and the QA Shift Report forms open in separate web browser windows, you may take advantage of the "New report entry" to populate a new entry in your Shift Report based on the data being viewed.
- After completing all the listed jobs add whatever comments you think are useful and appropriate to the QA Shift Report. Be sure to include a useful summary for Fast Offline Data that will be helpful to the shift crew, i.e. report any changes from the previous day including new problems or resolution of old problems. Note that the QA Issues mechanism of the web based QA shift report form automatically monitors day-to-day changes in these issues and lists them in the QA shift report summary that is mailed to starqa-hn.
- When new problems appear in the data please review the list of existing QA issues and use those if appropriate, before creating a new issue. Note that there is a key-word search tool to help you find previous, relevant issues. Please follow the naming convention established for the existing Run 25 issues. You are encouraged to document the issues with histograms using the browse/upload tool in the QA issues editor web page. The browser provides an easy way to grab and upload individual histogram plots (svg file type). Refer to the Help buttons on the new page and click "full topic list", then select "Grabbing a histogram image and attaching to an issue" for instructions - i.e. right click on the image, save to your computer, then in the QA issues page select "Image attachments" and upload your saved file.
- MOST IMPORTANT!!! If you suspect any problem with the detector(s), calibrations, reconstruction or production you must contact the appropriate expert(s). This is the primary reason for having the Fast Offline QA system and these dedicated shifts. The experts may be contacted via either the QA Experts or Other Experts web pages. For Run 25/26 the various QA and detector experts are: (update pending as of March 18, 2025)
-
BBC - Akio Ogawa
-
BTOF - Zaochen Ye
-
BEMC - Raghav Kunnawalkam Elayavalli
-
EPD - Rosi Reed
-
eTOF - Florian Seck
-
GMT -
-
TPC- Richard Witt, Irakli Chakaberia, Flemming Videbaek
-
HLT - Hongwei Ke
-
VPD - Daniel Brandenburg
-
Offline-QA - Lanny Ray + the current week's Offline-QA shift taker
-
LFSUPC conveners: Shuai Yang, Yue-Hang Leung, Zaochen Ye
- delegate: Ben Kimelman
-
CF and FCV conveners: Hanna Zbroszczyk, Nu Xu and Prithwish Tribedy, Subhash Singha, Zhenyu Chen, respectively.
- delegate: Takafumi Niida (BulkCorr)
-
PAC - Sooraj Radhakrishnan
-
TriggerBoard
-
S&C - Gene van Buren
-
Complete your QA Shift Report and submit it. The ASCII text version will be emailed to 'starqa-hn'.
-
Links to QA documentation, contacts, the Rcas/LSF monitor, Online Run Log, and the QA shift report web form are available from Page 2.
-
Finally, you are done for the day; go get some rest!
QuickStart Instructions for the Auto QA Browser - Run 13
- Note that you may at any time examine the available QA histograms. However, please do not MARK any runs (Good or Bad) unless you are performing your Offline QA shift duties.
- Go to the STAR Computing Offline QA home page on drupal (i.e. from the STAR Home Page select "Computing" in the left panel, then select "Offline QA" in the table row labelled "Production" or go directly to the Offline QA home page and open the Auto QA browser by clicking on the "Automated Offline QA Browser" button in the upper portion of the page. You may have to enter the STAR protected area username and password. Contact your local STAR council representative or me if you do not know it.
- If the browser fails to open contact the QA Experts ASAP. If you cannot get to the Auto QA browser then you are S.O.L.
- Enter your RCF login name.
- Generally you should follow the menu on page 2. Buttons 1.1 and 2.1 direct you to pages where Real Data Production jobs and Fast Offline Production jobs can be selected. Note that for Run 13 the Offline QA shift crew are only responsible for the fast-offline production (button 2.1) and monitoring database migration (button 2.3).
- At the beginning of your shift please check the status of the online-to-offline database migration and notify the QA experts and QA hypernews if the migration appears to be stalled.
- For Real Data Production (Button 1.1) you will typically want to filter out previously reviewed jobs and select all other run numbers for production within the past 24 hours. Queries can be made based on QA status, run number or date, and software production version.
- For the Fast Offline Production QA (Button 2.1) on the next page (Page 22) select the data grouping method buttons (A) - (D) [for p-p data the "Auto-combined" or "Combine several jobs" options are preferred in order to have sufficient statistics]. Select the job listing order (for options B and C), the date and run number ranges and click OK. At a minimum please examine QA histograms for each trigger set for at least one file sequence per run number. Do more if you have time.
- On the next page select the run to be examined with priority given to the most recent data that have not been examined and click OK.
- The next page displays the new features available starting in 2012. There are many buttons and options which the user should explore and test throughout the shift. Note that there are many Help buttons available. To get started: (1) select a reference data set which best matches the real data using the left arrow buttons to move from field to field (note that it is not required to have a reference), (2) select the plot option (none = svg format, pdf or ps), (3) select the QA histogram set to examine (QA Shift - required, or for more details see the TPC sectors but note that the TPC sector displays are included in the QA Shift plots, ALL, or among several subsystems), (4) select "Plots only" to view the data only, or "Analyze" to view both the data and reference and to get the results of the automated comparisons with the reference. This option can be used to easily compare the histograms to a reference and enables a convenient way to attach example histograms to QA issues (see instructions: www.star.bnl.gov/devcgi/qa/QAShiftReport/refHelp.php). Note that despite the use of automated examination tools the QA shift crew's visual evaluation of the data remains essential.
- The next window lists the QA histograms which may be viewed singly or all together along with the reference. Selecting the "Examine" buttons on the right displays the single plot and reference with a written description. Selecting the "All+Plots" button on the left lists all the plots and references. For the "Analyze" option failed histogram auto-comparisons are listed by default, but all histogram results may be selected in the left-hand panel; the results are color coded. Please do not rely on the algorithmic comparisons just yet. To return to the QA run selection page you must use the "Back to data selections" or "Back to QA options" buttons in the upper panel.
- After examining the data mark the run as examined by selecting the Good or Bad buttons on the left. Generally the data will be marked as Good but in extraordinary circumstances can be marked as Bad. Please consult with the QA team before marking any data as Bad.
- Generally it is best to have the QA shift report web form open in a different window so that you can fill it out as you check each set of histograms, job-by-job. Please follow the instructions on the QA shift web forms and supply all requested information about yourself and the jobs you have examined.
- After completing all the listed jobs add whatever comments you think are useful and appropriate to the QA Shift Report. Be sure to include a useful summary for Fast Offline Data that will be helpful to the shift crew, i.e. report any changes from the previous day including new problems or resolution of old problems. Note that the QA Issues mechanism of the web based QA shift report form automatically monitors day-to-day changes in these issues and lists them in the QA shift report summary that is mailed to starqa-hn.
- When new problems appear in the data please review the list of existing QA issues and use if appropriate before creating a new issue. Note that there is a key-word search tool to help you find previous, relevant issues. Please follow the naming convention established for the existing Run 13 issues. You are encouraged to document the issues with histograms using the browse/upload tool in the QA issues editor web page. The browser provides an easy way to grab and upload individual histogram plots (svg). Refer to the Help buttons on the new page and click "full topic list", then select "Grabbing a histogram image and attaching to an issue" for instructions - i.e. right click on the image, save to your computer, then in the QA issues page select "Image attachments" and upload your saved file.
- MOST IMPORTANT!!! If you suspect any problem with the detector(s), calibrations, reconstruction or production you must contact the appropriate expert(s). This is the basic reason for having the Auto QA system and these dedicated shifts. The experts may be contacted via either the QA Experts or Other Experts web pages.
- Complete your QA Shift Report and submit it. The ASCII text version will be emailed to 'starqa-hn'.
- Links to QA documentation, contacts, the Rcas/LSF monitor, Online Run Log, and the QA shift report web form are available from Page 2.
- Finally, you are done for the day; go get some rest!
STAR QA Documentation
Lanny Ray, University of Texas at Austin
June 11, 2002
Last Update, January 18, 2011
Index
-
Information for the Fast Offline QA Shift Crew for Run 11
- Information for Fast Offline QA Shifts - Run 11
- Summary of Fast Offline QA Shift Duties - Run 11
- QuickStart Instructions for the Auto QA Browser - Run 11
- Fast Offline QA Histogram References and Descriptions
- Fast Offline QA Shift Report Preparation and Instructions for Run 11
- Offline QA Shift Report Web Based Form
- Manual generation of QA histograms
-
General References
-
List of Contacts
-
QA Documents for Previous Runs
- Link for Runs 2 - 7
- See child pages below for other Runs (after 7, but prior to current Run)
-
Technical Documentation
STAR QA Documentation
Lanny Ray, University of Texas at Austin
June 11, 2002
Last Update, Feb. 7, 2014
Index
-
Information for the Fast Offline QA Shift Crew for Run 14
-
General References
-
List of Contacts
-
QA Documents for Previous Runs
- Link for Runs 2 - 7
- See child pages below for other Runs (after 7, but prior to current Run)
-
Technical Documentation
Summary of Fast Offline QA Shift Duties - Run 13
- Using the Automated QA browser review in detail the set of histograms for the Offline QA Shifts for Fast Offline Data Production (highest priority); the minimum requirement is 1-2 file sequences or 'jobs' per Experiment Run ID number and trigger collection, e.g. st_physics, st_mtd, st_upsilon, minbias, high tower, etc.
- Note that for p-p the "Auto-combined" or the "combine several jobs" option is recommended in order to get enough statistics. The new presentation format for the QA histograms, introduced in Run 12, will continue to be used in Run 13.
- Complete a useful and informative Offline QA Shift report using a web-based form noting especially any and all suspected problems with the detectors, calibrations, and reconstruction. The report will be archived and the summary sent to 'starqa-hn' hypernews automatically. Please use the "play" mode if you are a first-time user to practice filling out the report.
- Review the Online Run Log information and comments for each real data production job you examine and summarize the Run/Data Quality status based on the Run Log information and the QA examination results by marking the job as "Good" or "Bad." This will also indicate that the data have been examined by Offline QA. Jobs will normally be considered "Good" even when there are hardware outages or calibration/reconstruction issues. Please check with the QA experts before marking jobs as "Bad."
- Notify the appropriate experts and/or the QA contacts for any and all suspected problems with the detectors, calibrations, or fast-offline reconstruction.
- Check the Online-to-Offline data base migration using the "Database Migration Monitor" link on the first page of the QA browser after you login. When data are being taken the first several tables should appear in green font. If no data have been acquired for a day or so then all the tables should be in red. If there are any red fonts in the first several tables labelled "RunLog_onl" while data are being taken then this may indicate a problem and you should notify starqa-hn explicitly.
STAR QA for Offline Software
Peter Jacobs, LBNLJuly 7, 2000
Index
- Introduction
- Database Content and Operations
- Starting Display and Data Selection
- Viewing Run Information
- Run Details
- QA Details
- Files and Reports
- Compare Similar Runs
- Automated QA and Automated Tests
- Current scalars and tests
- Expert's page
- PERL, Object Oriented PERL, and CGI.pm
- Introduction
- What is QA in STAR?
The goal of the QA activities in STAR is the validation of data and
software, up to DST production. While QA testing can never be
exhaustive, the intention is that data that pass the QA testing stage
should be considered highly reliable for downstream physics
analysis. In addition, QA testing should be performed soon after
production of the data, so that errors and problems can be caught and
fixed in a timely manner.
QA processes are run independently of the data taking and DST production. These processes contain the accumulated knowledge of the collaboration of modes of failure of data taking and DST production, along with those physics distributions that are most sensitive to the health of the data and DST production software. The results probe the data in various ways:
- At the most basic level, the questions asked are whether the data can be read and whether the all the components expected in a given dataset are present. Failures at this level are often related to problems with computing hardware and software infrastructure.
- At a more sophisticated level, distributions of physics-related quantities are examined, both as histograms and as scalar quantities extracted from the histograms and other distributions. These distributions are compared to those of previous runs that are known to be valid, and the stability of the results is monitored. If changes are observed, these must be understood in terms of changing running conditions or controlled changes in the software, otherwise an error flag should be raised. (Deviations are not always bad, of course, and can signal new physics: QA must be used with care in areas where there is a danger of biasing the physics results of STAR.)
STAR will produce hundreds of terabytes of data each year. Meaningful testing of the DSTs produced from these data is a daunting task, entailing an enormous amount of tedious repetition. This process must be automated to a very high degree, for reasons both of reliability and finite capacity of even the most dedicated grad student to do boring but important things. The web pages you are looking at are part of an automated framework for QA and testing, called autoQA.
- Varieties of QA in STAR
The focus of the QA activities until summer 2000 has been on Offline
DST production for the DEV branch of the library. With the inception
of data taking, the scope of QA has broadened considerably. There are
in fact two different servers running autoQA processes:
- Offline QA. This web page accesses QA results for all the
varieties of Offline DST production:
- Nightly tests of real and Monte Carlo data (almost always using the DEV and NEW branches of the library). This is used principally for the validation of migration of library versions
- Large scale production of real and Monte Carlo data (almost always using the PRO branch of the library). This is used to monitor the stability of DSTs for physics.
- Online QA (old). This web page accesses QA for data in the Online event pool, both raw data and DST production that is run on the Online processors.
- Offline QA. This web page accesses QA results for all the
varieties of Offline DST production:
- Overview of autoQA framework
The autoQA framework consists of a set of CGI scripts written in PERL, which
perform the following tasks:
- Data Catalogue: Maintain a database of all production and test datasets of real and MC data, together with a performance summary of each run: what was run, completed successfully or not, run time errors and diagnostics, memory and cpu usage, etc. New runs are added to the database by querying the Files Catalog in Offline and the Event Pool summaries in Online. The update queries occur automatically via cron jobs, with a frequency that is dependent upon the kind of data in question: they will be very frequent for Online data (say, every 10 minutes), less so for the nightly tests of MC data (say, once a day). These are parameters that will be adjusted as we gain expeience with the system and how it is used.
- Automated running of QA macros: Run a set of QA ROOT macros on the dataset, report the results, and catalogue them in the database. The QA macros generate postscript files of histograms or ascii files containing scalars relevant to QA, both event-wise and run-wise scalars. The specific macros to be run may depend upon the nature of the data being analysed (real vs simulated, cosmic, calibration, etc.)
- Examination QA macro output: The autoQA-generated web page facilitates access to the histograms and scalars resulting from running the QA macros. In addition, the comparison of different runs is possible by building comparison tables of scalars, which for instance allow the user to track physics-related qunatities (number of primary tracks, V0s, etc) of similar runs as a function of time.
- Automated QA Evaluation: Following the running of the QA macros, the autoQA system can run a set of defined tests on the scalars generated by the QA macros, highlight scalars that fall outside of expected ranges ("cuts") by raising error and warning flags, and record the results in the QA database. The tests that are applied can depend upon the nature of the data being analysed, and the specific cuts of the tests can vary as needed. Which tests and what cuts to apply to a given data set are quite complex questions. If done well and kept current with the data being examined, this facility can serve as a reliable automated mechanism to validate the data, which is the ultimate goal of autoQA. If not done well, this facility can be misleading and not catch critical errors. Thus, for the time being (summer 2000), no automated tests will be applied to data generated in large scale production of real data. Once we gain experience with the system and understand how to test for stability, we will (slowly) introduce automated tests. Until that time, QA decisions will have to be made entirely by humans (that means you) looking at histograms and the time development of scalar quantities.
The autoQA-generated web pages present these data in a heirarchical fashion, with the most important information most prominently displayed. Go to the upper frame window and choose a data class from the pulldown menu in the banner. The resulting selection menus will depend upon the data class chosen, and correpsond closely with the Offline File Catalog that is maintained by the production team. Using the pulldown menus, choose an interesting subset of all catalogued data and press the "Display Datasets" button. The datasets available in the QA database satisfying the selection are listed in reverse chronological order, with details about the run submission, status of the data on disk, and a very brief performance summary given in the first three columns. The "QA Status" and buttons on the right hand side are described below.
The scalars and histograms are generated by ROOT macros running in the standard STAR framework. Description of the QA macros run in Offline can be found here. (July 8,2000: Online macros still to be defined.) The developers responsible for the macros can be found on the STAR QA links and contacts. The autoQA cron jobs automatically run thes macros and submit them as batch jobs to RCAS under LSF for Offline, and as daughter processes on the Online cluster for Online.
The framework has been written so that the addition of new macros is straightforward. No changes to the CGI scripts are needed to introduce new macros which produce postscript files. A single PERL subroutine needs to be added for a new macro which generates an ascii file of scalars which parses the file, extracts the QA scalars and puts them into some defined PERL structures.
Two kinds of QA scalars are defined: run-based and event-based. The run-based scalars characterize the run as a whole (for instance, the mean, rms, minimum and maximum number of tracks per event in the run). The event-based scalars characterize each individual event (the number of TPC hits in each event, is such-and-such a table is present in this event, etc.) As has been pointed out by a number of people, the "scalars" may also be the result of statistical tests (such as a chisquared or Kolmogorov test) comparing a histogram from the selected run to a reference histogram.
In addition to running QA ROOT macros to generate the scalars and histograms, the Offline Software QA framework can apply Boolean tests to an arbitrarily large set of scalars generated by these macros. (This is defined above as Automated QA Evaluation.) These tests will be of greatest use in probing the self-consistency of large scale production, but can also be used to detect changing conditions in the nightly and weekly test results. The results of all tests for each QA macro applied to a given run are summarized in the run listing table under "QA Status" . Details about the scalars and tests can be displayed via the "QA details" button (explained further below). are especially welcome.
The time dependence of QA scalars can be viewed via the "Compare similar runs" button. The question of what data to compare meaningfully is non-trivial for real data, especially if multiple triggers are present in a single run (for Monte Carlo data the comparisons are more straightforward). This facility will undergo changes as we gain experience. An important future extension of this will be to develop ROOT macros to superimpose histograms from a reference run on the QA histograms for each selected run.
Functionality that modifies the QA database entries (performing updates, running the QA macros, etc.) is hidden in a password-protected Expert's page.
- What is QA in STAR?
The goal of the QA activities in STAR is the validation of data and
software, up to DST production. While QA testing can never be
exhaustive, the intention is that data that pass the QA testing stage
should be considered highly reliable for downstream physics
analysis. In addition, QA testing should be performed soon after
production of the data, so that errors and problems can be caught and
fixed in a timely manner.
- Database Content and Operations
-
What is the QA database?
The QA database is a MySQL database containing all datasets that have
been registered by autoQA. The QA database utilizes a supplementary
"disk-based DB", a UNIX directory tree containing the files generated
by the ROOT macros and the various autoQA processes. Each dataset is
assigned a unique database key, which serves as the name of the
subdirectory containing all files related to this run. There are
several types of files in each subdirectory. The casual user need not
know anything about these files: an important function of the CGI
scripts is to present their contents to the user's web browser in
digestible ways. However, for completeness, the files are:
- logfile_report.obj: summary of the run, generated by parsing the log file when the run is entered into the database. It is present for all runs in the database. Format is internal to PERL, not human-readable.
- StError.txt, StWarning.txt: ascii files containing all strings written to log file by StMessageMaker within bfc. These are currently filled with many messages besides important errors and warnings and a general cleanup of user code should occur for this facility to be more useful in flagging real errors.
- files of type .qa_report: Ascii file generated by each QA macro that produces acsii output of QA information. Filename is name of the macro.
- files of type .ps.gz: Gzipped versions of postscript files generated by QA macros such as bfcread_hist_to_ps. Filename is name of macro. Links to these files are presented to the browser when QA Details are viewed.
- files of type .evaluation: The result of Automated QA Evaluation applied to the qa_report output of one QA macro. Format is internal to PERL, not human-readable.
- QA database updates Updating the QA database is carried out manually from the Expert's page or by means of a cron job (see your favourite UNIX manual). The updating process examines the Offline File Catalog (for Offline) or the Event Pool (for Online), looking for datasets that have not yet been catalogued. Date and time of the last update are given in the upper panel, under the "Display selected dataset" button. If an update job is in progress, blue text will indicate that immediately below this message. Frequency of update will depend upon the class of data, and will vary from once every few minutes (for Online) to once a day (for nightly MC tests).
-
What is the QA database?
The QA database is a MySQL database containing all datasets that have
been registered by autoQA. The QA database utilizes a supplementary
"disk-based DB", a UNIX directory tree containing the files generated
by the ROOT macros and the various autoQA processes. Each dataset is
assigned a unique database key, which serves as the name of the
subdirectory containing all files related to this run. There are
several types of files in each subdirectory. The casual user need not
know anything about these files: an important function of the CGI
scripts is to present their contents to the user's web browser in
digestible ways. However, for completeness, the files are:
- Starting Display and Data Selection
Selecting a data class in the web page banner generates a set of
additional pulldown menus, in general dependent upon the data class,
which specify the various subsets of data available. These additional
pulldown menus are used to form a query to the QA Database, which is
submitted by pushing the "Display Datasets" button. Upon return, all
datasets in the QA database that satisfy the DB query are displayed in
the upper frame.
The Expert's Page button generates a request for the expert's pw, which in turn will display numerous buttons that control and change the DB, launch batch jobs, etc.
The button labelled "Add or Edit Comments" generates a request for your name. It will enable buttons associated with individual datasets, along with a button labelled "Add global comment". You will be able to enter comments that will be interspersed with the dataset listings. The global comments will have a specific date and time and will appear in chronological order with the datasets. These allow the user to indicate library changes, specific problems associated with a given dataset, etc. Usage of the Comment feature is quite simple and (hopefully) self-evident.
RCAS/LSF monitor: this is a link to a general utility monitoring all LSF activity on RCAS. It is a PERL/CGI wrapper around LSF commands such as "bsub" and "bpeek". Only expert users will only be able to manipulate LSF jobs,and then only jobs submitted by user "starlib".
- Viewing Run Information
The dataset display in the upper frame has five columns, labelled "Data
Set", "Created/On disk?", "Run Status", "QA Status", and an unlabelled
column containing action buttons which are described in detail in
following sections. This display can be refreshed at
any time by pushing the "Display Datasets" button.
- Data Set Displays basic information about the dataset, such as Job ID (for DSTs), where the DST resides (or resided) on disk, the STARLIB version and STAR Library level, as extracted from the log file, etc.
- Created/On disk? Displays the date and time of submission of the run and whether it resides on disk at the moment.
- Run status Displays basic performance-related information about the run, extracted from the log file. Reports whether the run completed succssfully or crashed, error conditions such as segmentation fault, the number of events completed, the number of events requested, and the specific event sequence requested from the input file. Reports whether all data files that should be generated by the production chain are present in the directory. (The file of type .hist.root might exist but not contain the relevant histograms, which is indicated by its size being much smaller than a correct .hist.root file. This condition is also reported as a missing .hist.root file.)
-
QA status
If a dataset has been added to the catalogue but the QA macros have
not yet been run, this column displays "QA not done". Otherwise,
displays the date and time that QA was carried out, and succint
information from each QA macro that was run. Reports if macro crashed
(this should be rare). If Automated QA
Evaluation has been done, reports "o.k." if all tests passed,
otherwise reports number of errors and warnings generated.
If QA for this run has been initiated but not completed (from the Expert's page), blue text will indicate that a QA batch job is in progress.For Offline, a link will be given to "peek" at the batch job in progress. If the batch job has completed, a link will be given to the log file from the batch run (useful for diagnosing macro crashes).
-
Run Details
Shows detailed run information extracted from the log file: run setup
information, including the options selected, CPU usage, and memory usage
-
QA Details
This button displays in the lower frame links to histogram files
generated by various QA macros. The format is gzipped postscript and
the name of the file indicated the macro that generated it. Physical
location of the files is given for reference, but clicking on the link
will open the file. This should open quickly even at remote
sites. Your browser should be configured to open .ps files using a
recent version of ghostview that automatically gunzips a gzipped file.
The generated scalars and results from the Automated QA Evaluation can be displayed in a separate browser window (by pushing a button with an obvious label, situated below the listing of the ps files). There is a large volume of information to present here, of varying general interest and importance. The run-based scalars tend to be more important for physics QA than the event-based scalars, and so are highlighted in the order of display. QA tests that fail are likewise highlighted over those that succeed. The display is divided into several sections:
- Run-based scalars, errors and warnings: Run based scalars (see overview) are presented for each QA macro for which they are defined, together with the automated tests that failed and generated an error or warning. The tests are labelled by short strings and are defined in more detail farther down the display. See current scalars and tests.
- Event-based errors and warnings: Same as previous section, but for event-based scalar tests that generated errors and warnings. The actual scalar values are not given here. Event-based scalars are tabulated for each event and there may be many of them in total. Their values can be found in the tables of all QA tests applied, farther down the display.
- Run-based tests (all entries): displays all QA tests applied to run-based scalars for each macro. Display shows each boolean test string, severity if failed (error or warning), and result (TRUE or FALSE). Failed tests are highlighted in red.
- Event-based tests (all entries): displays all QA tests applied to
event-based scalars for each macro. Display shows each boolean test
string, severity if failed (error or warning), and result (TRUE or
FALSE). Failed tests are highlighted in red.
-
Files and Reports
The table shows all files in the given production directory,
together with their size and date of creation.
The remaining sections display:
- Logfile: a link is given to the log file for the run. Check the size of the logfile before opening it: the largest log files can exhaust the virtual memory of your PC.
- StWarning and StError files: ascii files containing all instances of StWarn and St Error in the log file.
- Control and Macro Definition files: links to the specific control and macro definition files used for QA. Physical location of the files is given for reference, but clicking on the link will open the file. These files define the QA macros to be run, the run and event based scalars to extract, and the automated QA tests and specific cuts to apply. Each run has one control file and one or more macro definition files, which may be valid only for a specific event type (central collisions, cosmics, etc.), time period, or sequence of library versions
- Postscript files: links are given to all postscipt files generated by the QA macros. These are the same as the links given under "QA histograms" on the "QA details" page.
- Other files: shown only on the Expert's page. All files (other than of type .ps.gz) that are in the QA Database subdirectory for this run are displayed. Links are provided to ascii files (this excludes files of type .evaluation).
-
Compare Similar Runs
This display is proving to be fruitful for QA, but see the warning in
the Overview section concerning the difficulty of defining which runs
to compare meaningfully for real data (as opposed to Monte Carlo
data). The run-based scalars of the current run are presented in a
table with those of other runs, to investigate their time dependence.
The user is first given the option of comparing to multiple similar runs, or comparing to a predefined reference. The latter capability is not yet implemented, however, and the user will be redirected to the former. For nightly MC, "similar" currently means the same TPC simulator (tfs, tss or trs) and geometry (year_1b or year_2a). For real data, the selection criteria are not yet established (July 8, 2000).
After clicking on "Compare to Multiple Reports", the display in the lower frame shows all catalogued runs that are "similar" to the current run (which is listed first and labelled as "this run"), with check boxes to select the comparison runs. Multiple comparison runs are permitted, and judicious selection can give a useful display of the time dependence of the scalars. After selecting the comparison runs, push "do run comparison".
All comparisons runs are listed in a table and are assigned an arbitrary letter label for convenience. The remaining tables show a comparison of run-based scalars for each of the QA macros that was applied to the selected run, first the difference in value of each scalar relative to that for the selected run, and then the absolute values themselves (these tables obviously display the same information). Comparison runs with no valid entries for a given scalar value (macro wasn't run or it crashed) do not appear. If only some entries are valid, the remainder are given as "undef".
For convenience when writing the QA summary reports, the tables in this display are also written to an ASCII file, whose name is given near the top of the display.
In the near future a histogram comparison facility will be developed, automatically plotting the QA histograms for the selected run and one reference run on the same panel.
- Automated QA and Automated
Tests
In this documentation, I have tried to use the following definitions
consistently (see also overview):
- Automated QA: Running a set of QA root macros on the production files.
- Automated Testing: Apply a set of cuts to the QA scalars generated by these macros.
The appropriate set of tests to apply, and in the case of numerical comparisons, the actual values to compare to, are often dependent upon the specific class of event under consideration. Simulated events from event generators require different tests than cosmic ray events, and there will of course be many different classes of real data with different properties. The selection of the appropriate set of QA macros and tests to apply to a given run is done by means of a "Control File", which specifies "Macro Definition files", one for each QA macro to be applied. Each event class has a Control File. The detailed format and syntax of these files is discussed below.
-
Automated Tests
Examples of tests on QA scalars are:
- is Table X present in each event on the dst?
- are there tables present in any event that are not expected for this class of data?
- is the number of entries for Table X equal to those for Table Y in all events?
- is the mean number of tracks per event within a given window for this run?
-
Details of Control and Macro Definition files
- Control File: This file contains a set of names of Macro
Definition files, one per line. Lines beginning with a pound sign
("#") are comments and blank lines are ignored. All other lines are
understood to contain a file name, which should begin in the first
column. As an example:
#
# control file for year 2a nightly MC tests
#
# lines with "#" in first column are comments
# all other non-blank lines should contain a test file with full pathname for one macro
#
#--------------------------------------------------------------------------------
/star/rcf/qa/nightly_MC/control_and_test/bfcread_dstBranch/hc_std.year_2a.v1.test
/star/rcf/qa/nightly_MC/control_and_test/bfcread_eventBranch/hc_std.year_2a.v1.test
/star/rcf/qa/nightly_MC/control_and_test/bfcread_Branch/geantBranch.year_2a.v2.test
/star/rcf/qa/nightly_MC/control_and_test/bfcread_Branch/runcoBranch.year_2a.test
/star/rcf/qa/nightly_MC/control_and_test/bfcread_Branch/tagsBranch.v2.test
/star/rcf/qa/nightly_MC/control_and_test/bfcread_hist_to_ps/QA.test
etc.
is the current control file for nightly MC test runs with year_2a geometry. - Macro Definition files: Here is (part of) the file
QA_bfcread_dst_tables.year_1b.v1.test:
macro name: $STAR/StRoot/macros/analysis/QA_bfcread_dst_tables.C
macro arguments: nevent=1 infile outfile
input data filetype: .dst.root
first starlib version: SL99a
last starlib version: SL99z
macro comment: Test of First Event Tables
end of header:
run scalars: globtrk globtrk_aux globtrk2 primtrk primtrk_aux
run scalars: vertex dst_v0_vertex ev0_eval dst_xi_vertex kinkVertex
run scalars: particle
run scalars: point dst_dedx g2t_rch_hit
run scalars: TrgDet
run scalars: event_header event_summary monitor_soft
BEGIN TEST:
run test name: Table exists
test comment: Check that table is present in first event
error: globtrk .found.
error: globtrk_aux .found.
... some text removed ...
error: dst_dedx .found.
error: monitor_soft .found.
END TEST:
BEGIN TEST:
run test name: Row in range
test comment: Check that number of rows within reasonable range
error: globtrk .gt. 8600
error: globtrk .lt. 9000
error: globtrk_aux .eq. globtrk
... some text removed ...
error: monitor_soft .eq. 1
error: dst_dedx .eq. globtrk
END TEST:
BEGIN TEST:
run test name: Unexpected Tables
test comment: Check for unofficial tables present (not declared as test scalars)
error: nonscalar .notfound.
END TEST:
The file is divided into:
- a mandatory header, which defines the macro name, arguments,
input data filetype, valid starlib versions (not yet checked against),
and a further comment that will be displayed on the "QA Details"
page. In the macro name, note the presence of the environment variable
$STAR. If this is given rather than an absolute path name, the macro will be run under the same library version as the production was run (the version is extracted from the log file). - an optional declaration of expected scalars. In this case only run-based scalars are declared, but event-based scalars can be declared in a similar way. The appropriate scalars must be declared if a test is defined.
- optional test definitions. Tests can be "run tests" (for testing run-based scalars) or "event tests" (for testing event-based scalars). Test name is mandatory, comment is optional. The Boolean tests are given one per line. A line such as
error: globtrk .lt. 9000
is understood as testing that the scalar value "globtrk" (the number of global tracks in the first event) is less than 9000; if it is not, an error is reported. In other words, the format is severity: string, where a failure (with the given severity) is reported if the string is false.
There are special cases built in (such as the scalar nonscalar appearing in the last test of the example), some of which are proving to be more useful than others. I will not try to give a full specification of the test language here - that would quickly become obsolete. This "metalanguage" is of course defined by the QA perl scripts themselves, and it will change and develop as needed (insert the usual boilerplate about backward compatibility here). If the existing examples are not sufficient for your application, you should contact me, but if you are at that level of detail, you probably already have done so.
- Control File: This file contains a set of names of Macro
Definition files, one per line. Lines beginning with a pound sign
("#") are comments and blank lines are ignored. All other lines are
understood to contain a file name, which should begin in the first
column. As an example:
-
Adding new macros
The steps currently needed to add a new macro are:
- Create the appropriate macro definition files for the new macro.
- Modify the control files for the relevant event types.
- If scalars are defined, modify the PERL module
QA_macro_scalars.pm by adding a subroutine with the same name
as the macro. This subroutine should parse the report file generated
by the macro (file of type .qa_report)
and return references to two hashes containing the scalars (this is
PERL-speak):
sub new_macro_name{
  %run_scalar_hash = ();
  %event_scalar_hash = ();
... do some stuff...
  return \%run_scalar_hash, \%event_scalar_hash;
}
A minimal example is sub QA_bfcread_dst_tables in QA_macro_scalars.pm, but if you don't understand PERL, you won't understand the example. A more complex example is sub doEvents in the same file, but the complexity of this routine is driven by the comparison of QAInfo reported to STDOUT by doEvents to the same lines in the logfile for the same events, and this is not applicable to other macros.
The PERL scripts have been almost completely decoupled from the specific content of the existing QA macros, making the addition of new macros to the QA processing rather easy. As noted, the only PERL programming needed to add a new macro is the addition of a single subroutine to QA_macro_scalars.pm, and only in the case that scalars are defined (i.e. a new macro that only generates a postscript file of histograms does not require any change to the PERL scripts, only to the relevant Control and Test files).
-
Current scalars and tests
The current (Sept 99) scalars and Automated QA tests that are applied are for each macr
o are:
- doEvents:
- Run-based: Run-based scalars are quantities such as tracks_mean, tracks_rms, tracks_min and tracks_max, which are the mean and rms of the number of tracks per event, and the minimum and maximum per event over the run. See a Macro Definition file for doEvents for the full list. There is one test on these scalars, called Run stats in range, which checks each scalar against expected values.
- Event-based: No event-based scalars are defined. However, an event-based test called Compare to Logfile, that is particular to doEvents, is defined. This test checks the strings written by the message manager in doEvents ("qa" = "on") against those written in the same event to the logfile during production. The test is that the number of tracks, vertices, TPC hits, etc., reported during production are the same as those read from the DST by doEvents, verifying the integrity of the DST and the reading mechanism. You will be pleased, but not surprised, to learn that no errors of this kind have been detected, but we will continue to check.
- QA_bfcread_dst_tables: QA_bfcread_dst_tables is Kathy's standard
QA macro, which reports the number of rows for each table in the first
event of the run. These scalars are defined as run-based for the QA
tests. Tests on these scalars are:
- Table exists: checks that all tables that are officially expected for a given class of event (year_1b vs. year_2a) are present in the first event
- Row in range: similar to test "Run stats in range" in doEvents, and highlights same problems. Checks that the number of rows for each table in the first event of the run is within some window or equal to the number of rows of another table.
- Unexpected Tables: checks that there are no tables in the first event that are not officially expected.
- doEvents:
-
Expert's page
The Expert's page is a password protected page, containing the
standard display plus functions that affect the content of the
database. I will not detail all the functionality in the Expert Page
here. If you are expert enough to want the Expert's password, you will
have contacted one of the developers and found out how to determine
the functionality of the various buttons yourself.
-
PERL, Object Oriented PERL, and CGI.pm
"CGI" stands for "Common Gateway Interface", and refers to the
standard internet protocol for dynamically generating web pages by
running "CGI scripts" which respond to user actions. When you purchase
a book from Amazon.com, the web server is running a CGI script that
responds to your search and purchase requests and sends your purchase
details to literally hundreds of web-based merchants, who then target
their advertising banners straight at you. CGI scripts can be written
in various languages, but PERL is a
well established industry standard for writing CGI scripts, is freely
distributed, has extensive documentation, support and software
available over the web and from the standard sources, and appears to
be the right choice for writing the QA CGI scripts.
PERL is an outgrowth of the UNIX csh and ksh scripting languages you may be familiar with. It is an interpreted language, and among its other uses it is very suitable for writing the kinds of scripts that used to be written in csh and ksh. PERL scripts are also in principle portable beyond UNIX, though that in fact depends upon how you write them. PERL is much more elegant, intuitive, and pleasant to write and read than csh or ksh, and has some very clever features that can make the meaning of the code quite transparent (if you speak the lingo). In addition, it has a very nice Object Oriented extension that I found to be absolutely essential in writing the QA CGI scripts. The overhead to learn OO programming in PERL is rather modest.
I found two books to be indispensable in learning PERL and writing PERL scripts, both published by O'Reilly (the "In a Nutshell" people):
- Programming PERL, by Wall, Christiansen and Schwartz
- The PERL Cookbook, by Christiansen and Torkington
An extensive PERL module has been developed for writing CGI scripts. It is called CGI.pm, written by Lincoln Stein at Cold Spring Harbor Lab, just down the road from BNL. I also found this to be extremely valuable: it hides all the html details behind a very convenient interface, allowing you to, for instance, generate quite complex tables in a few program lines. The scripts are very much cleaner and have fewer bugs as a result. The CGI.pm web page gives a tutorial and extensive examples. There is a book by Stein called "Official Guide to Programming with CGI.pm", published by Wiley. I found it to be of less use than his web page.
-
Modification History
webmaster Last modified: Sat Jul 8 17:42:20 EDT 2000
STAR QA links and contacts
STARQA Hypernews forum: archive
send mail to starqa-hn@www.star.bnl.govAutoQA infrastructure:
Gene Van BurenQA Shift Report web-based forms:
Gene Van BurenROOT QA macros:
Gene Van BurenWhining and complaining:
Lanny RayLanny Ray
Last modified: Fri Nov 12 12:11:47 EDT 2004
Summary of Fast Offline QA Shift Duties - Run 8
- Review in detail the set of histograms for the Offline QA Shifts for Fast Offline Data Production (highest priority); the minimum requirement is 1-2 file sequences or 'jobs' per Experiment Run ID number and trigger collection, e.g. st_physics, st_mtd, st_upsilon, minbias, high tower, etc.
- Write a useful and informative Offline QA Shift report using a web-based form noting especially any and all suspected problems with the detectors, calibrations, and reconstruction. The report will be archived and the summary sent to 'starqa-hn' hypernews automatically.
- Press the "MARK" button for all fast offline data runs you examined while on shift.
- Notify the appropriate experts and/or the QA contacts for any and all suspected problems with the detectors, calibrations, or fast-offline reconstruction.
- Check the Online-to-Offline data base migration using the "Database Migration Monitor" link on the first page of the QA browser after you login. When data are being taken the first several tables should appear in green font. If no data have been acquired for a day or so then all the tables should be in red. If there are any red fonts in the first several tables labelled "RunLog_onl" while data are being taken then this may indicate a problem and you should notify starqa-hn explicitly.
webmaster
Last modified: Feb 15, 2008
Summary of Fast Offline QA Shift Duties - Run 9
- Review in detail the set of histograms for the Offline QA Shifts for Fast Offline Data Production (highest priority); the minimum requirement is 1-2 file sequences or 'jobs' per Experiment Run ID number and trigger collection, e.g. st_physics, st_mtd, st_upsilon, minbias, high tower, etc.
- Note that for p-p you may need to use the "combine several jobs together" option in order to get enough statistics.
- Write a useful and informative Offline QA Shift report using a web-based form noting especially any and all suspected problems with the detectors, calibrations, and reconstruction. The report will be archived and the summary sent to 'starqa-hn' hypernews automatically.
- Press the "MARK" button for all fast offline data runs you examined while on shift.
- Review the Online Run Log information and comments for each real data production job you examine and summarize the Run/Data Quality status based on the Run Log information and the QA examination results by marking the job as "Good" or "Bad." Jobs will normally be considered "Good" even when there are hardware outages or calibration/reconstruction issues. Please check with the QA experts before marking jobs as "Bad."
- Notify the appropriate experts and/or the QA contacts for any and all suspected problems with the detectors, calibrations, or fast-offline reconstruction.
- Check the Online-to-Offline data base migration using the "Database Migration Monitor" link on the first page of the QA browser after you login. When data are being taken the first several tables should appear in green font. If no data have been acquired for a day or so then all the tables should be in red. If there are any red fonts in the first several tables labelled "RunLog_onl" while data are being taken then this may indicate a problem and you should notify starqa-hn explicitly.
webmaster
Last modified: Feb 18, 2009
Summary of Fast Offline QA Shift Duties - Run 10
- Review in detail the set of histograms for the Offline QA Shifts for Fast Offline Data Production (highest priority); the minimum requirement is 1-2 file sequences or 'jobs' per Experiment Run ID number and trigger collection, e.g. st_physics, st_mtd, st_upsilon, minbias, high tower, etc.
- Note that for Au-Au one file sequence is usually sufficient however you may need to use the "combine several jobs together" option in order to get enough statistics.
- Write a useful and informative Offline QA Shift report using a web-based form noting especially any and all suspected problems with the detectors, calibrations, and reconstruction. The report will be archived and the summary sent to 'starqa-hn' hypernews automatically.
- Press the "MARK" button for all fast offline data runs you examined while on shift.
- Review the Online Run Log information and comments for each real data production job you examine and summarize the Run/Data Quality status based on the Run Log information and the QA examination results by marking the job as "Good" or "Bad." Jobs will normally be considered "Good" even when there are hardware outages or calibration/reconstruction issues. Please check with the QA experts before marking jobs as "Bad."
- Notify the appropriate experts and/or the QA contacts for any and all suspected problems with the detectors, calibrations, or fast-offline reconstruction.
- Check the Online-to-Offline data base migration using the "Database Migration Monitor" link on the first page of the QA browser after you login. When data are being taken the first several tables should appear in green font. If no data have been acquired for a day or so then all the tables should be in red. If there are any red fonts in the first several tables labelled "RunLog_onl" while data are being taken then this may indicate a problem and you should notify starqa-hn explicitly.
Summary of Fast Offline QA Shift Duties - Run 11
- Review in detail the set of histograms for the Offline QA Shifts for Fast Offline Data Production (highest priority); the minimum requirement is 1-2 file sequences or 'jobs' per Experiment Run ID number and trigger collection, e.g. st_physics, st_mtd, st_upsilon, minbias, high tower, etc.
- Note that for Au-Au one file sequence is usually sufficient however you may need to use the "combine several jobs together" option in order to get enough statistics. Starting this year for Run 11 there are additional options in the QA browser for obtaining and reviewing the QA data. These include: (1) "Combine several jobs together", (2) "New: Select jobs that have been automatically combined", (3) "TESTING: ..." versions of the job selection options which enables automated comparisons with a reference. You may use either option. As the name implies, the "TESTING" option is still under development but you are encouraged to use this feature and provide feed-back to the QA team. This latest automated QA capability will become essential as STAR's DAQ rates continue to increase.
- Write a useful and informative Offline QA Shift report using a web-based form noting especially any and all suspected problems with the detectors, calibrations, and reconstruction. The report will be archived and the summary sent to 'starqa-hn' hypernews automatically.
- Press the "MARK" button for all fast offline data runs you examined while on shift.
- Review the Online Run Log information and comments for each real data production job you examine and summarize the Run/Data Quality status based on the Run Log information and the QA examination results by marking the job as "Good" or "Bad." Jobs will normally be considered "Good" even when there are hardware outages or calibration/reconstruction issues. Please check with the QA experts before marking jobs as "Bad."
- Notify the appropriate experts and/or the QA contacts for any and all suspected problems with the detectors, calibrations, or fast-offline reconstruction.
- Check the Online-to-Offline data base migration using the "Database Migration Monitor" link on the first page of the QA browser after you login. When data are being taken the first several tables should appear in green font. If no data have been acquired for a day or so then all the tables should be in red. If there are any red fonts in the first several tables labelled "RunLog_onl" while data are being taken then this may indicate a problem and you should notify starqa-hn explicitly.
Summary of Fast Offline QA Shift Duties - Run 12
- Review in detail the set of histograms for the Offline QA Shifts for Fast Offline Data Production (highest priority); the minimum requirement is 1-2 file sequences or 'jobs' per Experiment Run ID number and trigger collection, e.g. st_physics, st_mtd, st_upsilon, minbias, high tower, etc.
- Note that for p-p the "combine several jobs together" option is recommended in order to get enough statistics. For Au-Au one file sequence is usually adequate but the combined jobs option is still recommended. Npte that there are additional options in the QA browser for obtaining and reviewing the QA data. These include: (1) "Combine several jobs together", (2) "New: Select jobs that have been automatically combined", (3) "TESTING: ..." versions of the job selection options which enables automated comparisons with a reference. You may use either option. As the name implies, the "TESTING" option, which was introduced in Run 11, may continue to see some further development upgrades this year, but you are encouraged to use this feature and provide feed-back to the QA team. This latest automated QA capability will become essential as STAR's DAQ rates continue to increase.
- Write a useful and informative Offline QA Shift report using a web-based form noting especially any and all suspected problems with the detectors, calibrations, and reconstruction. The report will be archived and the summary sent to 'starqa-hn' hypernews automatically.
- Press the "MARK" button for all fast offline data runs you examined while on shift.
- Review the Online Run Log information and comments for each real data production job you examine and summarize the Run/Data Quality status based on the Run Log information and the QA examination results by marking the job as "Good" or "Bad." Jobs will normally be considered "Good" even when there are hardware outages or calibration/reconstruction issues. Please check with the QA experts before marking jobs as "Bad."
- Notify the appropriate experts and/or the QA contacts for any and all suspected problems with the detectors, calibrations, or fast-offline reconstruction.
- Check the Online-to-Offline data base migration using the "Database Migration Monitor" link on the first page of the QA browser after you login. When data are being taken the first several tables should appear in green font. If no data have been acquired for a day or so then all the tables should be in red. If there are any red fonts in the first several tables labelled "RunLog_onl" while data are being taken then this may indicate a problem and you should notify starqa-hn explicitly.
|
Subscribe to this page
|
|
To content in computing
|
|
To content in computing by ray
|
Summary of Fast Offline QA Shift Duties - Run 12
- Using the Automated QA browser review in detail the set of histograms for the Offline QA Shifts for Fast Offline Data Production (highest priority); the minimum requirement is 1-2 file sequences or 'jobs' per Experiment Run ID number and trigger collection, e.g. st_physics, st_mtd, st_upsilon, minbias, high tower, etc.
- Note that for p-p the "Auto-combined" or the "combine several jobs" option is recommended in order to get enough statistics. For Au-Au one file sequence is usually adequate but either combine jobs option is still recommended. Note that starting this year the presentation of the QA histograms and references have changed. The "testing" options introduced last year are now to be used routinely.
- Write a useful and informative Offline QA Shift report using a web-based form noting especially any and all suspected problems with the detectors, calibrations, and reconstruction. The report will be archived and the summary sent to 'starqa-hn' hypernews automatically. Please use the "play" mode if you are a first-time user to practice filling out the report.
- Review the Online Run Log information and comments for each real data production job you examine and summarize the Run/Data Quality status based on the Run Log information and the QA examination results by marking the job as "Good" or "Bad." This will also indicate that the data have been examined by Offline QA. Jobs will normally be considered "Good" even when there are hardware outages or calibration/reconstruction issues. Please check with the QA experts before marking jobs as "Bad."
- Notify the appropriate experts and/or the QA contacts for any and all suspected problems with the detectors, calibrations, or fast-offline reconstruction.
- Check the Online-to-Offline data base migration using the "Database Migration Monitor" link on the first page of the QA browser after you login. When data are being taken the first several tables should appear in green font. If no data have been acquired for a day or so then all the tables should be in red. If there are any red fonts in the first several tables labelled "RunLog_onl" while data are being taken then this may indicate a problem and you should notify starqa-hn explicitly.
Technical Documentation of the Auto-Combine Function
Code located at /star/u/starqa/QA/
The name of the code is newFilesCheck.c
The makefile is makeFilesCheck.
Synopsis:
This new program executes every 30 minutes. It requests a list of all new files in DAQInfo that are available to be QA’d. When it finds multiple files from the same run number it will automatically combine them together. A log of previously combined files is also kept so that additional files that become available later can be added to a previously combined run number.
Outline of Code:
- The code reads in the timestamp of the last time newFilesCheck.c was executed. This timestamp is in the file “markerAutoCombine.txt”.
- It queries DAQInfo for any new files available after this timestamp.
- If there are new files it begins a for loop of the possible trigger types. Steps 4-6 are run for each trigger type.
- It checks to see if files with the same trigger and run number have been auto-combined before by looking in the log file “listofFiles.txt”. If there is a match it will move to step 5. If there isn’t a match it will query DAQInfo again but with no requirement on when the files become available (i.e. checking for single files coming available in ~30 minute increments). If the number of files returned is less than two then the code cycles to the next trigger type (back to the beginning of step 4).
- The files are now ready to be combined. The list of files (new and previously combined, if any) are inserted into Offline QA where the daemon can check for new requests. Also, the id of the output files is designed to start with zz and end with a random number up to 5 digits.
- The program then waits for the daemon to return the status of ‘Y’ meaning the combining is done. The output combined file is stored in /star/data10/qa/. The program then writes the run number, number of files now in the combined file, trigger type and the id to a file called “listofFilesNew.txt”.
Example:
12038114 05 st_ph zz4539
- Next we want to delete redundant files (i.e. previously combined files that were just updated with new files). This is done by checking the contents of “listofFilesNew.txt” with “listofFiles.txt”. If the same run number appears in both files then the older file (i.e. that in listofFiles.txt) is deleted. Once this is done a new “listofFiles.txt” is written in order to start this process over again in the next execution (30 minutes later). Also, if more than 300 files are in the log file the oldest files at the bottom are deleted.
- A new timestamp is recorded in “markerAutoCombine.txt”.
The crontab command is:
0 * * * * /star/u/starqa/QA/newFilesCheck
30 * * * * /star/u/starqa/QA/newFilesCheck
Technical Documentation of the Offline QA Browser
This page is meant to document technical details of files and databases used by the Offline QA Browser. The databases reside on the duvall server.
- The FastOffline framework fills the operation/DAQInfo table with the names of DAQ files produced and information on the location of generated files from the production
-
A program called "qa" (code is available in CVS under offline/QA/) operates as a CGI web interface. qa.c is 2,000+ lines of string manipulation, html output, and mysql queries. To find (some of) the code for a certain page, check the switch statement in main (line 3709) for the function call pertaining to a given page number. The mysql queries are mostly handled through the Query function defined in lib.h and lib.c. A Makefile is available on orion under ~starqa/QA which compiles and installs the program on STAR's web server. Here are the tasks it does for "FAST OFFLINE shift work":
- Query operation/DAQInfo for FastOffline jobs matching the cuts provided by the user.
- Query operation/FOLocations for the actual directory of the histograms for selected FastOffline jobs.
- Insert an entry into OfflineQA/hist2ps for QA jobs to process. The daemon monitors hist2ps for undone job requests and changes the status once the request has been performed.
- Wait for the status of that entry to change and obtain the list of output files.
- Generate a web page which provides links to the output histogram files and logs.
-
A daemon (~starqa/QA/daemon) runs continuously on rcas6004 to catch and process requests for histogram delivery. The daemon is started through a wrapper at ~starqa/bin/QAdaemon. This checks to see if the daemon is already running and handles all of the AFS authentication. Since the QAdaemon wrapper now handles the log files, the cron job becomes much simpler. The crontab command is: * * * * * /star/u/starqa/bin/QAdaemon, which keeps the wrapper alive continuously.
Here are the overall task of daemon.c:
Starting the daemon interactively:
- log on to the rssh gateway (with your own account)
- log on to rcas6004 as starqa: ssh starqa@rcas6004
- run bin/QAdaemon
- after running, delete the file ~/QA/marker
Stopping the daemon:
- log on to rcas6004 as starqa (see above)
- get the process id: ps -ef | grep starqa
- kill the daemon's process
- delete the file ~/QA/marker
-
note: unless you stop the cron job, the daemon should automatically restart shortly
Notes:
- The cron job: use the "crontab -l" command to see the current command. "crontab -r" will remove it, "crontab -e" will let you edit it (defaults to vi, you can set your $EDITOR environment variable), or "crontab filename" will replace it with the command(s) in the file filename. I keep the current cron command in ~/QA/mycrontab (check this before using).
- As a check against having several daemons running simulataneously, the daemon stores it pid in the file ~/QA/marker. When a new daemon is started, it checks for this file, and may refuse to run if the file is recent. The new wrapper makes this largely unnecessary, so this may be removed in the future. In the meantime, if on startup the daemon quits with the error message about another process already running, try deleting the marker file and starting the daemon again.
4. QA database: The QA database is name OfflineQA and is served on duvall.star.bnl.gov. This database stores information on which files have been analyzed by QA shift workers, stores requests for new histograms to be made, and is how the cgi script and the daemon communicate.
- hist2ps: Requests from the cgi script to create histograms. The daemon monitors this table for requests, and updates the entry when it has completed (or crashed).
- fastOfflineHistory: A history of who has examined what
- reports: Stores reports from QA shift workers
- reviewed: Lists job IDs and run numbers which have already been checked by QA.
Notes:
- To browse the database, you can use the mysql command line interface (mysqlshow would be preferable, but it can't get around the underscore in the database name). Be careful that you do not make any changes
- Type: 'mysql -h duvall.star.bnl.gov' to open mysql
- 'use test_Herb' opens the QA DB
- 'show tables' lists the tables
- 'describe <table>' gives details about a certain table
- 'select * from <table> limit 10' will show 10 entries in a table
Offline QA technical documentation (old)
Purpose: This page provides nuts-and-bolts level documentation of the QA system for maintainence and troubleshooting through run 5. Nothing here is necessary for those doing QA shift work, this page is only for those maintaining the browser software.
Quick Useful Links:
Herb's Documentation
QA Home Page
QA Browser Documentation (Run 4)
QA Offline Browser
QA Hypernews List
Send Email to QA
QA System Components
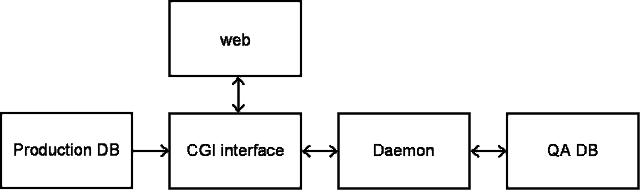
CGI Web Interface
Herb Says: This is a C program (or, more precisely, an image of a C program). The
code for it is in a file named qa.c, a copy of which is under the starqa
RCF account home directory. In the same place you will find a make file
which installs the program in an AFS CGI directory accessible by the STAR
WWW server. This program has two inputs: the database described as "part
D" above and below, and the user (eg, a QA shift worker). A link to the
CGI program is on the STAR QA page, and it is how the QA shift worker
enters the program.
Details: The source tree for the code is on RCF at ~starqa/QA, the files are qa.c and a few functions in lib.h and lib.c. A Makefile is also available in the same directory which compiles and installs the program on STAR's web server.
qa.c is 2,000+ lines of string manipulation, html output, and mysql queries. To find (some of) the code for a certain page, check the switch statement in main (line 2025) for the function call pertaining to a given page number. The mysql queries are mostly handled through the Query function defined in lib.h and lib.c. When all the cuts and selections have been made, this program adds a line to the QA DB with the request for the daemon to create the histograms. When the daemon is finished it flags that entry, so the QA DB is monitored waiting for the daemon's response. When the daemon is done, URL's pointing to the gzipped postscript files of the plots are sent to back the user for evaluation.
Source: qa.c lib.h lib.c
Web Interface: Some documentation is available here: QA Browser Documentation (Run 4). To play with it yourself the CGI page is here: QA Offline Browser. The sections for shift work of real data (1.1) and fastoffline data (3.1) should work, but most of the other stuff doesn't. Its not clear if it should be fixed or removed...
Notes:
- qa.c is also compiled with lib.h and lib.c. One thing that looks odd in the code is from a definition in lib.h:
#define PP printf(
Daemon
Herb Says: This is not actually a daemon in the full technical sense. It is just
a program runs continuously, and which is kept alive through reboots by a
cron job, under the starqa account on the RCF machine rcas6004. It
watches the database (part C) for requests from part A. When it sees a
request, it generates the requested histograms and, when it is done, it
notifies part A through the database (part C).
Details: The code and Makefile is available on RCF at ~starqa/QA/daemon.c. The daemon runs on rcas6004 (which is reserved) under the starqa account, and is started from a cron job, and apparently needs to be manually restarted often.
The daemon is started through a wrapper at ~starqa/bin/QAdaemon. This checks to see if the daemon is already running and handles all of the AFS authentication. Also, the wrapper handles whether or not the storing the output will be stored to a log file; see the comments at the end of the file.
Since the QAdaemon wrapper now handles the log files, the cron job becomes much simpler. The crontab command is:
* * * * * /star/u/starqa/bin/QAdaemonwhich keeps the wrapper alive continuously.
For debugging purposes it can be useful to run the daemon interactively, this should still be done through the wrapper.
Source: daemon.c QAdaemon (wrapper)
Procedures:
- log on to the rssh gateway (with your own account)
- log on to rcas6004 as starqa: ssh starqa@rcas6004
- run bin/QAdaemon
- after running, delete the file ~/QA/marker
- log on to rcas6004 as starqa (see above)
- get the process id: ps -ef | grep starqa
- kill the daemon's process
- delete the file ~/QA/marker
- note: unless you stop the cron job, the daemon should automatically restart shortly
Notes:
- The cron job: use the "crontab -l" command to see the current command. "crontab -r" will remove it, "crontab -e" will let you edit it (defaults to vi, you can set your $EDITOR environment variable), or "crontab filename" will replace it with the command(s) in the file filename. I keep the current cron command in ~/QA/mycrontab (check this before using).
- As a check against having several daemons running simulataneously, the daemon stores it pid in the file ~/QA/marker. When a new daemon is started, it checks for this file, and may refuse to run if the file is recent. The new wrapper makes this largely unnecessary, so this may be removed in the future. In the meantime, if on startup the daemon quits with the error message about another process already running, try deleting the marker file and starting the daemon again.
QA Database
Herb Says: This is a database. Its name is "test_Herb". It is served by one of
the STAR mysql servers, which you can find by searching the daemon or CGI
code for calls to the the "Query" function.
Details: The database is named "test_Herb" and is served on duvall.star.bnl.gov.
A (partial) list of tables in the QA DB:
- hist2ps: Requests from the cgi script to create histograms. The daemon monitors this table for requests, and updates the entry when it has completed (or crashed).
- fastOfflineHistory: A history of who has examined what
- reports: Stores reports from QA shift workers
- reviewed: Lists job IDs and run numbers which have already been checked by QA.
Notes:
- To browse the database, you can use the mysql command line interface (mysqlshow would be preferable, but it can't get around the underscore in the database name). Be careful that you do not make any changes
- Type: 'mysql -h duvall.star.bnl.gov' to open mysql
- 'use test_Herb' opens the QA DB
- 'show tables' lists the tables
- 'describe <table>' gives details about a certain table
- 'select * from <table> limit 10' will show 10 entries in a table
- consult a mysql manual (e.g. here) for more...
STAR Production Database
Herb Says: This is another database. Its name is "production" (note: actually named "operation"). This database is
written during production, and tells what jobs ("runs") have gone through
production.
Details: The database is also served from duvall.star.bnl.gov, it is actually named "operation". We are careful to only read from this database and not modify it in any way.
The tables we access are:
- FileCatalog2004: Real Data productions, this table is queried several times to choose a run and a job, then it takes the path and filename and sends them to the daemon.
- DAQInfo: FastOffline Data, list of files from FastOffline productions, the path is stored as an integer in the DiskLoc column which references FOLocations below.
- FOLocations: pathnames for FastOffline data, references DAQInfo table, matches integers to pathnames (i.e. 0 = not on disk, 1 = /star/data08/reco/dev/2005/01/, etc.)
Notes:
- Our access to this database was down for several weeks. If data are not available in the browser, you can use mysql to directly query the operations database to see what is there and see which end the problem is on.
Troubleshooting
Technical Documentation of the Offline QA Shift Reports
This page is meant to document technical details of files and databases used by the Offline QA Browser.
The codes are maintained in CVS under cgi/qa/QAShiftReport/. The code files also have some documentation within.
|
interface scripts for interaction with users |
|
| sessions.php | Manage selection of sessions |
| menu.php | Menu of options in the left panel |
| contents.php | Display and manage contents of the report in progress |
| info.php | Form for "Info" section of the report |
| formData.php | Form for data entry sections of the report |
| wrapup.php | Form for final comments of the report and submitter contact info |
| issueEditor.php | Manage issues (meant to run in a separate window) |
| showRun.php | Find and view complete archived reports |
| viewLog*.php | Log viewers |
|
helper scripts |
|
| saveEntry.php | Record data saved/submitted by info.php or formData.php, including temporary in progress data entries; possibly continue to contents.php |
| showRep.php | Display current contents of the report |
| submit.php | Archive report, send emails, possible call shiftLog.php |
| shiftLog.php | Handle submission of report to the Electronic Shift Log |
|
basic |
|
| setup.php | Location of includes files and include base.php |
| base.php | Basic information useful for all codes |
| *.html | Standardized HTML headers and footers |
|
interfaces |
|
| shift.php | Interface for session information |
| cookies.php | Interface for browser cookies |
| db.php | Interface for database access |
| files.php | Interface for file access |
| forms.php | Interface for using HTML forms |
| logit.php | Interface for logging of activity |
|
data structures |
|
| report.php | I/O functions for reports |
| issues.php | Define qaissue objects and associated functions |
| entry.php | Define qaentry objects and associated functions |
| entrytypes.php | Define possible entry types |
|
special helpers |
|
| infohandling.php | Work with info and wrapup portions of reports |
| loadSession.php | Setup working environment once a session has been selected |
| fillform.php | Fill forms using array values whose keys are form element names |
| preserve_wordwrap.php | Handle line breaks in large text boxes (usually comments) |
| data2text.php | Convert data objects into text or HTML for viewing |
Reports and issues are kept in the OfflineQA database on db09.
| QAIssues | Data for all issues |
| QAShiftReports | Contents of all shift reports |
| QArunFileSeqIndex | Index table to cross reference runs and file sequences with reports which discussed them |
| QAtemp | Temporary storage of reports in progress |