- General information
- Data readiness
- Calibration
- Databases
- Quality Assurance
- Online QA
- Proposal and statements
- Offline QA
- QA Shift Report Instructions
- STAR QA Documentation
- Configuring AutoQA for subsystems
- Fast Offline QA Histogram References and Descriptions
- Fast Offline QA Shift Report Preparation and Instructions for Run 8
- Fast Offline QA Shift Report Preparation and Instructions for Run 9
- Information for Fast Offline QA Shifts - Run 8
- Information for QA Shifts
- Integrating QA Histograms into Makers
- Manual generation of QA histograms
- Offline QA Histogram Trigger Types
- Offline QA Shifts (Y2000 run)
- Other Expert contacts and links
- QuickStart Instructions for the Auto QA Browser - Run 8
- QuickStart Instructions for the Auto QA Browser - Run 9
- STAR QA Documentation
- STAR QA for Offline Software
- STAR QA links and contacts
- Summary of Fast Offline QA Shift Duties - Run 8
- Summary of Fast Offline QA Shift Duties - Run 9
- Technical Documentation of the Auto-Combine Function
- Technical Documentation of the Offline QA Browser
- Technical Documentation of the Offline QA Shift Reports
- Reconstruction Code QA
- Run QA
- Grid and Cloud
- Infrastructure
- Machine Learning
- Offline Software
- Production
- S&C internal group meetings
- Test tree
QA Reference for Trigger Specific Histograms - Run 9
Updated on Fri, 2009-04-03 14:40. Originally created by genevb on 2009-04-03 13:01.
Under:
STAR Offline QA Shift Histogram Description - Run 9
Note: Not all reference plots may be ideal, be sure to carefully read the descriptions.
This page contains the reference histograms and descriptions for the Offline QA system for Run 9. These pages should correspond exactly to the jobs viewed in the Offline QA Browser. However, STAR is a dynamic experiment and the plots generated for QA will change several times throughout the run. If this reference page seems out-of-date, or if you find a job that would make a better reference, please email the QA hypernews list here.
Other links:
Elizabeth Wingfield for the QA Team.
April 2, 2009.
Page Index for QA Shift Plots
- Page 1
- Page 2
- Page 3
- Page 4
- Page 5
- Page 6
- Page 7
- Page 8
- Page 9
- Page 10
- Page 11
- Page 12
- Page 13
- Page 14
Page 1
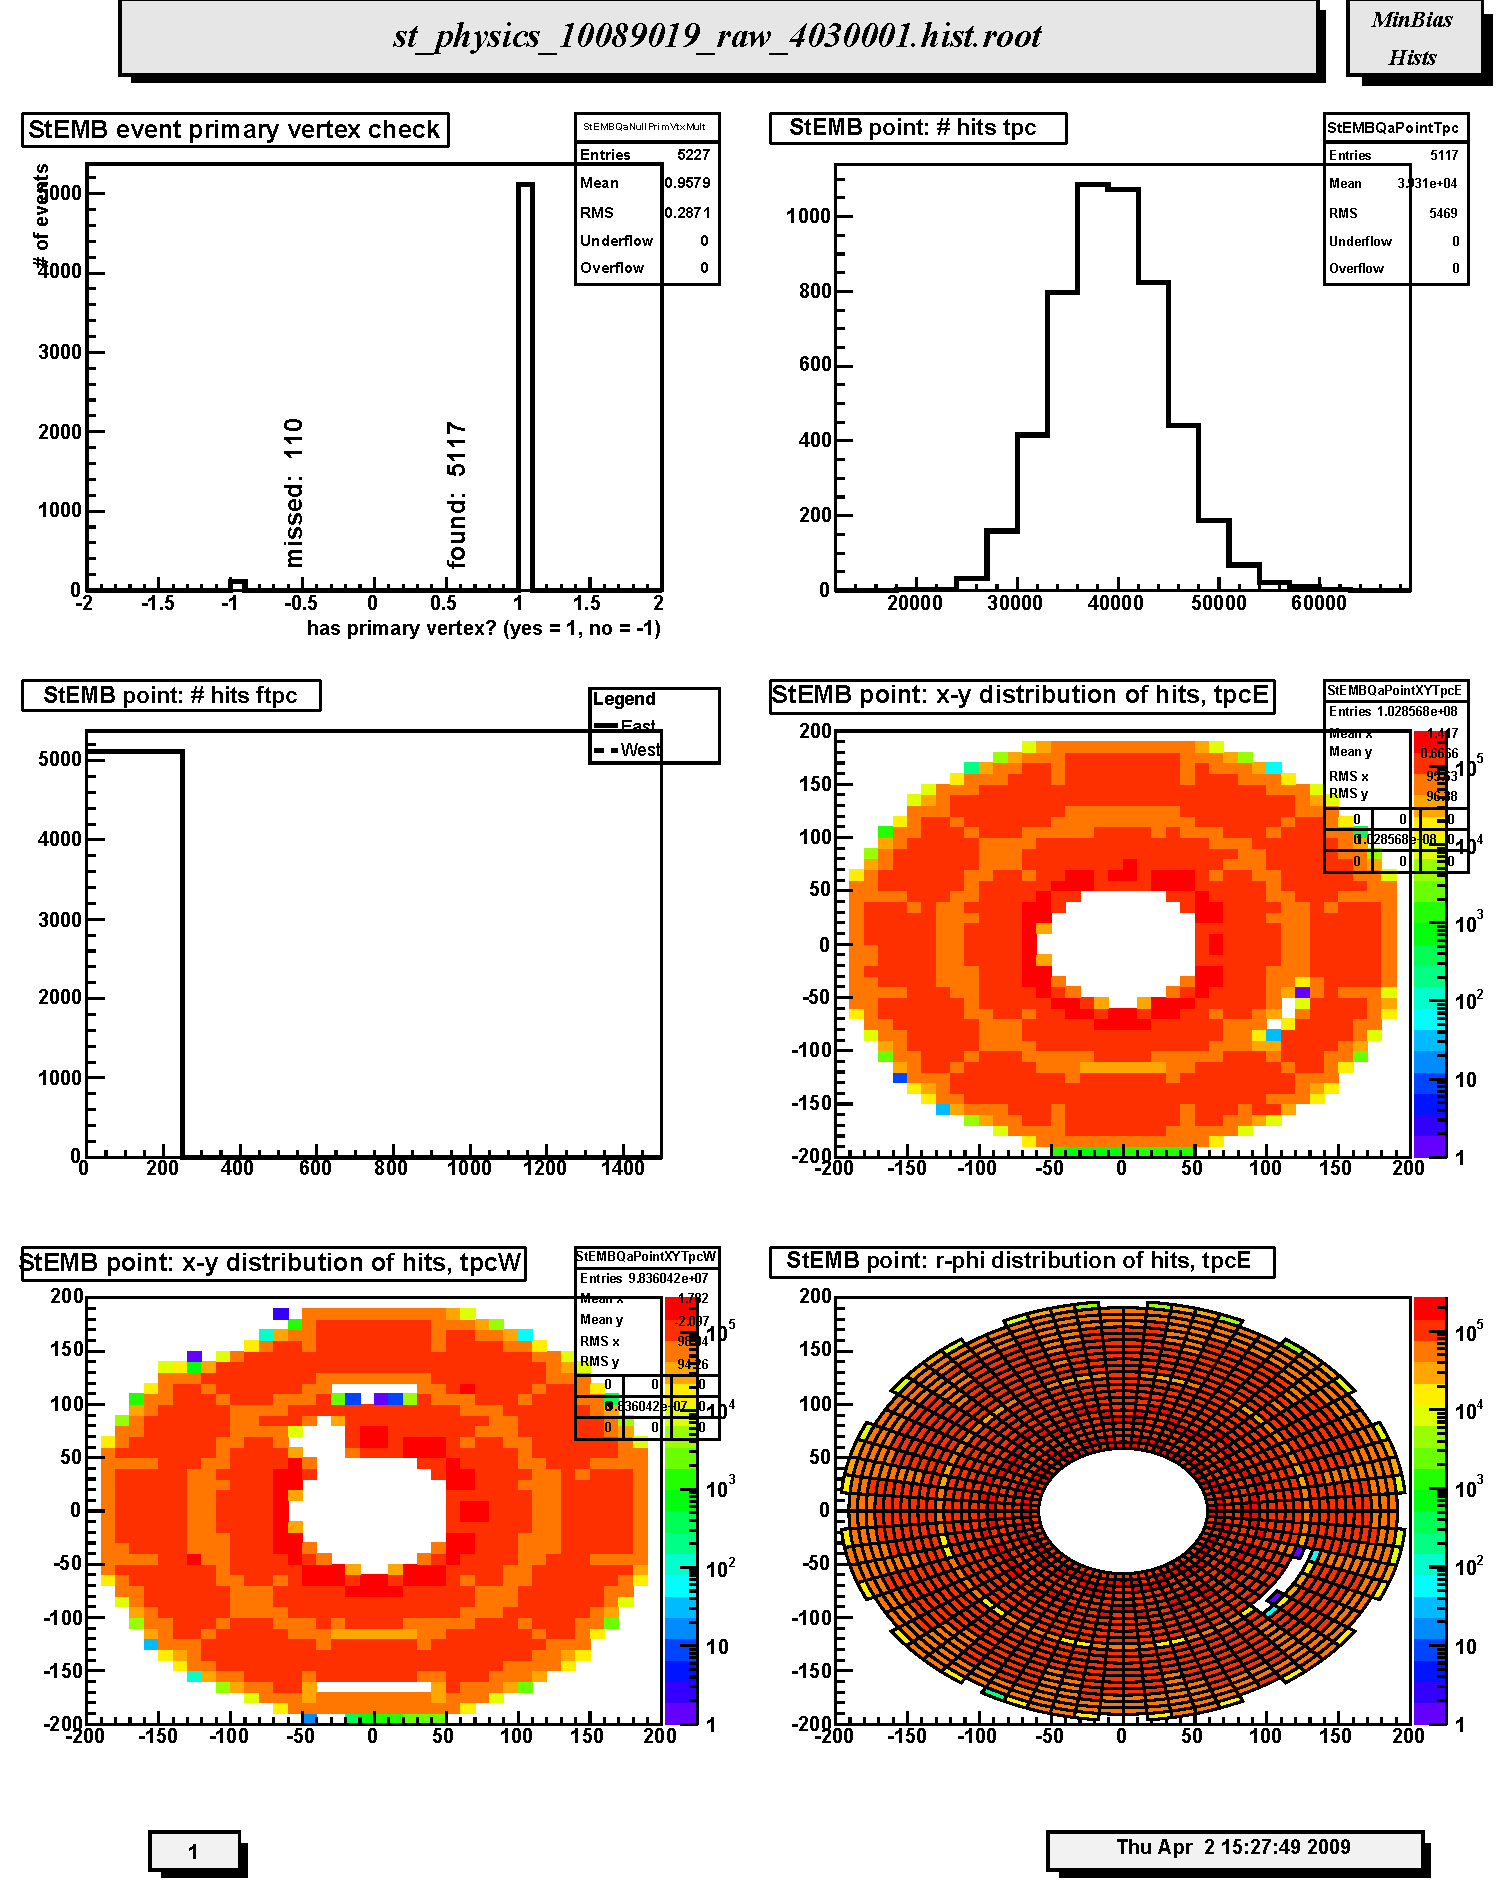
1. StEMB event primary vertex check: Primary vertex finding status for run; events with (1) and without (-1) final vertex. The relative fraction of events with primary vertex depends on trigger, beam diamond width and position.
2. StEMB point: # hits tpc : Distribution of number of reconstructed space points in TPC per event. Should scale with centrality, depends on multiplicity cut and trigger.
3. StEMB point: # hits ftpc: Not filled in this run. Distribution of number of reconstructed space points in FTPC East (solid line) and West (dashed line) per event. Scales with centrality, depends on multiplicity cut and trigger.
4. StEMB point: x-y distribution of hits, tpcE: Scatter plot of the azimuthal distribution of reconstructed space points in the East TPC. The distribution should be azimuthally uniform except for the 12 sector structure of the TPC (lighter areas indicate sector boundaries). Density should decrease radially but inner and outer sector structure should be present (darker areas in the innermost pads of the inner and outer sectors). Watch for empty areas (typically masked RDOs) and hot spots. Notify TPC experts if new empty area or hot spot appears.
5. StEMB point: x-y distribution of hits, tpcW: Scatter plot of the azimuthal distribution of reconstructed space points in the West TPC. The distribution should be azimuthally uniform except for the 12 sector structure of the TPC (lighter areas indicate sector boundaries). Density should decrease radially but inner and outer sector structure should be present (darker areas in the innermost pads of the inner and outer sectors). Watch for empty areas (typically masked RDOs) and hot spots. Notify TPC experts if new empty area or hot spot appears.
6. StEMB point: r-phi distribution of hits, tpcE: Same as the x-y scatter plot except in polar coordinates.
Page 2
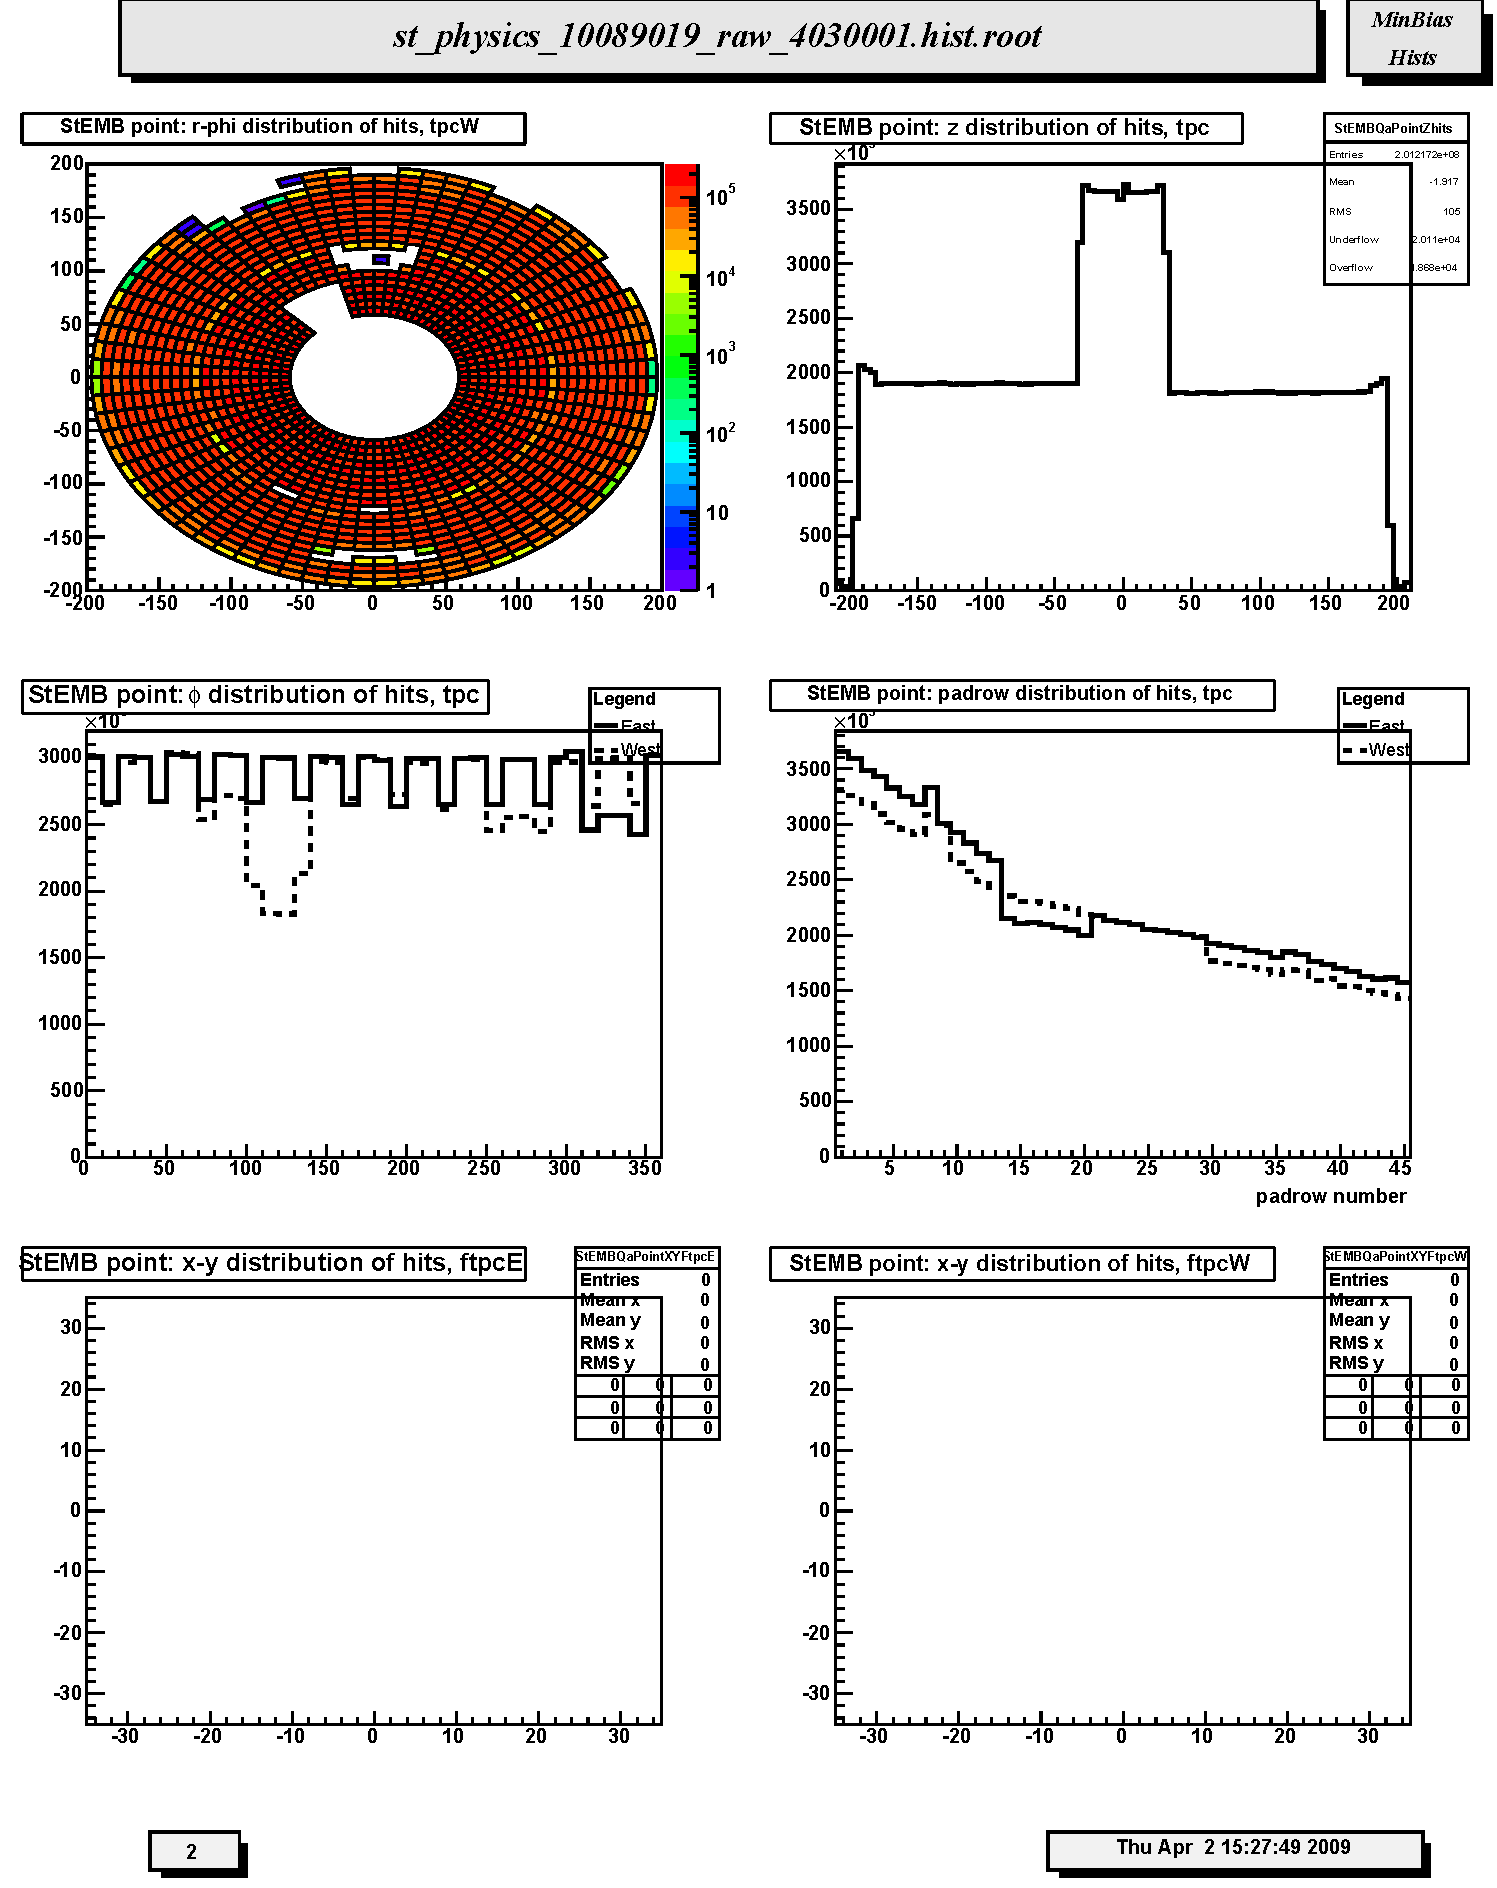
1. StEMB point: r-phi distribution of hits, tpcW: Same as the x-y scatter plot except in polar coordinates.
2. StEMB point: z distribution of hits, tpc: Distribution of reconstructed space points in TPC with respect to z-coordinate. For p-p running there is a broad peak above the nominally flat background at z=0. This is intentional and is done in order to allow identification of post-trigger pileup events. Watch out for any other anamolous steps or unusual spikes or dips.
3. StEMB point: #phi distribution of hits, tpc: Distribution of reconstructed space points in TPC with respect to azimuthal coordinate (phi) for east (solid line) and west (dashed line) halves. Should be flat except for the 12-fold sector structure or masked RDOs (as shown). Dead RDO's will produce dips and gaps; hot pads or FEE cards will produce spikes.
4. StEMB point: padrow distribution of hits, tpc: Distribution of reconstructed space points in TPC with respect to padrow number 1-45. Should display gradual fall-off; watch for anamolous spikes and dips. Padrow 13 has been restored for Run 9.
5. StEMB point: x-y distribution of hits, ftpcE: Not filled in this run. Radial distribution of reconstructed space points in FTPC East. The distribution should be uniform except for the insensitive gaps between the six readout sectors. Localized denser areas are due to noise. Ideally noisy pads are flagged in the FTPC gain tables so that they are not used for cluster finding. Less densely populated areas not on the sector boundaries are due to dead electronics. Empty areas not on the sector boundaries indicates a serious hardware problem. An FTPC expert should be contacted immediately if this is seen in fast offline-QA during data taking.
6. StEMB point: x-y distribution of hits, ftpcW: Not filled in this run. Radial distribution of reconstructed space points in FTPC West. The distribution should be uniform except for the insensitive gaps between the six readout sectors. Localized denser areas are due to noise. Ideally noisy pads are flagged in the FTPC gain tables so that they are not used for cluster finding. Less densely populated areas not on the sector boundaries are due to dead electronics. Empty areas not on the sector boundaries indicates a serious hardware problem. An FTPC expert should be contacted immediately if this is seen in fast offline-QA during data taking.
Page 3

1. StEMB point: plane distribution of hits, ftpc: Not filled in this run. Number of reconstructed space points assigned to tracks in FTPC East (solid line) and West (dashed line) in each padrow. The horizontal axis shows padrow numbers where FTPC-West is 1-10 and FTPC-East is 11-20. Padrows #1 and #11 are closest to the center of STAR. East and West should be similar in shape but West will have less magnitude than east for d+Au. Spikes indicate noisy electronics; dips indicate dead electronics.
2. StEMB point: #pads vs #timebins of hits, ftpcE: Not filled in this run. Monitors the cluster quality in FTPC East. Ideally the clusters should have a pad length of 3-5 and a timebin length of 4-6. A prominent peak located at (2,2) indicates bad gas or loss of gain or excessive background.
3. StEMB point: #pads vs #timebins of hits, ftpcW: Not filled in this run. Monitors the cluster quality in FTPC West. Ideally the clusters should have a pad length of 3-5 and a timebin length of 4-6. A prominent peak located at (2,2) indicates bad gas or loss of gain or excessive background.
4. StEMB Number hits in cluster for bemc: Distribution of number of BEMC towers contributing to energy clusters.
5. StEMB Energy of cluster for bemc: Distribution of energy in reconstructed clusters in EMC barrel. The spike at 6 for minbias events seems anomalous.
6. StEMB Eta of clusters for bemc: Azimuthally integrated pseudorapidity distribution of reconstructed energy clusters in the EMC-barrel. Note there will be gaps due to missing and/or uninstrumented sectors. Report any unexpected gaps or unusual spikes. For Run 9 the full barrel is instrumented. The distribution should nominally be flat.
Page 4
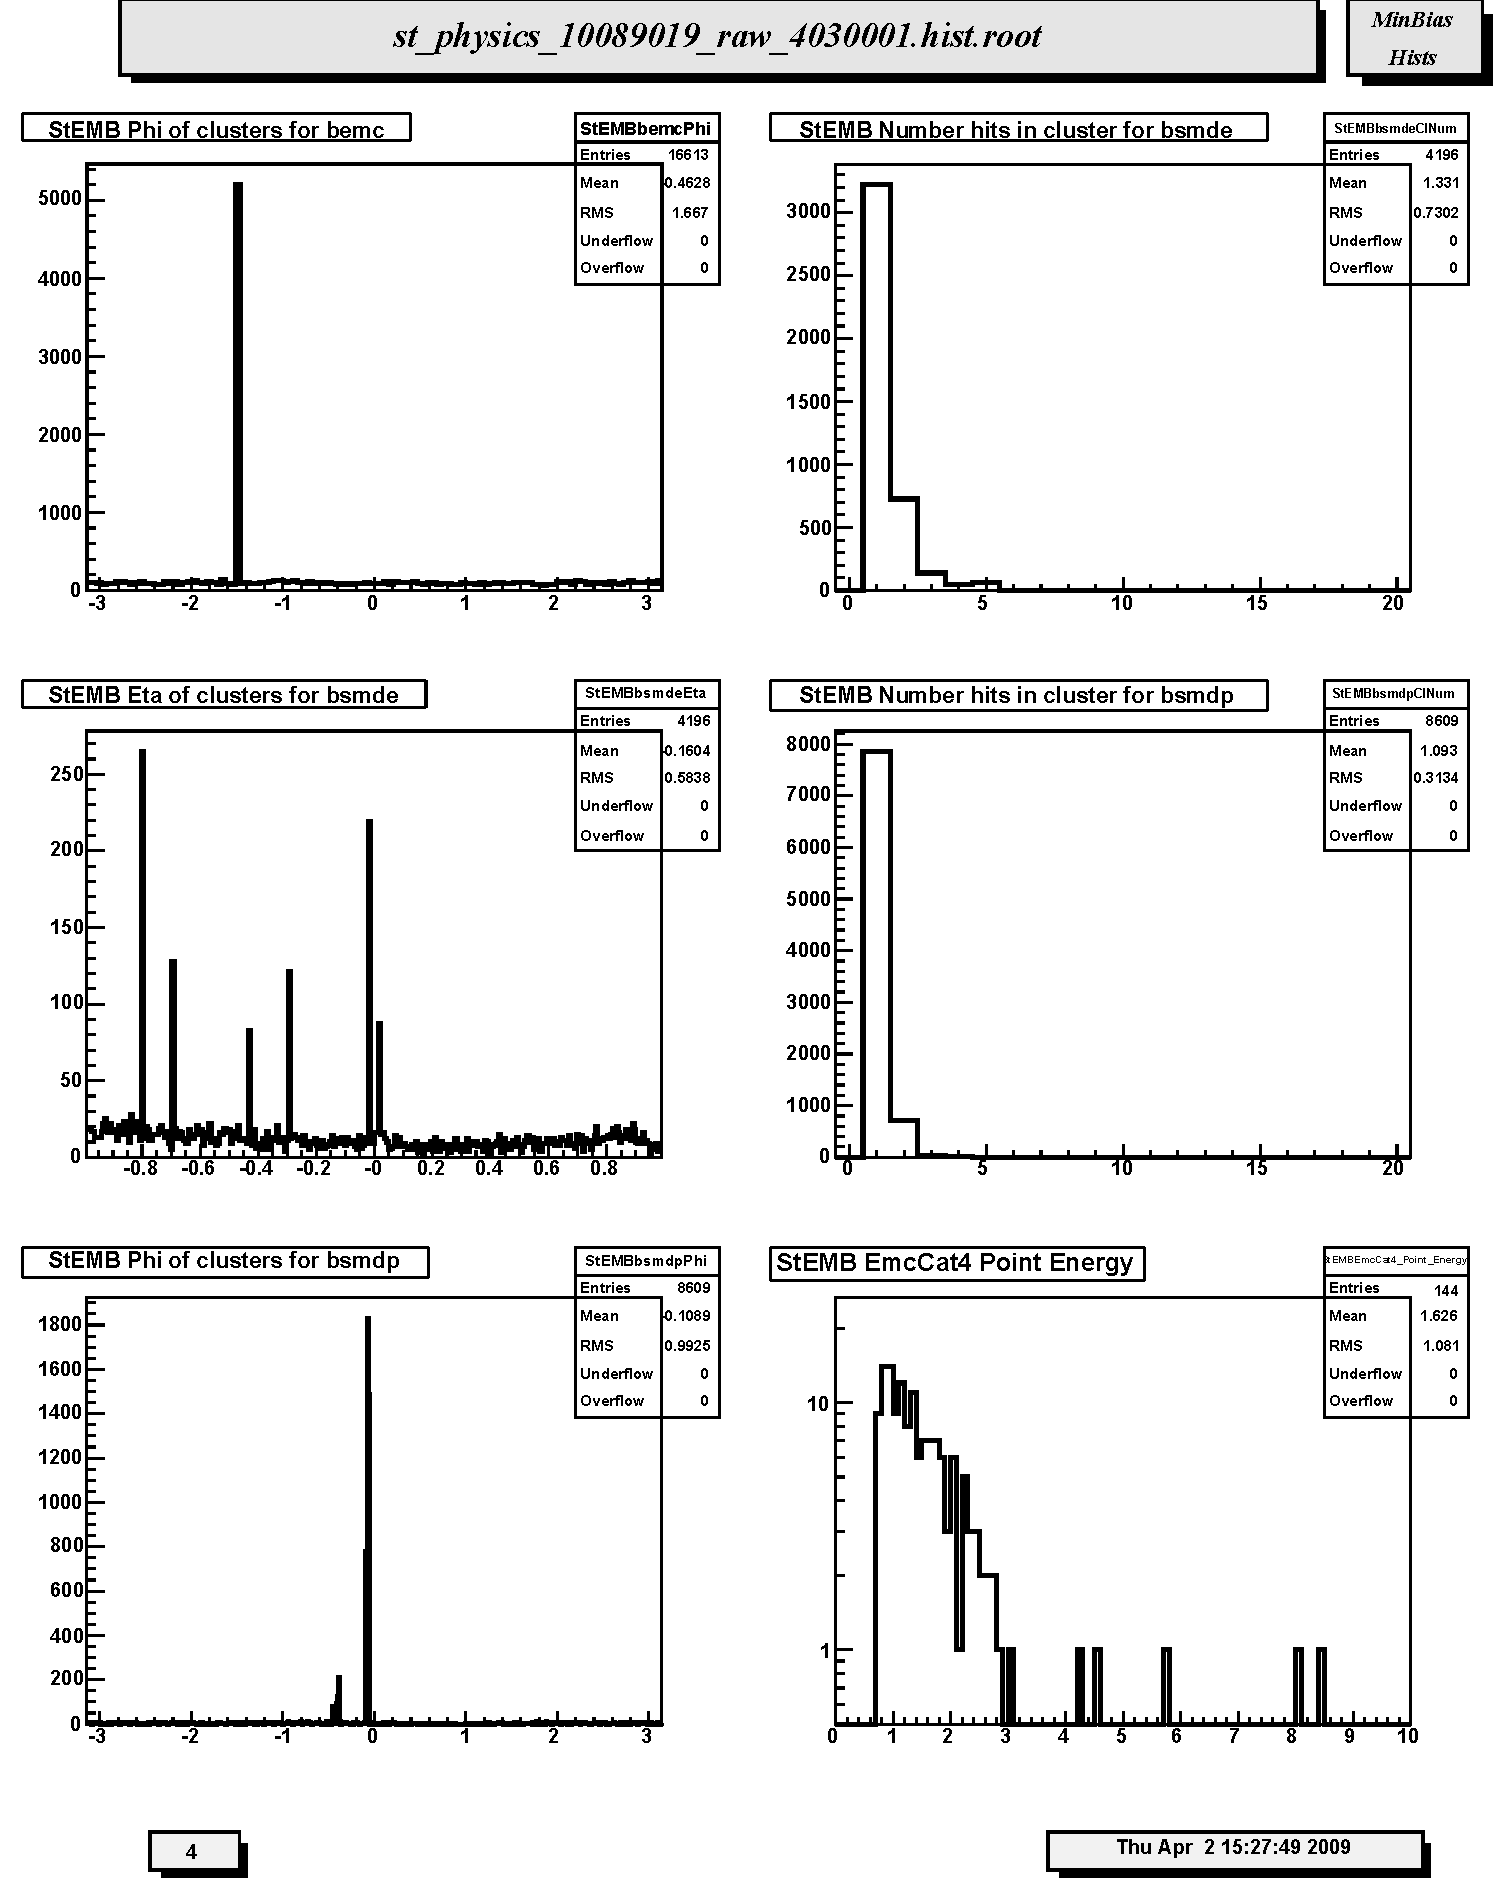
1. StEMB Phi of clusters for bemc: Pseudorapidity integrated azimuthal distribution (radians) of reconstructed energy clusters in the EMC-barrel. Note there will be gaps due to missing and/or uninstrumented sectors. Report any unexpected gaps or unusual spikes.
2. StEMB Number hits in cluster for bsmde: Distribution of numbers of hits (anodes) contributing to Barrel SMD clusters along pseudorapidity.
3. StEMB Eta of clusters for bsmde: Pseudorapidity distribution of reconstructed energy clusters in the BSMD anode grid along pseudorapidity. Note there will be gaps due to missing and/or uninstrumented sectors. Report any unexpected gaps or unusual spikes. Distribution should nominally be flat.
4. StEMB Number hits in cluster for bsmdp: Distribution of numbers of hits (anodes) contributing to Barrel SMD clusters along azimuth.
5. StEMB Phi of clusters for bsmdp: Azimuthal distribution of reconstructed energy clusters in the BSMD anode grid along azimuth angle (phi in radians). Note there will be gaps due to missing and/or uninstrumented sectors. Report any unexpected gaps or unusual spikes.
6. StEMB EmcCat4 Point Energy: Energy distribution for Barrel EMC-SMD Category 4 clusters. Cat4 clusters correspond to TPC track matched clusters in the EMC barrel, BSMD-eta and BSMD-phi detectors.
Page 5
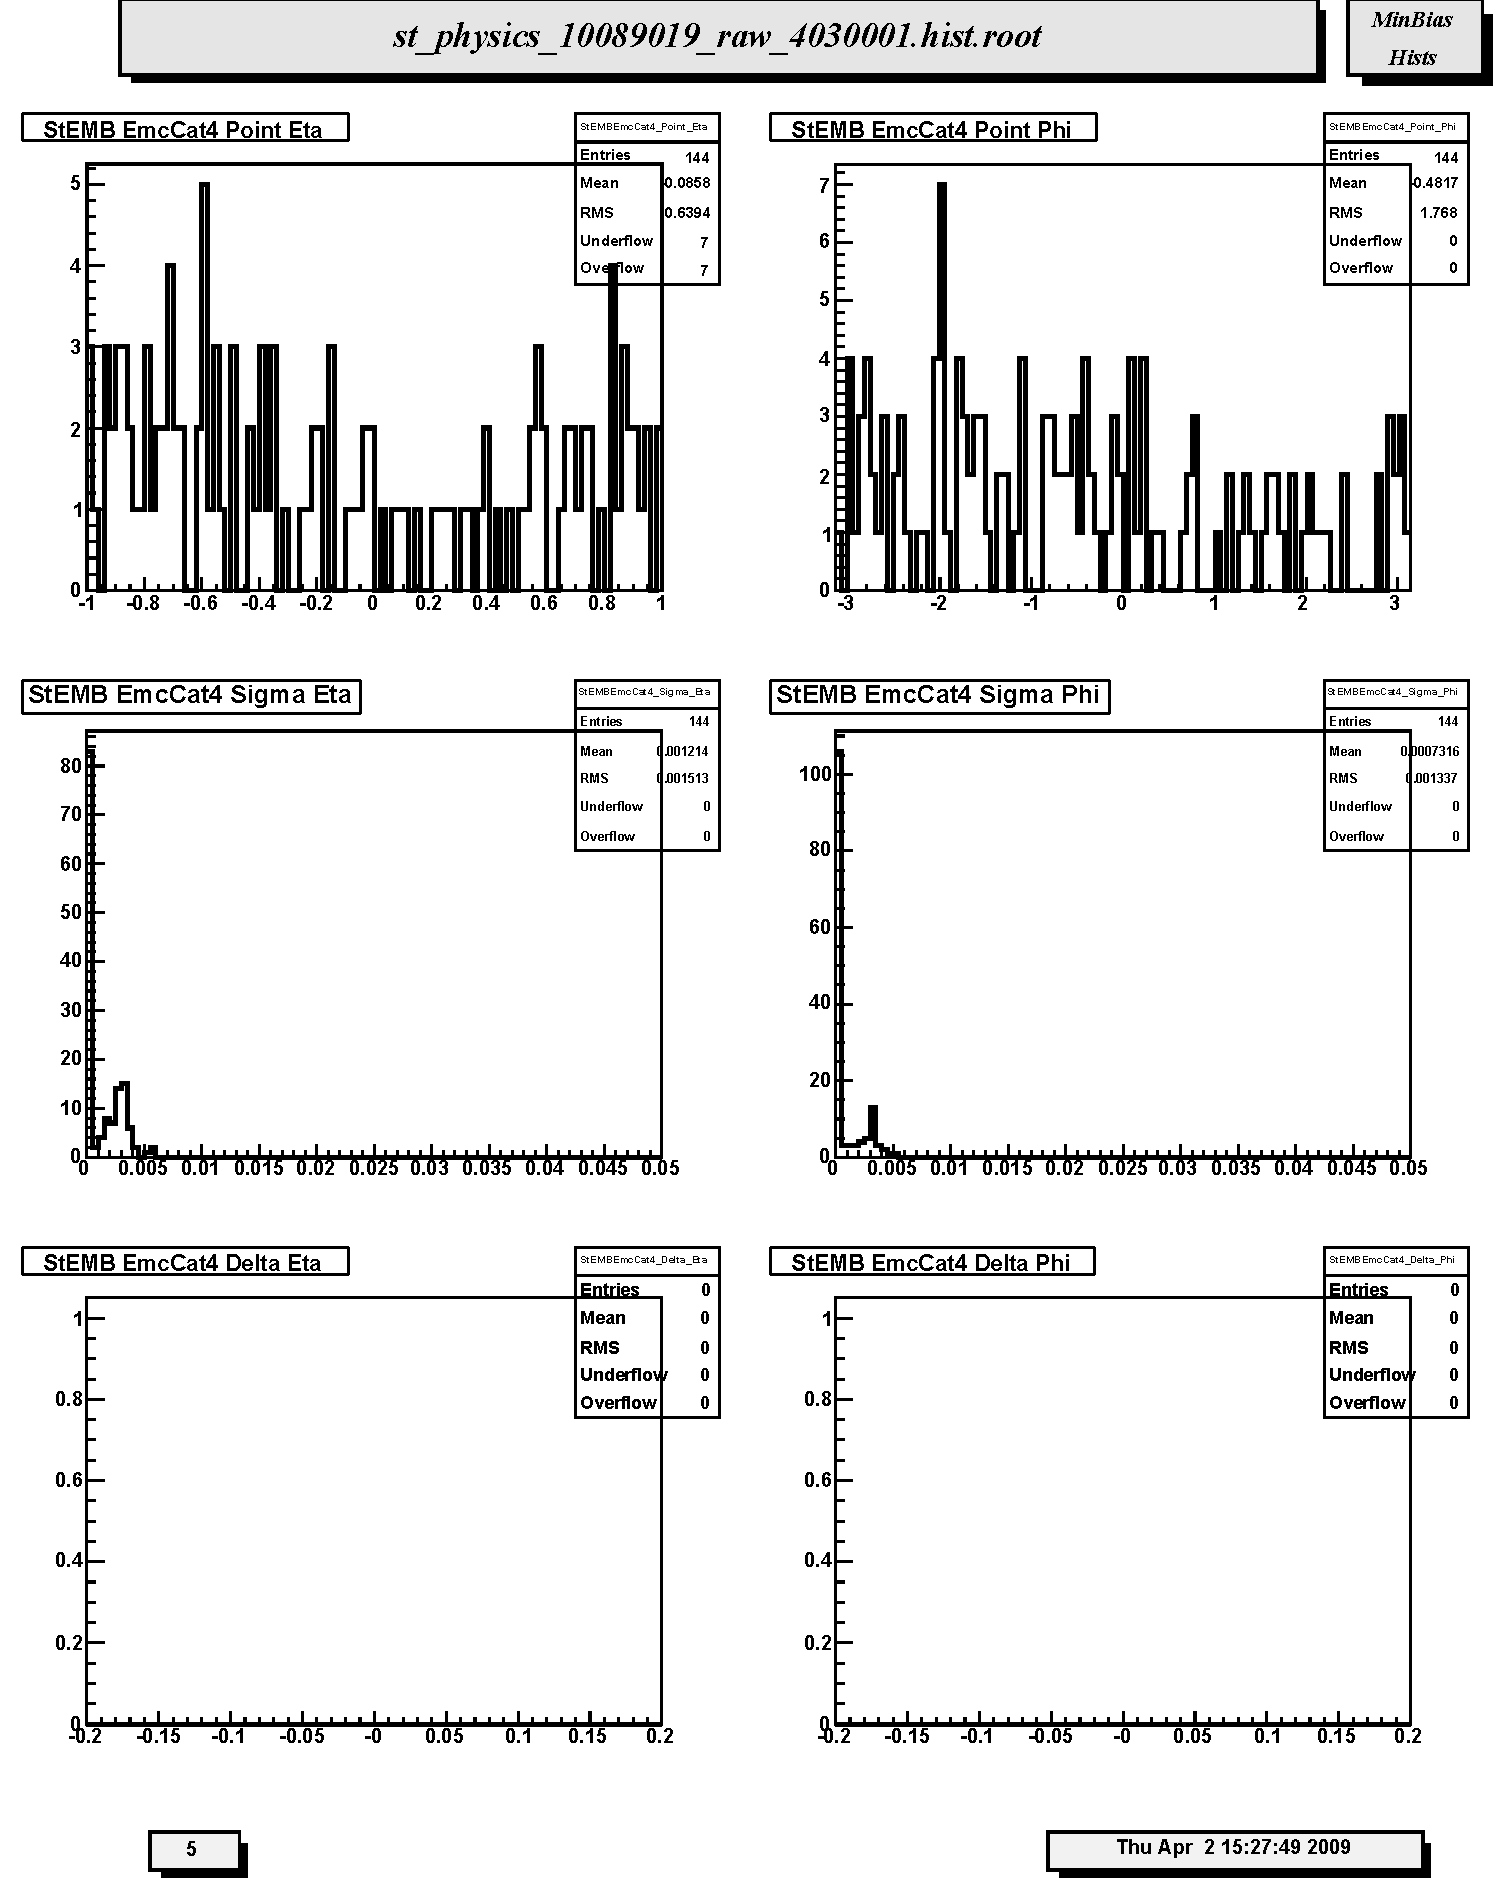
1. StEMB EmcCat4 Point Eta: Pseudorapidity distribution for EMC-SMD Category 4 clusters. Distribution should nominally be flat.
2. StEMB EmcCat4 Point Phi: Azimuthal distribution for EMC-SMD Category 4 clusters. Distribution should nominally be flat.
3. StEMB EmcCat4 Sigma Eta: Distribution of widths (sigma) of Category 4 Barrel EMC-SMD clusters with respect to pseudorapidity.
4. StEMB EmcCat4 Sigma Phi: Distribution of widths (sigma) of Category 4 Barrel EMC-SMD clusters with respect to azimuthal angle.
5. StEMB EmcCat4 Delta Eta: Differences between centroids of Category 4 Barrel EMC-SMD clusters and projected positions of TPC tracks at BEMC with respect to pseudorapidity. Should be peaked at ~0. Not filled in Run 9.
6. StEMB EmcCat4 Delta Phi: Differences between centroids of Category 4 Barrel EMC-SMD clusters and projected positions of TPC tracks at BEMC with respect to azimuthal angle. Should be peaked at ~0. Not filled in Run 9.
Page 6
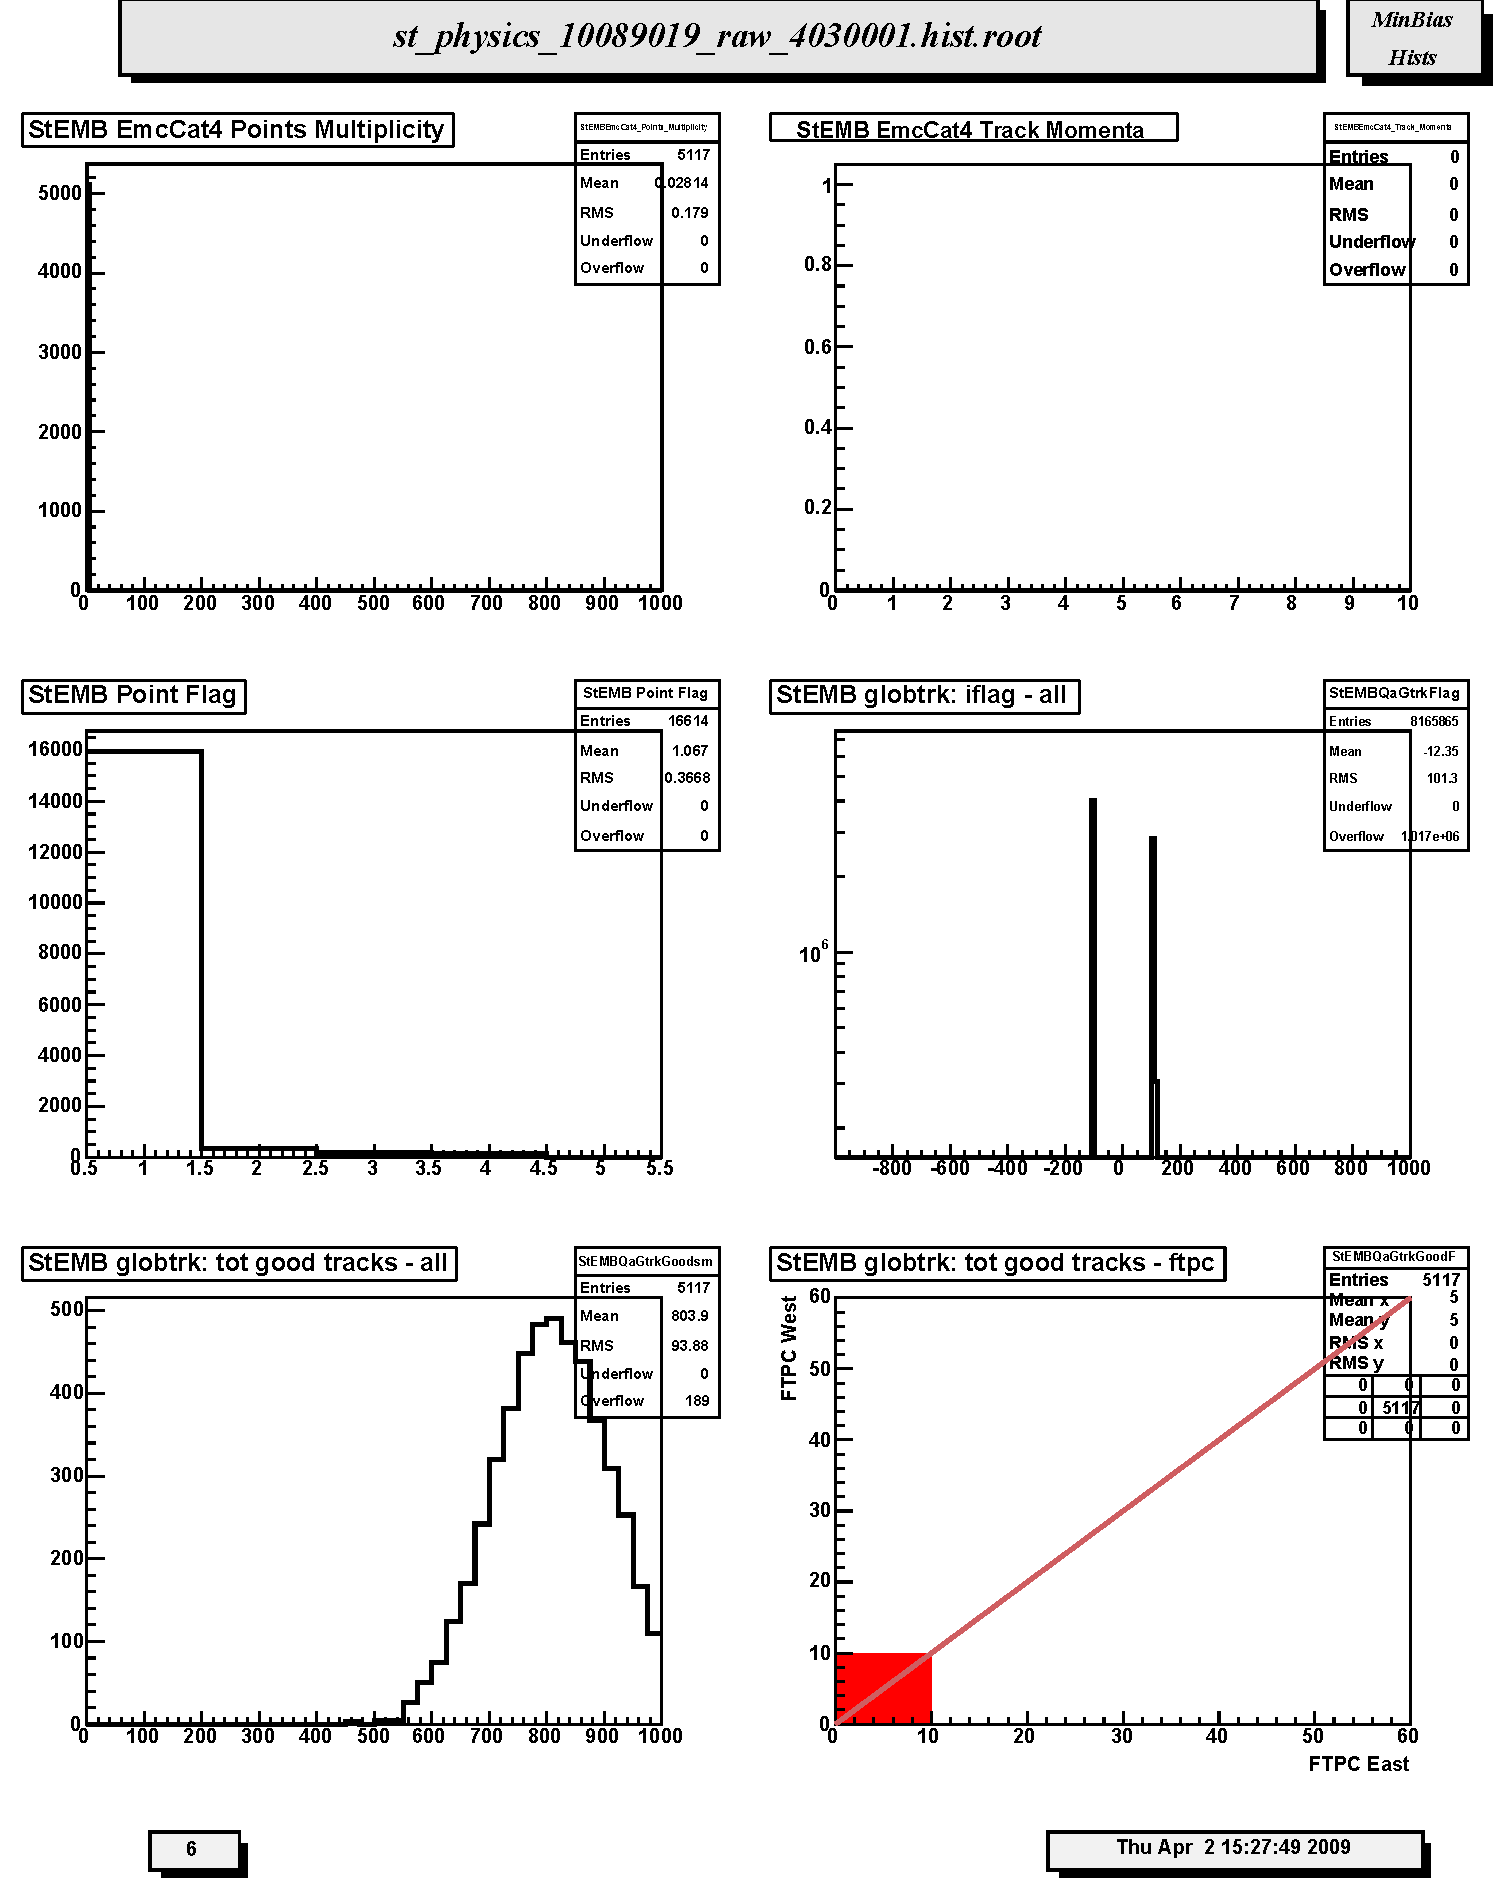
1. StEMB EmcCat4 Points Multiplicity: Frequency distribution of number of Category 4 clusters per event. Not filled in Run 9.
2. StEMB EmcCat4 Track Momenta : Distribution of TPC global track momentum for Barrel EMC-SMD Category 4 clusters. Not filled in Run 9.
3. StEMB Point Flag: Distribution of Barrel EMC and SMD cluster types by Category number. There should be a reasonable fraction of Cat4 clusters; report if less than 10% of total.
4. StEMB globtrk: iflag - all : Quality flag values for all global tracks. Some with large, negative values may not appear on plot; check stat. box for underflows. Majority of tracks should have iflag>0, corresponding to good, usable tracks. Refer to: dst_track_flags.html and kalerr.html for description of flag values. Note that in Runs 7-9 about half the tracks have iflag < 0 for unknown reasons.
5. StEMB globtrk: tot good tracks - all: Distribution of the number of good global tracks in the TPC per trigger; including pileup.
6. StEMB globtrk: tot good tracks - ftpc: Not filled in this run. Scatter plot of good global track multiplicities in FTPC West versus FTPC East.
Page 7
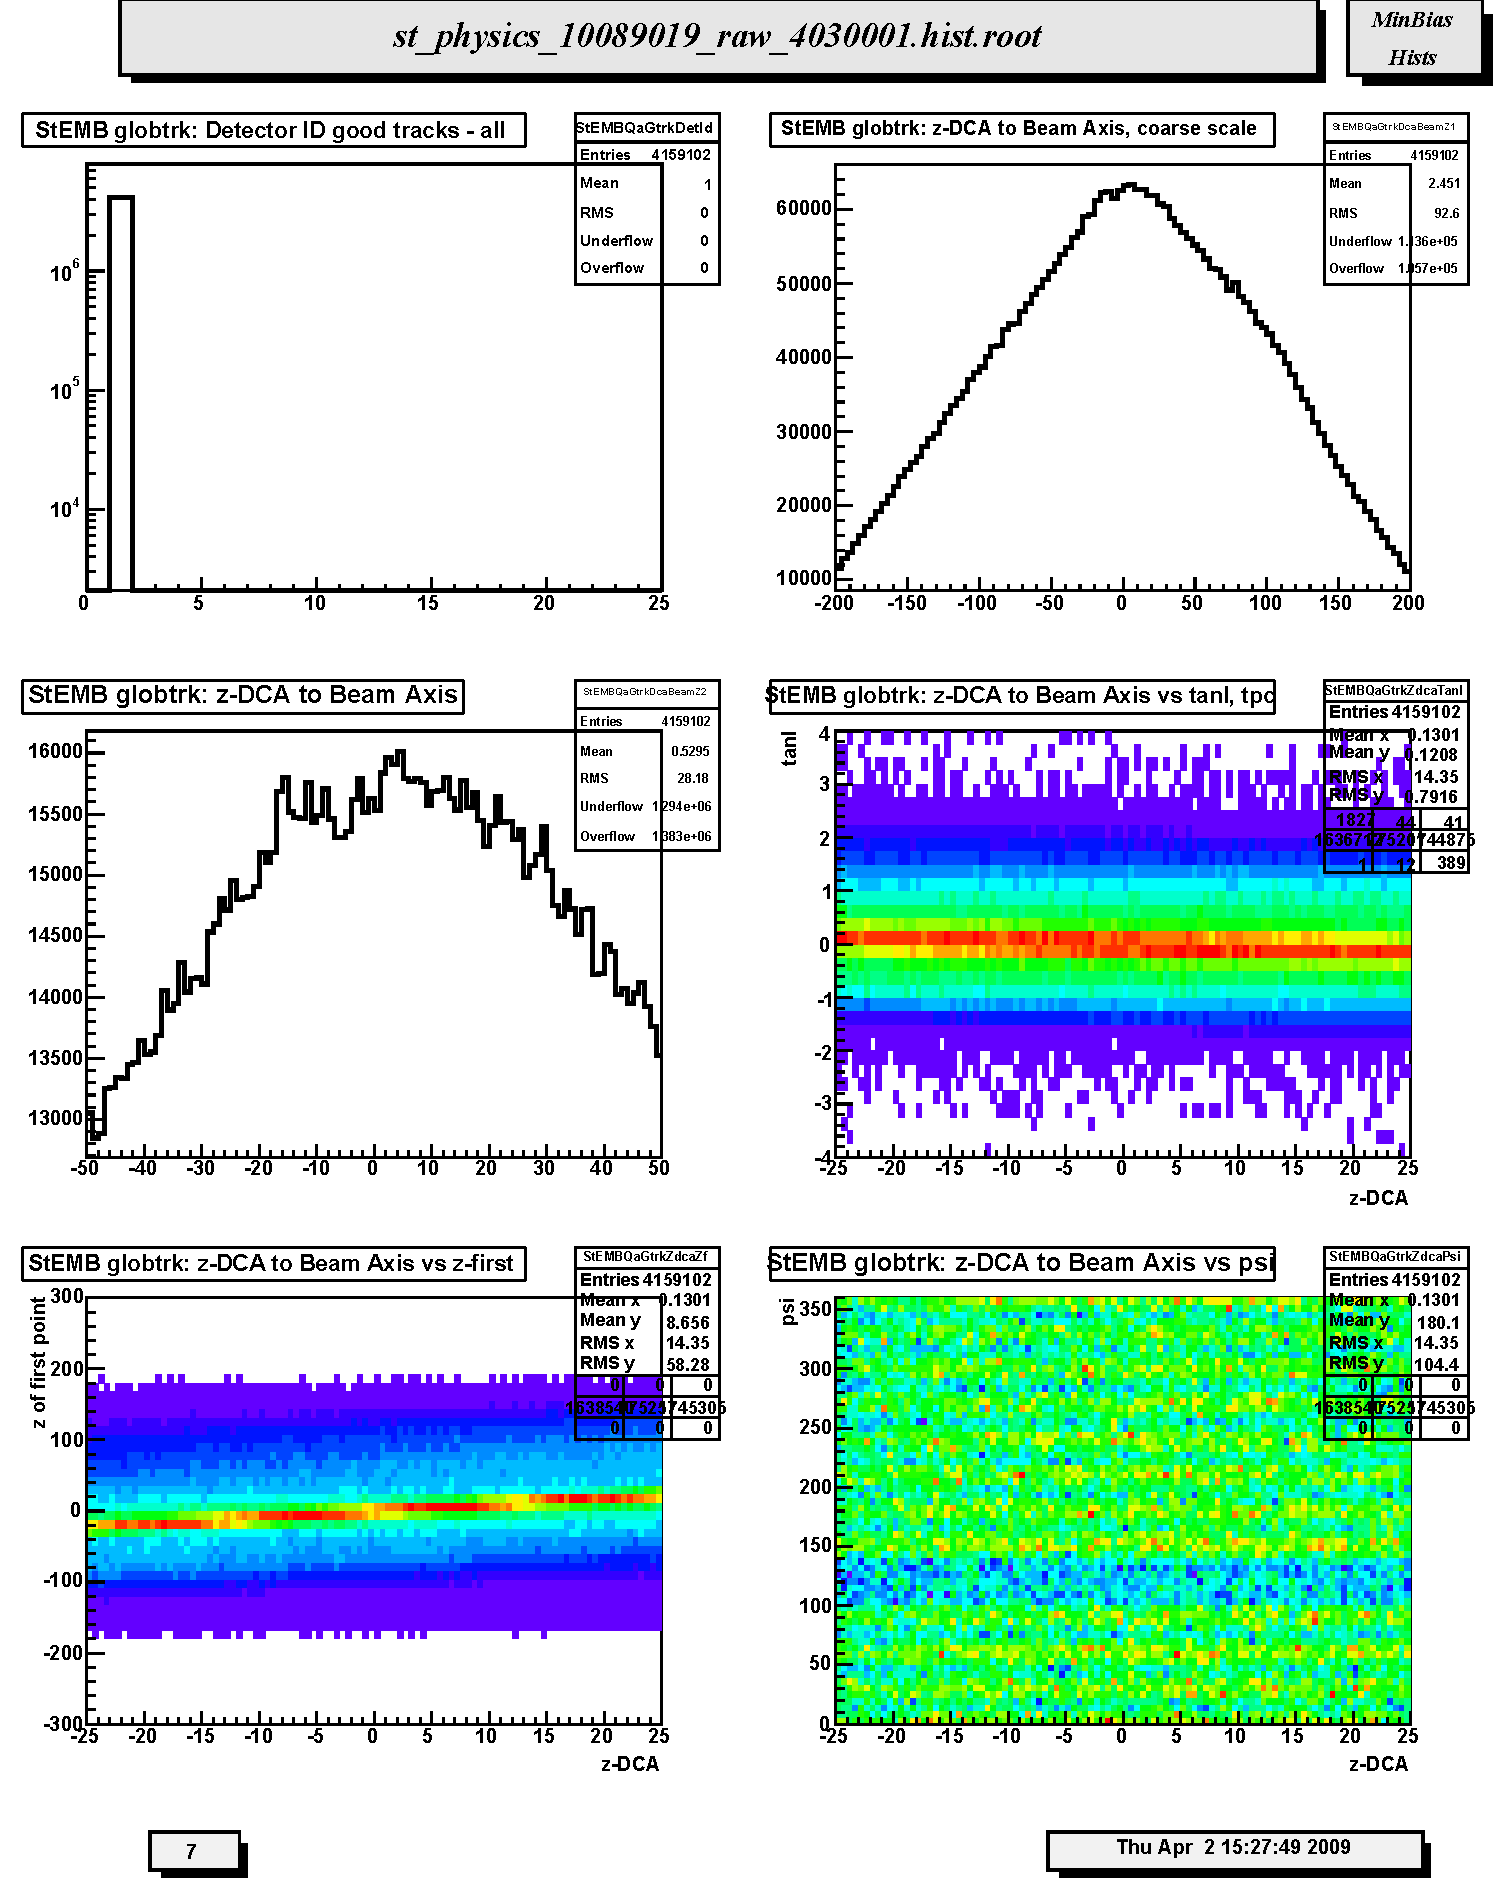
1. StEMB globtrk: Detector ID good tracks - all: Global track detector IDs for good tracks. Refer to: /afs/rhic/star/packages/DEV00/pams/global/inc/StDetectorDefinitions.h for Detector ID codes.
2. StEMB globtrk: z-DCA to Beam Axis, coarse scale: Coarse scale distribution along the z-axis (from -200 to +200 cm) of the DCA points to the nominal beam line (z-axis, x=y=0) for all TPC global tracks. Peaks indicate probable locations of individual collision vertices (not useful in p-p). Indentification of individual collision vertices is unlikely.
3. StEMB globtrk: z-DCA to Beam Axis: Fine scale distribution along the z-axis (from -50 to +50 cm) of the DCA points to the nominal beam line (z-axis, x=y=0) for all TPC global tracks. Peaks indicate probable locations of individual collision vertices. Indentification of individual collision vertices is unlikely in p-p.
4. StEMB globtrk: z-DCA to Beam Axis vs tanl, tpc: Not useful for p-p. Scatter plot of the tangent of the dip angle (tanl) versus the z-coordinate (from -25 to 25 cm) of the DCA points to the nominal beam line (z-axis, x=y=0) for all TPC global tracks. Vertical bands should be seen corresponding to individual events. The bands should be smooth and continuous; breaks at tanl=0 indicate probable TPC calibration errors in either the t0 offset or the drift speed. This is best seen for high multiplicity events. Cross reference for calibration errors with z-DCA to beam axis versus z-coord. of first hit on track.
5. StEMB globtrk: z-DCA to Beam Axis vs z-first: Not useful for p-p. Scatter plot of the z-coordinate of the first fitted hit in the TPC versus the z-coordinate (from -25 to 25 cm) of the DCA points to the nominal beam line (z-axis, x=y=0) for all TPC-only global in which the first point used in the fit lies in the TPC. Vertical bands should be seen corresponding to individual events. The bands should be smooth and continuous; breaks at z=0 indicate TPC calibration errors in either the t0 offset or the drift speed. This is best seen for high multiplicity events.
6. StEMB globtrk: z-DCA to Beam Axis vs psi: Not useful for p-p. Scatter plot of the azimuthal direction angle (psi) versus the z-coordinate (from -25 to 25 cm) of the DCA points to the nominal beam line (z-axis, x=y=0) for all TPC global tracks. Vertical bands should be seen corresponding to individual events. The bands should be smooth, straight and continuous indicating azimuthal symmetry in the tracking. Bends or offsets could indicate problems in individual TPC sectors such as voltage sags or drifts. These are best studied with high multiplicity events.
Page 8
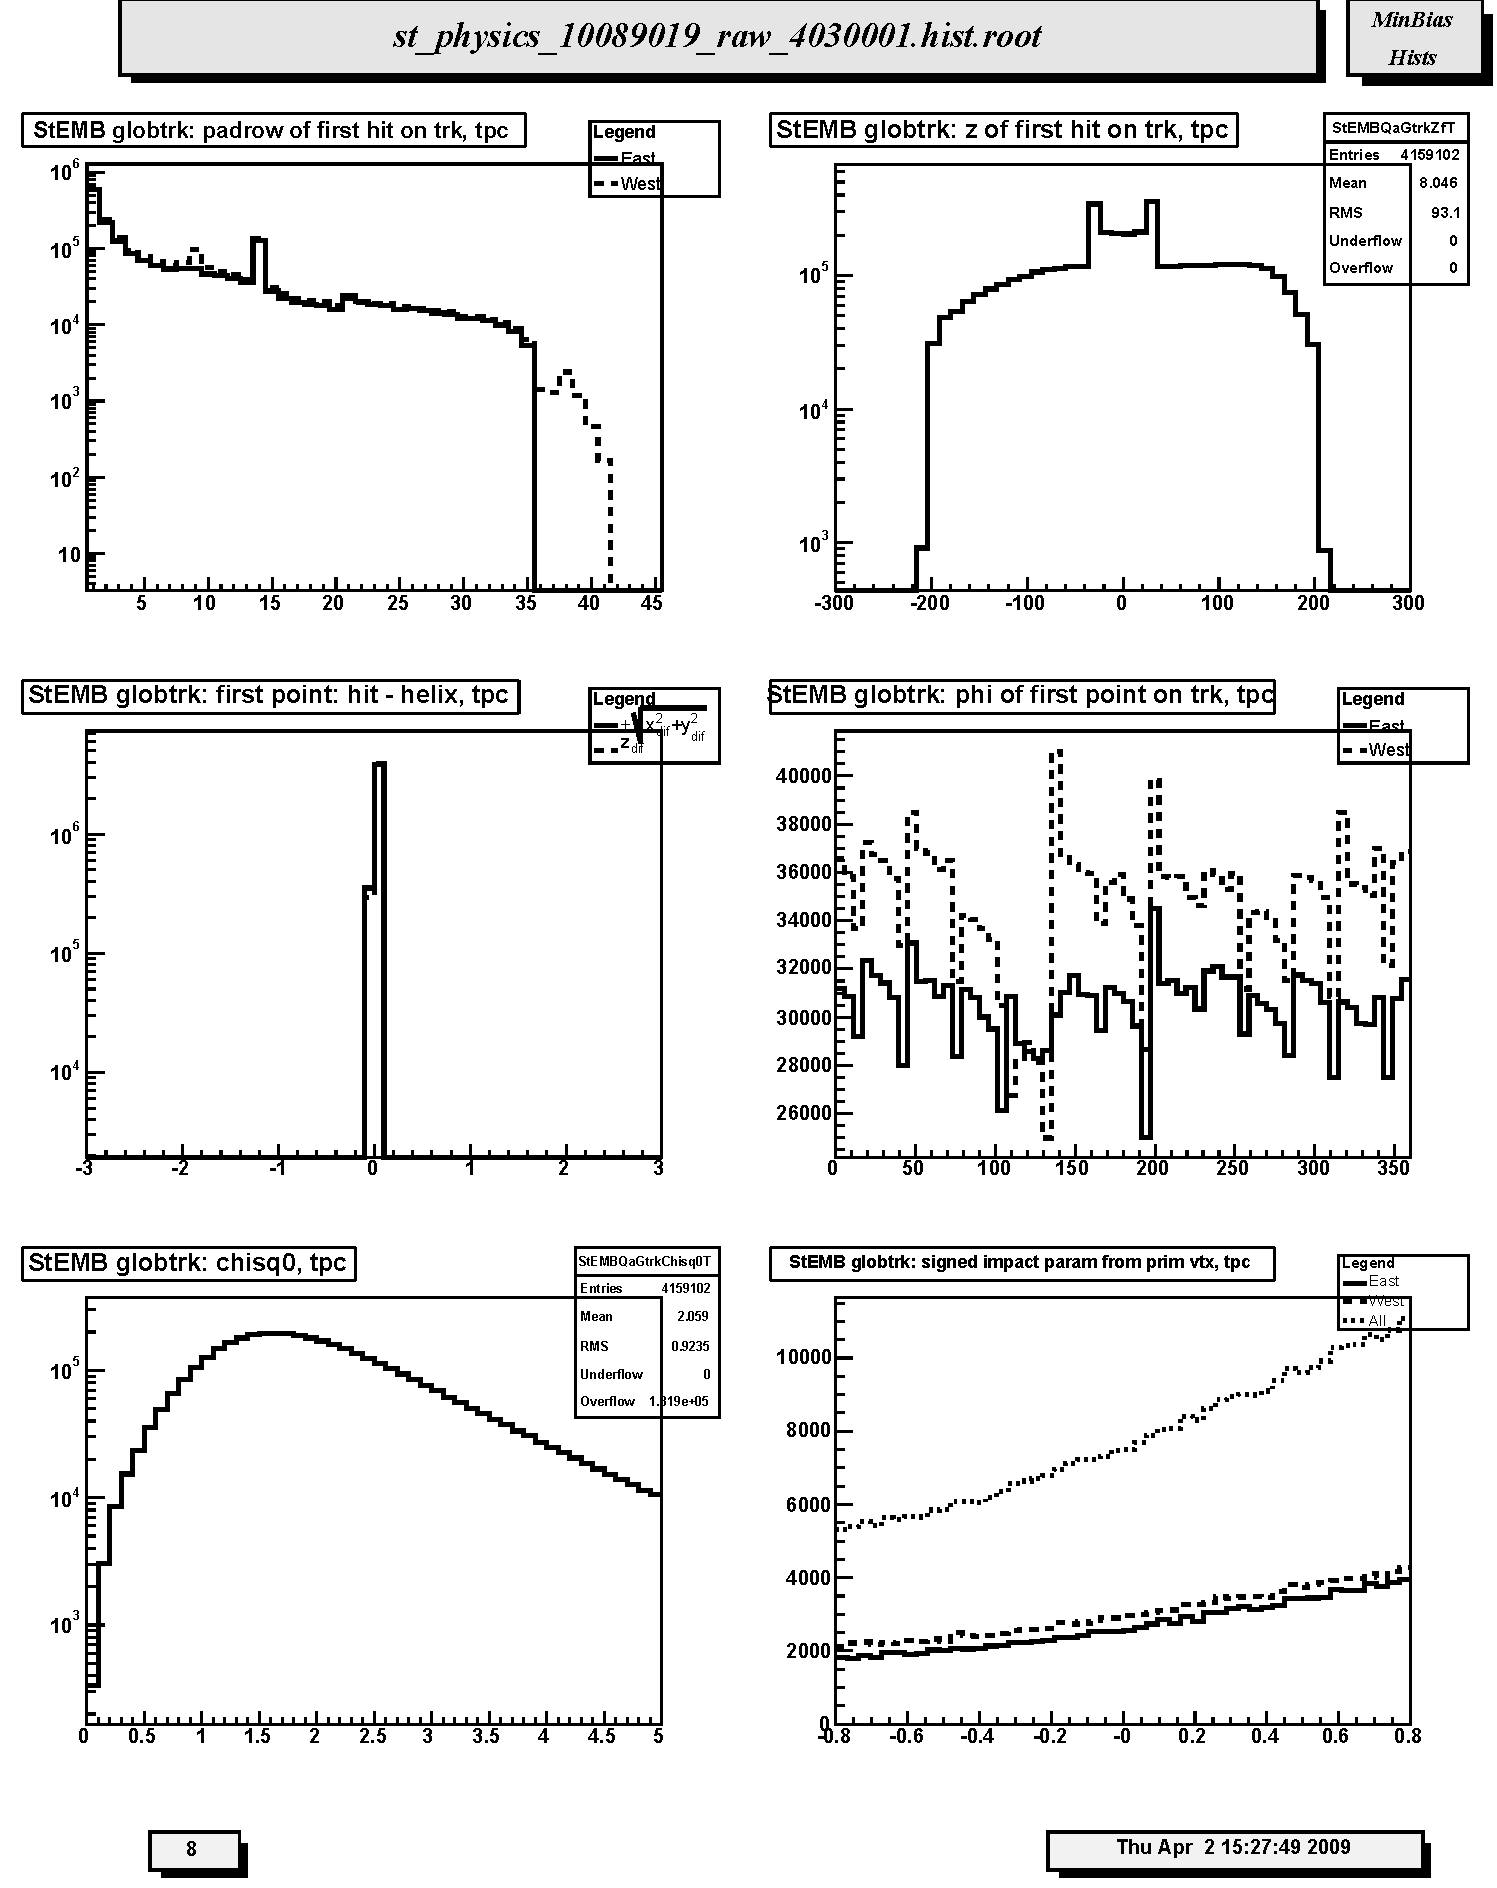
1. StEMB globtrk: padrow of first hit on trk, tpc: Distribution of first fitted space point with respect to pad row number for TPC-only global tracks. Should peak at 1 with a minor peak at padrow 14 (beginning of outer sector); the latter should not be too big relative to that at row 1. Other peaks may indicate large, missing sections of the TPC read-out causing breaks, and consequently additional, false new starting points for tracks. The excess data for TPC west beyond padrow 35 is due to EEMC tracking needs.
2. StEMB globtrk: z of first hit on trk, tpc: Distribution of first fitted space point with respect to z for TPC-only global tracks. Should be approx. symmetric. The spikes and broad peak near z=0 are due to including post-trigger pileup collisions.
3. StEMB globtrk: first point: hit - helix, tpc: Residuals at FIRST point on track for TPC-only global tracks. The quantities plotted are the longitudinal (along z-axis, dashed line) and transverse (in x-y plane, solid line) differences between the coordinates of the first hit and the DCA point on the helix fit to the first point. For the transverse residual, positive (negative) values correspond to hits inside (outside) the circular projection of the helix onto the bend plane. FWHM should be less than ~ 1cm.
4. StEMB globtrk: phi of first point on trk, tpc: Distribution of first fitted space point with respect to azimuthal angle (phi) for TPC-only global tracks. The solid (dashed) line is for the east (west) half of the TPC. These should be approximately equal and flat within statistics, except for the 12-sector structure.
5. StEMB globtrk: chisq0, tpc: Chi-square per degree of freedom for TPC global tracks. Should peak just below 1.
6. StEMB globtrk: signed impact param from prim vtx, tpc: Two-dimensional (2D) (in the transverse plane) signed impact parameter (in cm) from primary vertex for East (solid line), West (dashed line) and All (dotted line) TPC-only global tracks. Should be centered at zero.
Page 9
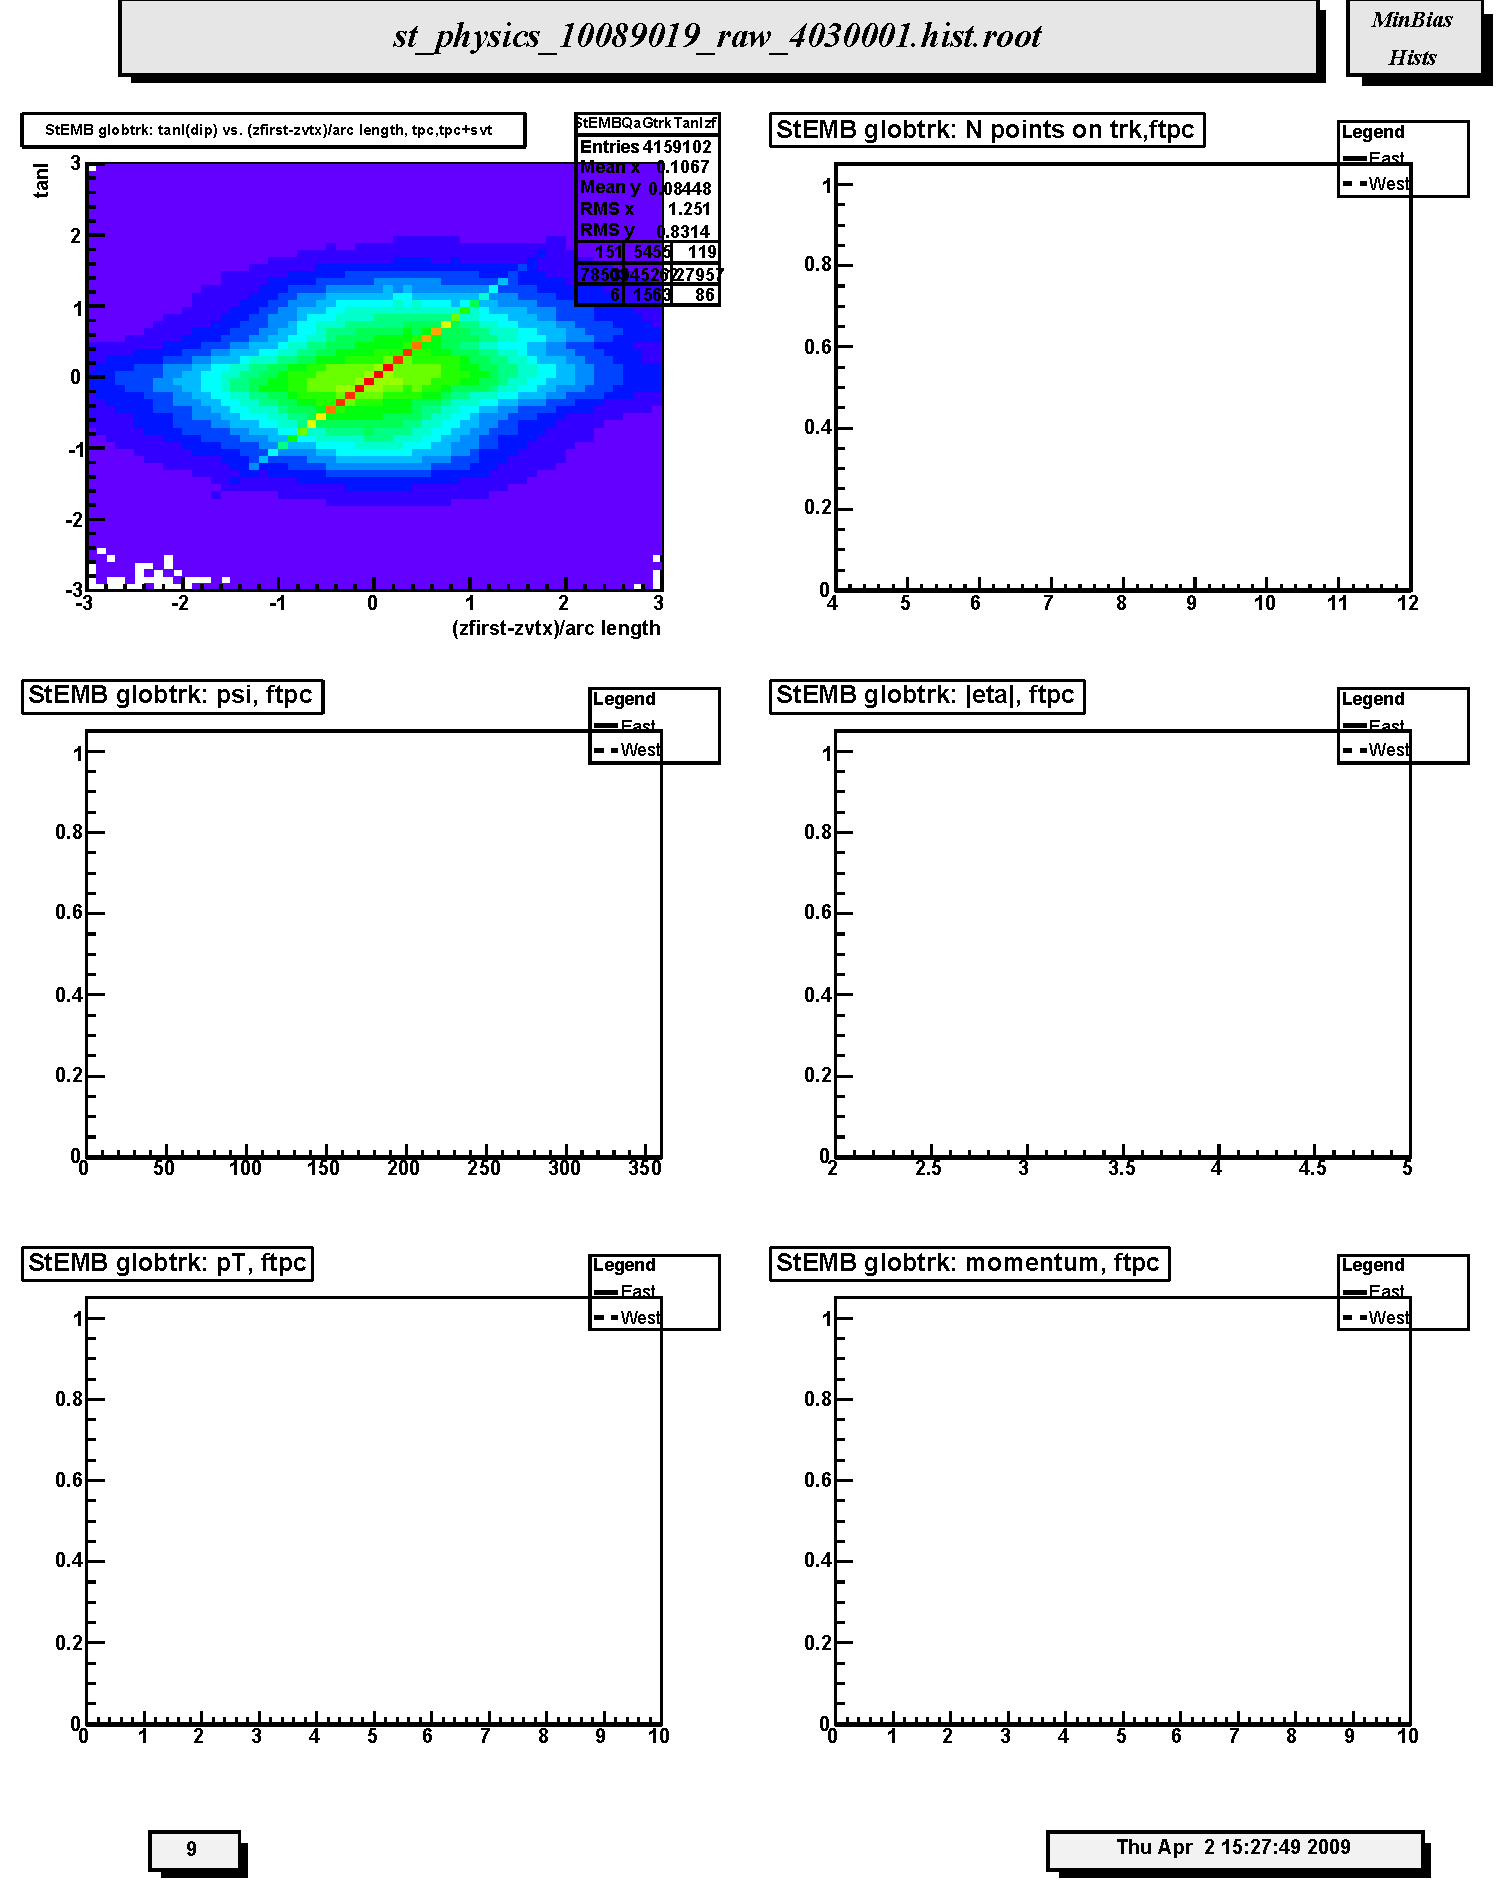
1. StEMB globtrk: tanl(dip) vs. (zfirst-zvtx)/arc length, tpc,tpc+svt: Scatter plot of tangent of dip angle (tanl) versus (z_first - z_primvrtx)/arc-length for TPC-only global tracks whose first fitted point is in the TPC. Variable 'z_first' is the z coordinate of the first fitted point in the TPC. Variable 'z_primvrtx' is the z-coordinate of the primary vertex for the event. Variable 'arc-length' is 2R*arcsin(delta_r/2R) where R = track radius of curvature and delta_r is the transverse distance between the primary vertex and the first hit on track. Primary tracks lie along the 45 deg diagonal. Secondary tracks and strays lie scattered to either side. The diagonal band should appear clearly and be straight and smooth without kinks, breaks or bends.
2. StEMB globtrk: N points on trk,ftpc: Not filled in Run 9. Distribution of the number of fitted points on track for FTPC-East (solid line) and FTPC-West (dashed line) global tracks. Distributions should be similar except fewer tracks for west than east. Also depends on the relative fraction of active readout in each detector.
3. StEMB globtrk: psi, ftpc: Not filled in Run 9. Azimuthal distributions for track direction angle (psi) for FTPC-East (solid line) and FTPC-West (dashed line) global tracks. These should be flat within statistics except for the hexagonal FTPC sector structure. There will be fewer west tracks than east for d+Au.
4. StEMB globtrk: |eta|, ftpc: Not filled in Run 9. Distributions of absolute value of pseudorapidity for FTPC-East (solid line) and FTPC-West (dashed line) global tracks. These should be similar (modulo for d+Au) and range from about 2.5 to 4.5.
5. StEMB globtrk: pT, ftpc: Not filled in Run 9. Transverse momentum (GeV/c) distributions for FTPC-East (solid line) and FTPC-West (dashed line) global tracks. These should be similar (modulo d+Au)within statistics.
6. StEMB globtrk: momentum, ftpc: Not filled in Run 9. Total momentum (GeV/c) distributions for FTPC-East (solid line) and FTPC-West (dashed line) global tracks. These should be similar (modulo d+Au) within statistics.
Page 10
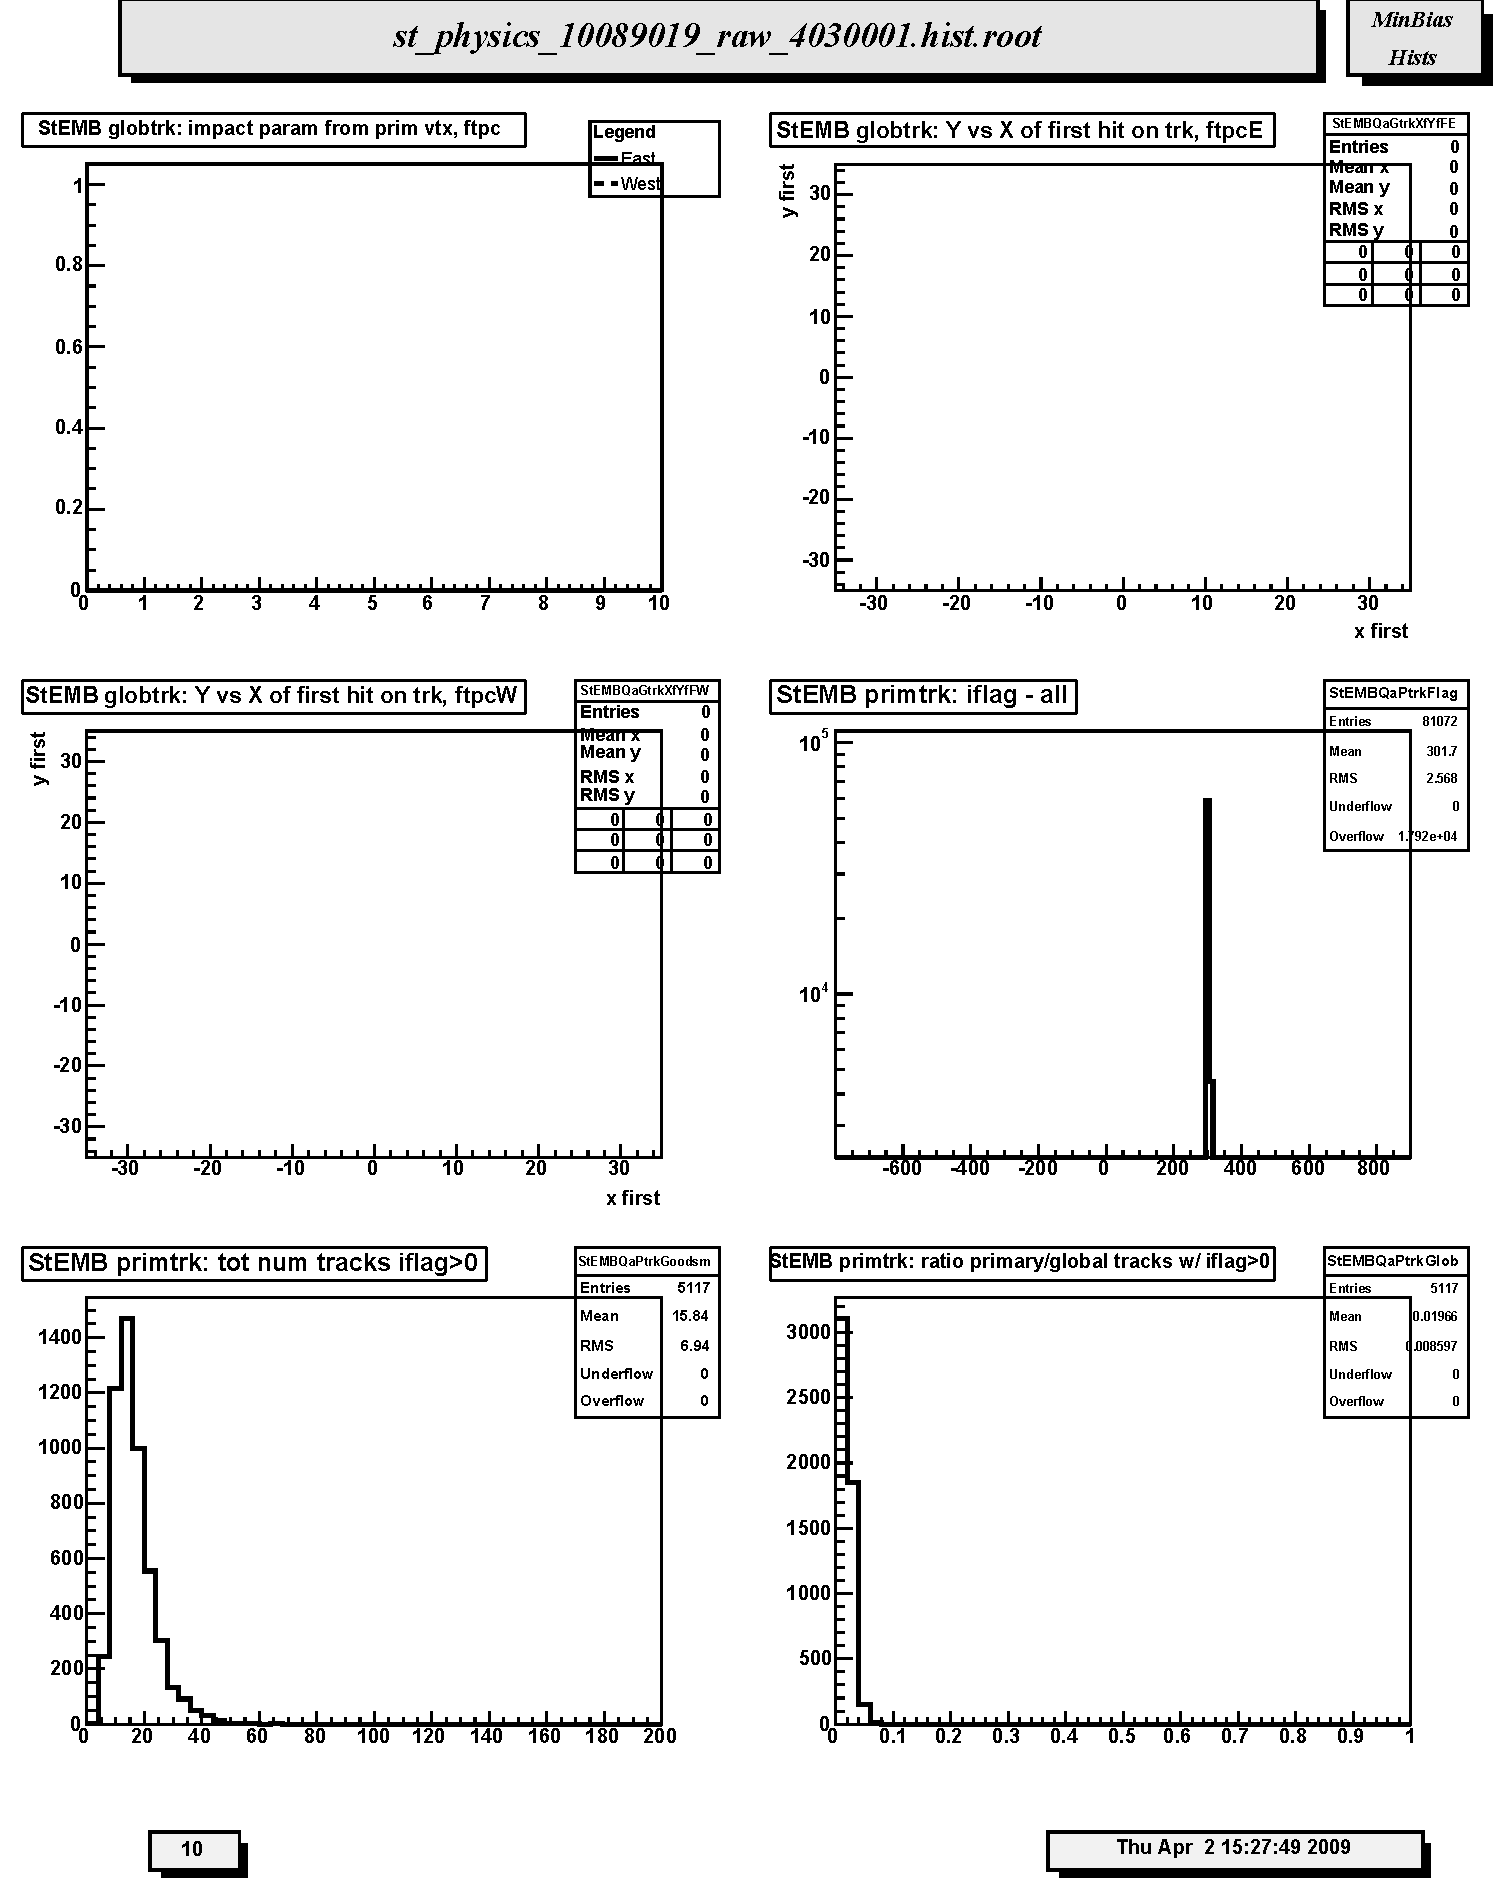
1. StEMB globtrk: impact param from prim vtx, ftpc: Not filled in Run 9. Distribution of impact parameter values for global FTPC East tracks (solid curve) and West tracks (dashed curve) with respect to the main TPC global track determined primary vertex.
2. StEMB globtrk: Y vs X of first hit on trk, ftpcE: Not filled in Run 9. Scatter plot of (x,y) coordinates for the first fitted space points in FTPC-East global tracks. These should be uniformly populated with hits; FTPC hexagonal structure is apparent.
3. StEMB globtrk: Y vs X of first hit on trk, ftpcW: Not filled in Run 9. Scatter plot of (x,y) coordinates for the first fitted space points in FTPC-West global tracks. These should be uniformly populated with hits; FTPC hexagonal structure is apparent.
4. StEMB primtrk: iflag - all: Quality flag values for all primary tracks. Some with large, negative values may not appear on plot; check stat. box for underflows. Majority of tracks should have iflag>0, corresponding to good, usable tracks. Refer to: dst_track_flags.html and kalerr.html for description of flag values.
5. StEMB primtrk: tot num tracks iflag>0: Distribution of total number of primary tracks per triggered event.
6. StEMB primtrk: ratio primary/global tracks w/ iflag>0: Ratio of good primary to good global tracks for all detectors. For p-p in Run 9 this ratio is very small due to the large pile-up contribution to the global track population.
Page 11
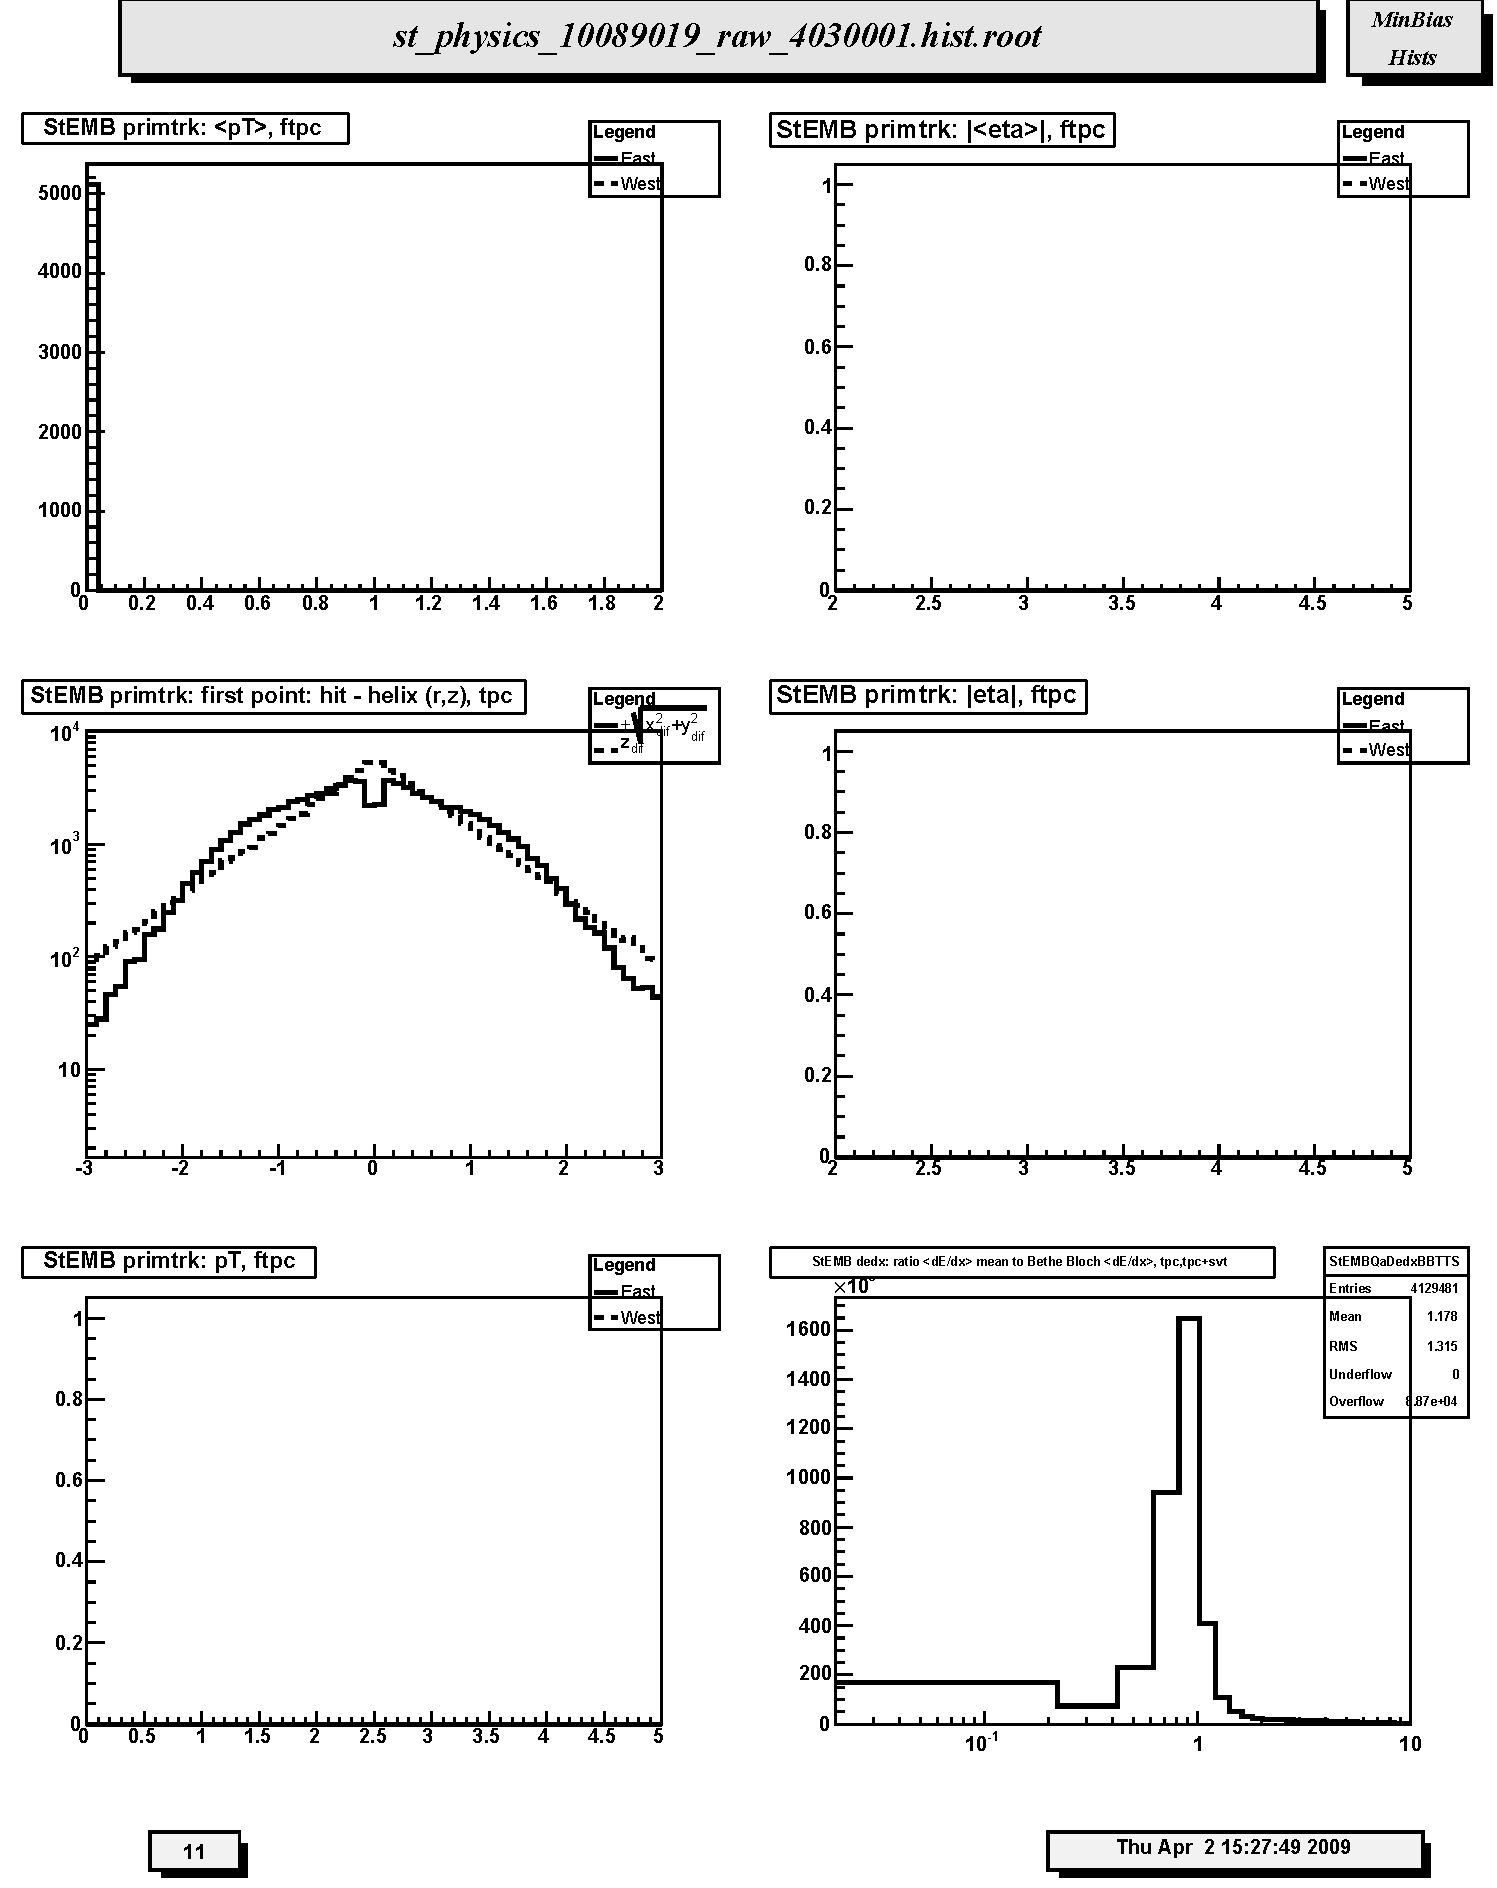
1. StEMB primtrk:, ftpc: Not filled in Run 9. Transverse momentum (GeV/c) distributions for FTPC-East (solid line) and FTPC-West (dashed line) primary tracks. These should be similar within statistics.
2. StEMB primtrk: ||, ftpc: Not filled in Run 9. Distributions of absolute value of mean pseudorapidity for FTPC-East (solid line) and FTPC-West (dashed line) primary tracks. These should be similar within statistics and range from about 2.5 to 3.5.
3. StEMB primtrk: first point: hit - helix (r,z), tpc: Residuals at first point on track for TPC-only primary tracks. The quantities plotted are the longitudinal (along z-axis, dashed line) and transverse (in x-y plane, solid line) differences between the coordinates of the first hit and the DCA point on the helix fit to the first point. For the transverse residual, positive (negative) values correspond to hits inside (outside) the circular projection of the helix onto the bend plane. FWHM should be less than ~ 1cm.
4. StEMB primtrk: |eta|, ftpc: Not filled in Run 9. Distributions of absolute value of mean pseudorapidity for FTPC-East (solid line) and FTPC-West (dashed line) primary tracks. These should be similar within statistics and range from about 2.5 to 3.5.
5. StEMB primtrk: pT, ftpc: Not filled in Run 9. Transverse momentum (GeV/c) distributions for FTPC-East (solid line) and FTPC-West (dashed line) primary tracks. These should be similar within statistics.
6. StEMB dedx: ratio Distribution of ratio of mean dE/dx to Bethe-Bloch dE/dx for pions at the same momentum for TPC-only global tracks. Should peak at ~1. Tests calibration of charge deposition in TPC gas.
Page 12
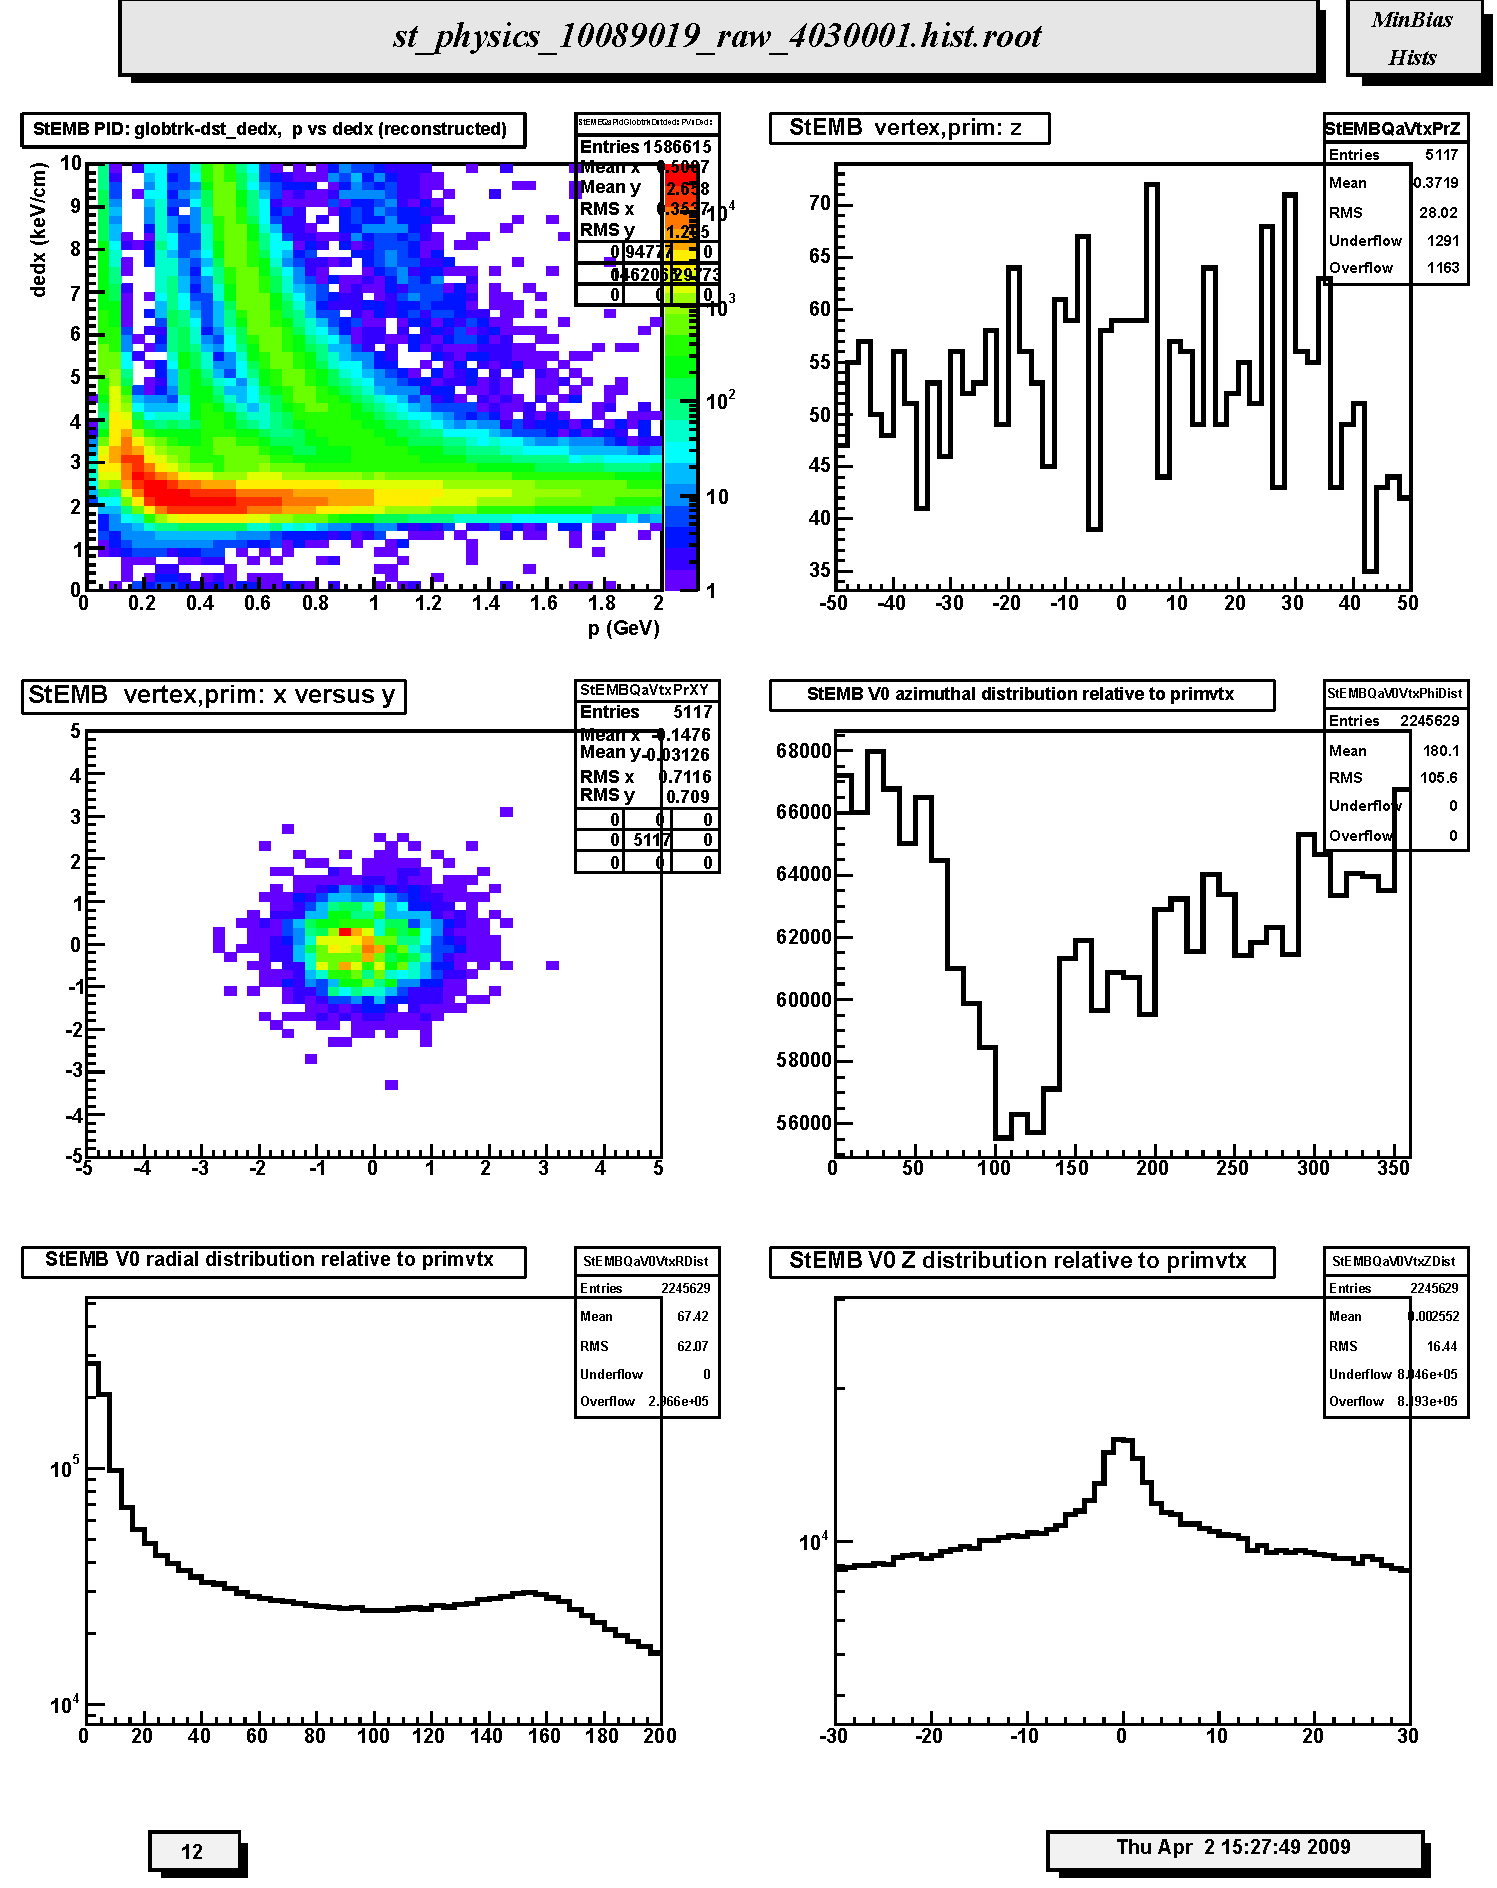
1. StEMB PID: globtrk-dst_dedx, p vs dedx (reconstructed): Scatter plot of truncated mean dE/dx versus total momentum (GeV/c) for TPC-only global tracks. Should be able to see Bethe-Bloch bands for pions, kaons and protons if statistics are sufficient.
2. StEMB vertex,prim: z : Distribution of primary vertex position along the z-axis out to abs(z) < 50 cm.
3. StEMB vertex,prim: x versus y: Scatter plot of the (x,y) coordinates of the primary vertex position. This should correspond to the determined beam transverse position. The amount of dispersion will depend on the trigger condition and multiplicity cuts and is large for p-p.
4. StEMB V0 azimuthal distribution relative to primvtx: Azimuthal distribution of V0 vertices relative to the primary vertex for each event. Should be flat within statistics.
5. StEMB V0 radial distribution relative to primvtx: Radial distribution of V0 vertices relative to the primary vertex for each event. Should fall off steeply with most vertices within ~10 cm.
6. StEMB V0 Z distribution relative to primvtx: Longitudinal (z) distribution of V0 vertices relative to the primary vertex for each event. Should fall off steeply with most vertices within ~10 cm.
Page 13
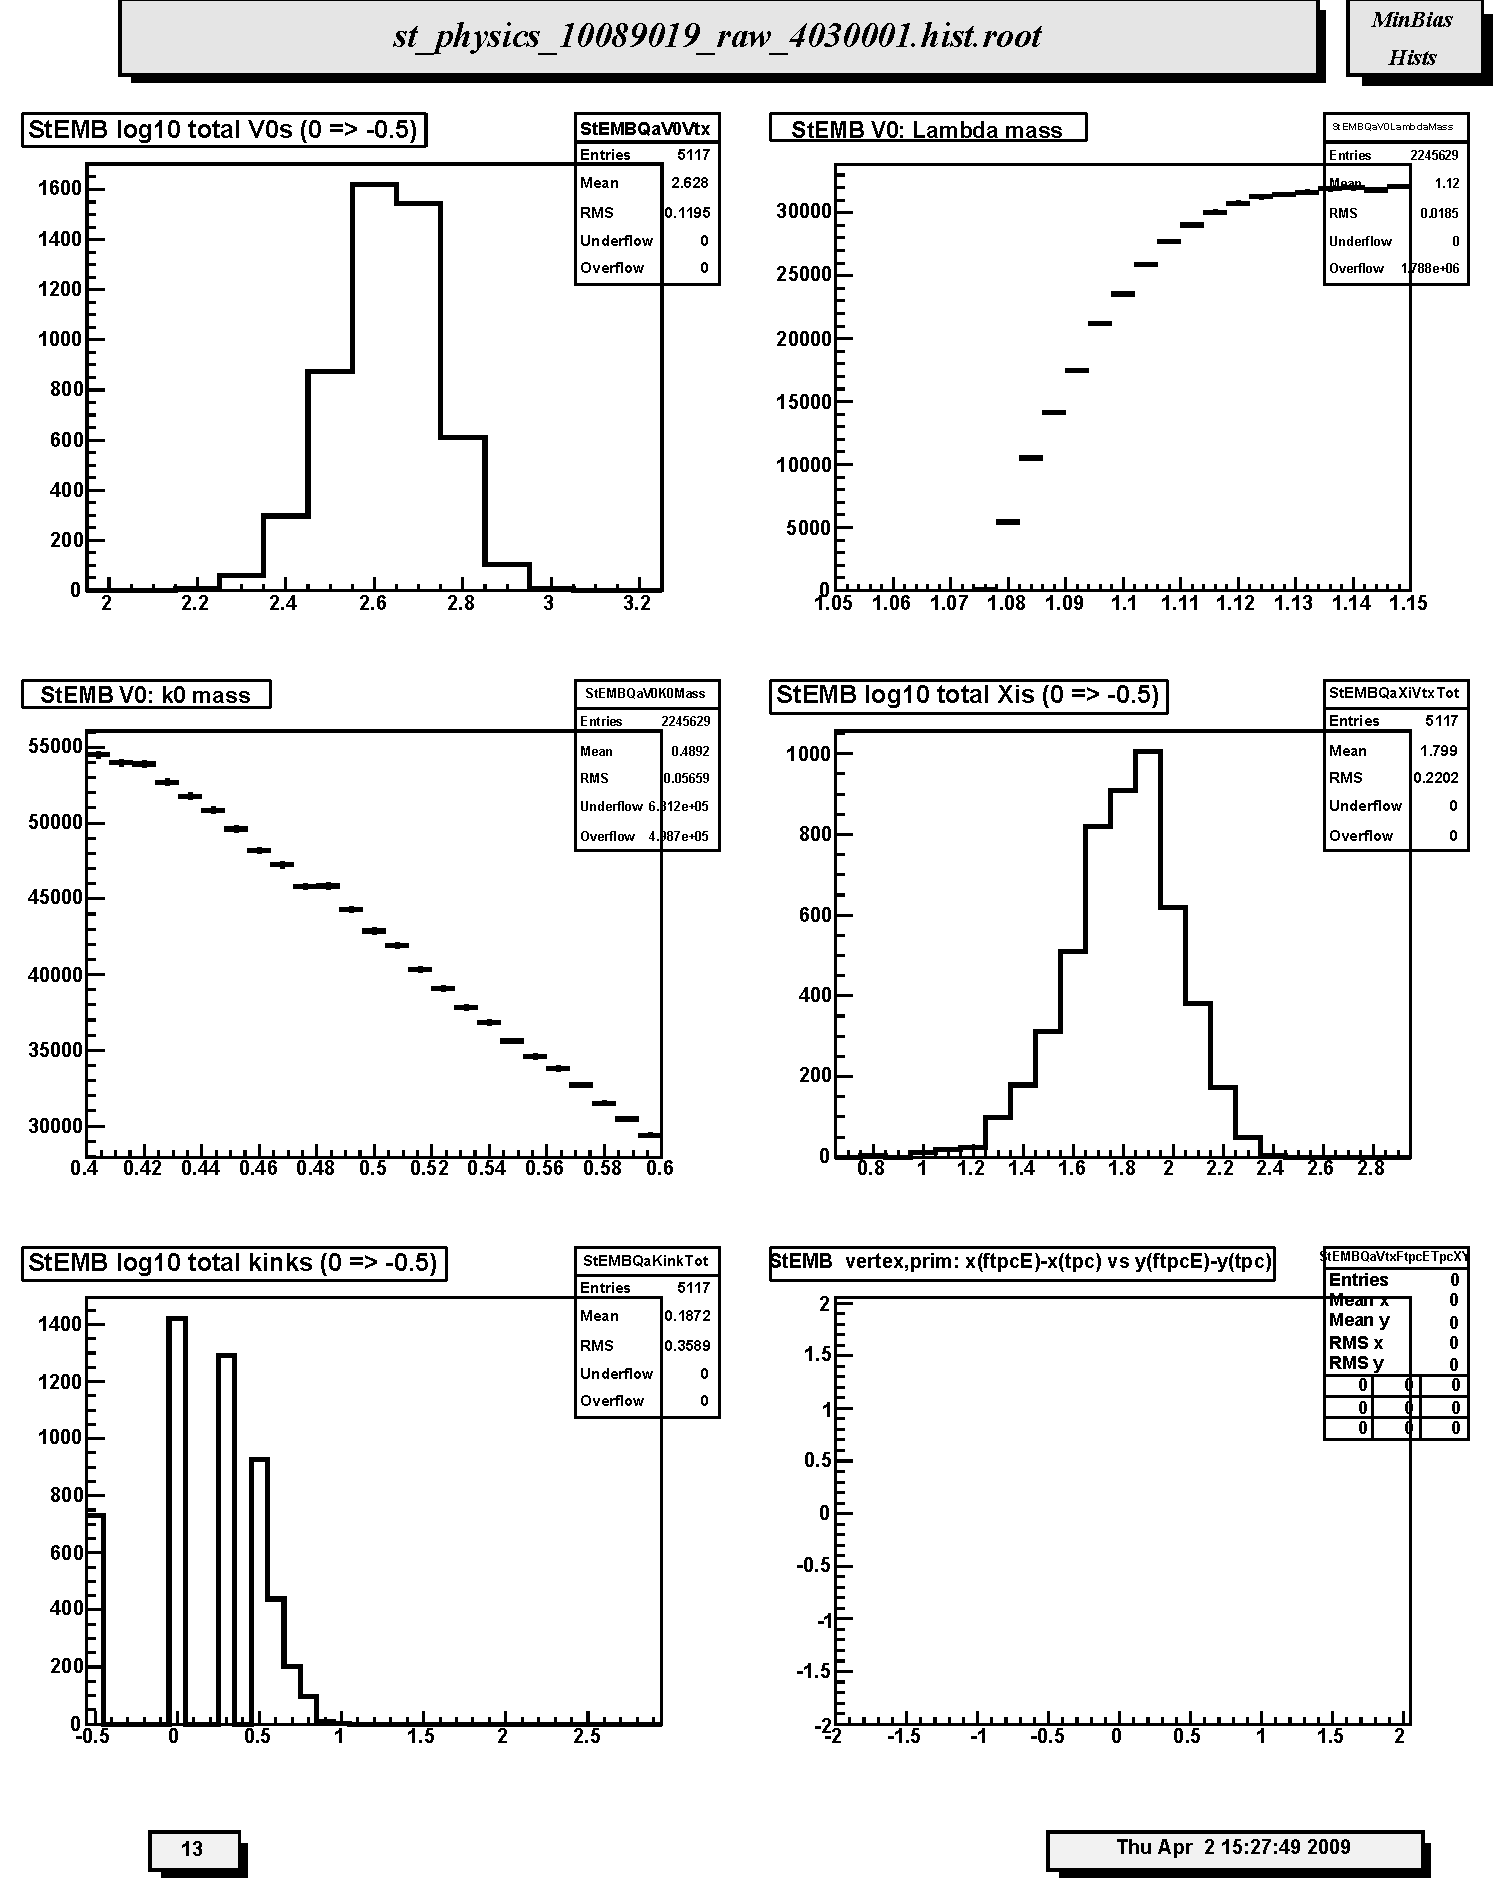
1. StEMB log10 total V0s (0 => -0.5): Log10 plot of the distribution of the number of V0 candidates found.
2. StEMB V0: Lambda mass:
3. StEMB V0: k0 mass:
4. StEMB log10 total Xis (0 => -0.5): Log10 plot of the distribution of the number of Xi (cascade) candidates found.
5. StEMB log10 total kinks (0 => -0.5): Log10 plot of the distribution of the number of track kink (single charge decay) candidates found.
6. StEMB vertex,prim: x(ftpcE)-x(tpc) vs y(ftpcE)-y(tpc): Not filled in Run 9. Scatter plot of the differences in x-y position (cm) for primary vertex positions determined by FTPC East global tracks and main TPC glbtrks. Should scatter about (0,0).
Page 14
1. StEMB vertex,prim: z(ftpcE)-z(tpc): Not filled in Run 9. Distribution of the differences along the z-axis, i.e. beam direction, in cm for primary vertex positions determined by FTPC East global tracks and main TPC glbtrks. The mean should be near 0.
2. StEMB vertex,prim: x(ftpcW)-x(tpc) vs y(ftpcW)-y(tpc): Not filled in Run 9. Scatter plot of the differences in x-y position (cm) for primary vertex positions determined by FTPC West global tracks and main TPC glbtrks. Should scatter about (0,0).
3. StEMB vertex,prim: z(ftpcW)-z(tpc): Not filled in Run 9. Distribution of the differences along the z-axis, i.e. beam direction, in cm for primary vertex positions determined by FTPC West global tracks and main TPC glbtrks. The mean should be near 0.
»
- Printer-friendly version
- Login or register to post comments