GridLeak Distortions after MiddleGridLeak Correction
GridLeak Distortions after MiddleGridLeak Correction
I recommend using tabbed browsing to view these plots, whereby you open a series of plots in a series of tabs, and then move through the tabs to see the variations/dependencies.
- Introduction
- Files used
- Phi dependence within sector
- Z dependence
- General Phi dependence
- Phi dependence of Phi dependence within sectors
- Dependencies of the GridLeak Gap
- Effects of increased GG opening rate
Introduction
Proceeding from the initial GridLeak study, we ran a test production with GLS=15, iGLS=oGLS=0, standard Wieman-shaped Event-by-Event SpaceCharge.Files used
- High luminosity Half Field: st_physics_5058060 (productionHalfHigh)
- High luminosity Rev Full Field: st_physics_5082052 (productionHigh)
- High luminosity Full Field: st_physics_5046043 (productionHigh)
Phi dependence within sector
Studying the dependence on phi angle WITHIN sectors, where phi=0 is straight through the middle of the sector, EIGHTH = pi/36 = 1/6th of a sector:productionHalfHigh: sector PHI =
- ( 3 EIGHTHS, 4 EIGHTHS)
- ( 2 EIGHTH , 3 EIGHTHS)
- ( 1 EIGHTH , 2 EIGHTHS)
- ( 0 , 1 EIGHTH )
- ( -1 EIGHTH , 0 )
- ( -2 EIGHTHS, -1 EIGHTH )
- ( -3 EIGHTHS, -2 EIGHTHS)
- ( -4 EIGHTHS, -3 EIGHTHS)
productionHigh: sector PHI =
- ( 3 EIGHTHS, 4 EIGHTHS)
- ( 2 EIGHTH , 3 EIGHTHS)
- ( 1 EIGHTH , 2 EIGHTHS)
- ( 0 , 1 EIGHTH )
- ( -1 EIGHTH , 0 )
- ( -2 EIGHTHS, -1 EIGHTH )
- ( -3 EIGHTHS, -2 EIGHTHS)
- ( -4 EIGHTHS, -3 EIGHTHS)
Z dependence
Studying the dependence on |z| (distance from the central membrane):productionHalfHigh: |z| =
- ( 0, 25cm )
- ( 25cm, 50cm )
- ( 50cm, 75cm )
- ( 75cm, 100cm )
- ( 100cm, 125cm )
- ( 125cm, 150cm )
- ( 150cm, 175cm )
- ( 175cm, 200cm )
productionHigh: |z| =
- ( 0, 25cm )
- ( 25cm, 50cm )
- ( 50cm, 75cm )
- ( 75cm, 100cm )
- ( 100cm, 125cm )
- ( 125cm, 150cm )
- ( 150cm, 175cm )
- ( 175cm, 200cm )
General Phi dependence
Studying the dependence on global phi angle, looking at hits in sectors at:productionHalfHigh:
- 1 o'clock
- 2 o'clock
- 3 o'clock
- 4 o'clock
- 5 o'clock
- 6 o'clock
- 7 o'clock
- 8 o'clock
- 9 o'clock
- 10 o'clock
- 11 o'clock
- 12 o'clock
We don't learn a lot more from these, but for documentation-sake:
Here are the same plots limited to |z|=25-50cm:
- 1 o'clock
- 2 o'clock
- 3 o'clock
- 4 o'clock
- 5 o'clock
- 6 o'clock
- 7 o'clock
- 8 o'clock
- 9 o'clock
- 10 o'clock
- 11 o'clock
- 12 o'clock
Here are the same plots limited to 0-1 EIGHTH (described earlier, all z):
- 1 o'clock
- 2 o'clock
- 3 o'clock
- 4 o'clock
- 5 o'clock
- 6 o'clock
- 7 o'clock
- 8 o'clock
- 9 o'clock
- 10 o'clock
- 11 o'clock
- 12 o'clock
productionHigh (all hits for each sector):
- 1 o'clock
- 2 o'clock
- 3 o'clock
- 4 o'clock
- 5 o'clock
- 6 o'clock
- 7 o'clock
- 8 o'clock
- 9 o'clock
- 10 o'clock
- 11 o'clock
- 12 o'clock
Phi dependence of Phi dependence within sectors
Studying the dependence on phi angle WITHIN sectors at different phi.productionHalfHigh, 1 o'clock: sector PHI =
- ( 3 EIGHTHS, 4 EIGHTHS)
- ( 2 EIGHTH , 3 EIGHTHS)
- ( 1 EIGHTH , 2 EIGHTHS)
- ( 0 , 1 EIGHTH )
- ( -1 EIGHTH , 0 )
- ( -2 EIGHTHS, -1 EIGHTH )
- ( -3 EIGHTHS, -2 EIGHTHS)
- ( -4 EIGHTHS, -3 EIGHTHS)
productionHalfHigh, 4 o'clock: sector PHI =
- ( 3 EIGHTHS, 4 EIGHTHS)
- ( 2 EIGHTH , 3 EIGHTHS)
- ( 1 EIGHTH , 2 EIGHTHS)
- ( 0 , 1 EIGHTH )
- ( -1 EIGHTH , 0 )
- ( -2 EIGHTHS, -1 EIGHTH )
- ( -3 EIGHTHS, -2 EIGHTHS)
- ( -4 EIGHTHS, -3 EIGHTHS)
productionHalfHigh, 7 o'clock: sector PHI =
- ( 3 EIGHTHS, 4 EIGHTHS)
- ( 2 EIGHTH , 3 EIGHTHS)
- ( 1 EIGHTH , 2 EIGHTHS)
- ( 0 , 1 EIGHTH )
- ( -1 EIGHTH , 0 )
- ( -2 EIGHTHS, -1 EIGHTH )
- ( -3 EIGHTHS, -2 EIGHTHS)
- ( -4 EIGHTHS, -3 EIGHTHS)
productionHalfHigh, 10 o'clock: sector PHI =
- ( 3 EIGHTHS, 4 EIGHTHS)
- ( 2 EIGHTH , 3 EIGHTHS)
- ( 1 EIGHTH , 2 EIGHTHS)
- ( 0 , 1 EIGHTH )
- ( -1 EIGHTH , 0 )
- ( -2 EIGHTHS, -1 EIGHTH )
- ( -3 EIGHTHS, -2 EIGHTHS)
- ( -4 EIGHTHS, -3 EIGHTHS)
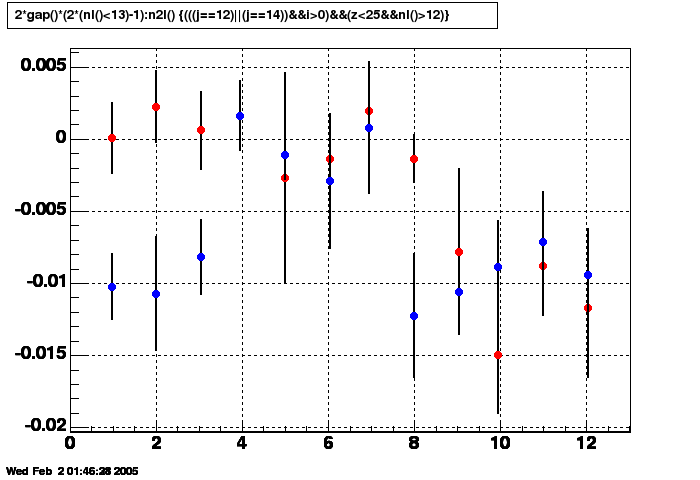
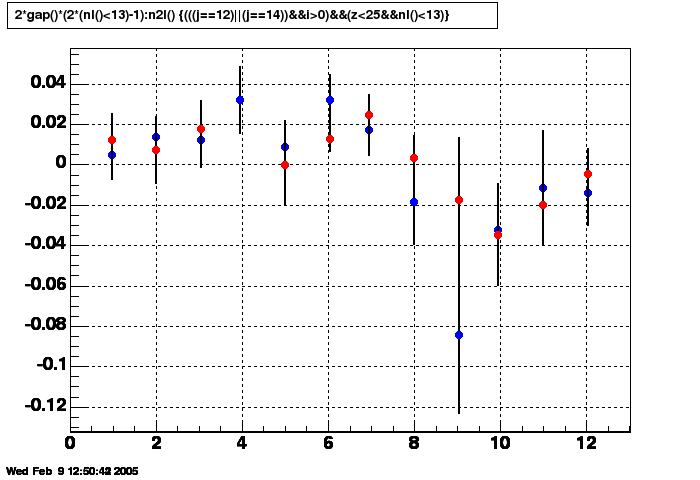
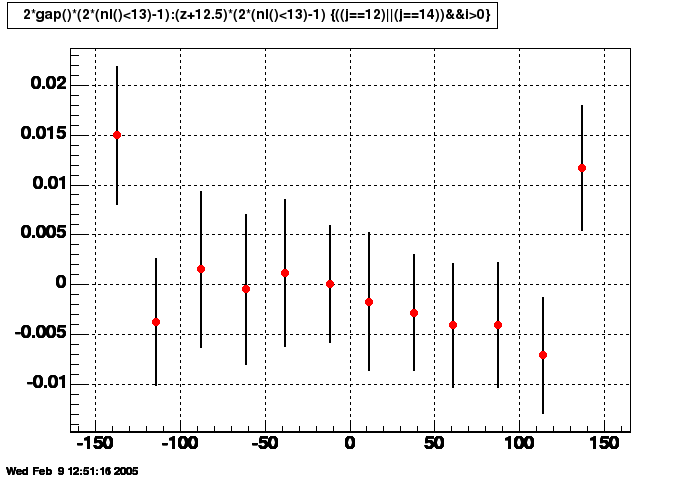
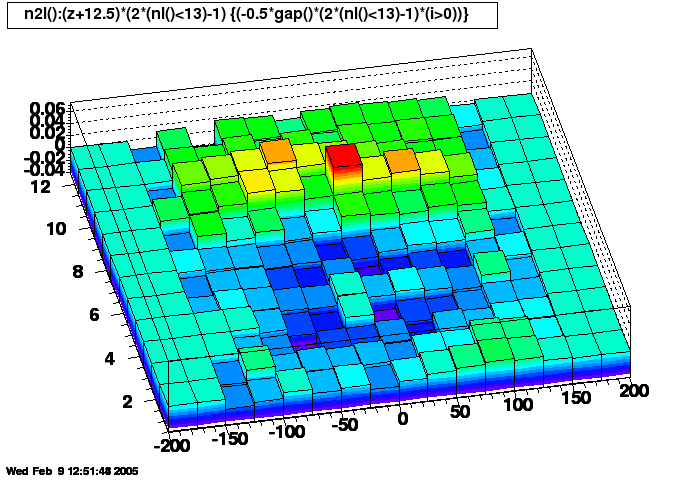
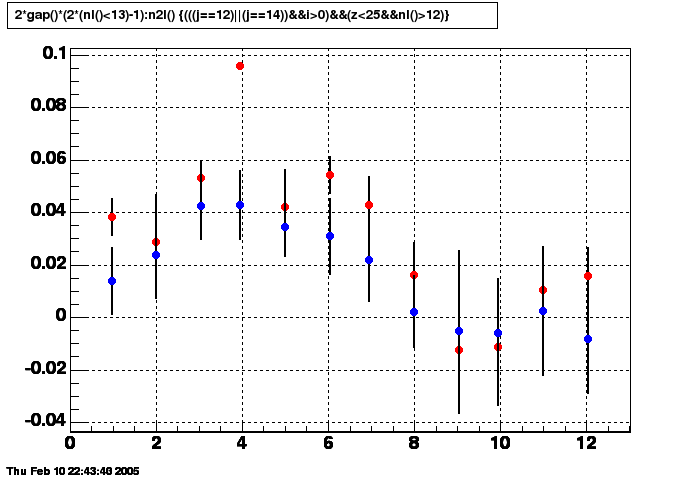
Dependencies of the GridLeak Gap
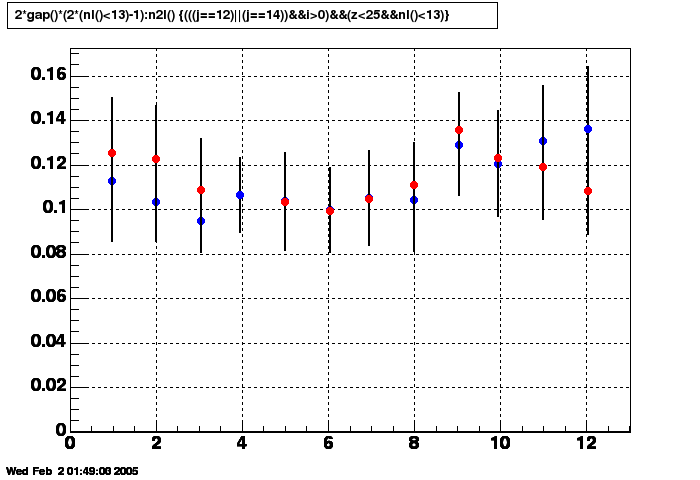
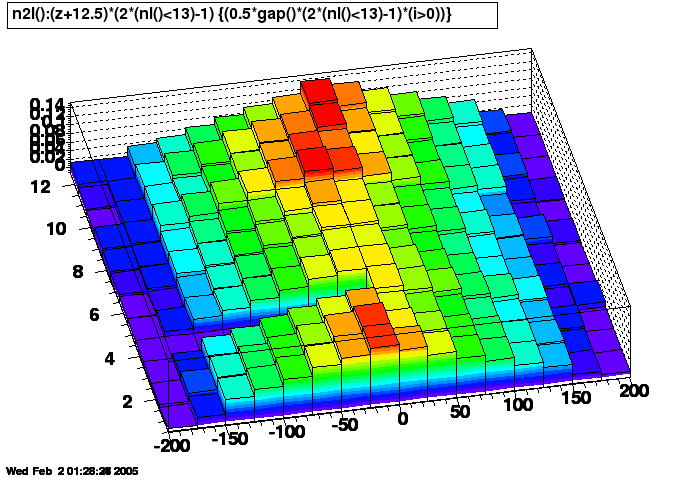
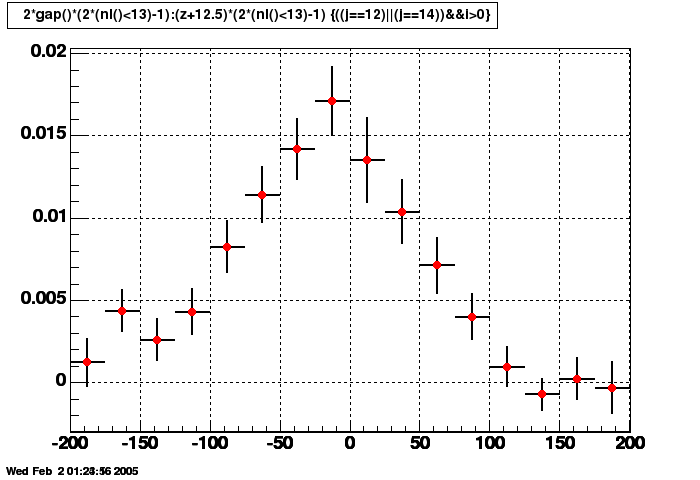
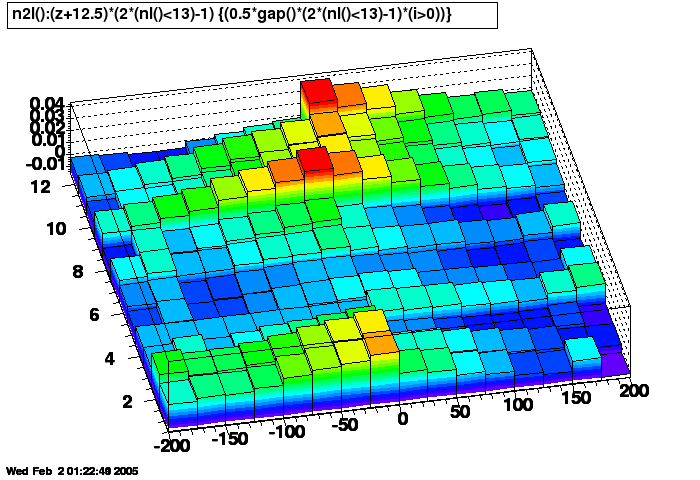
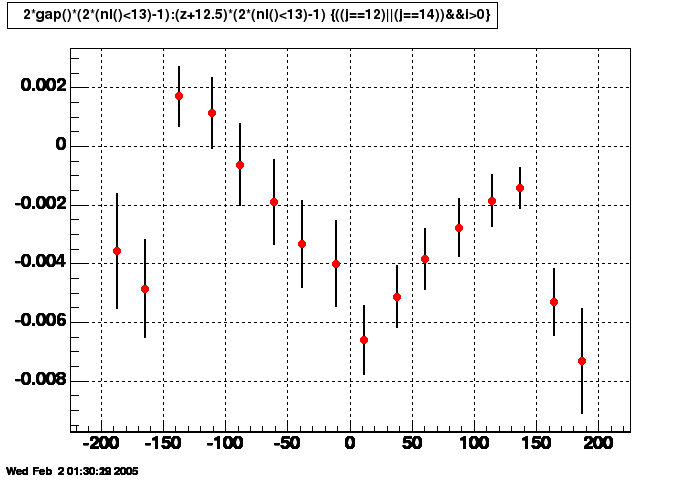
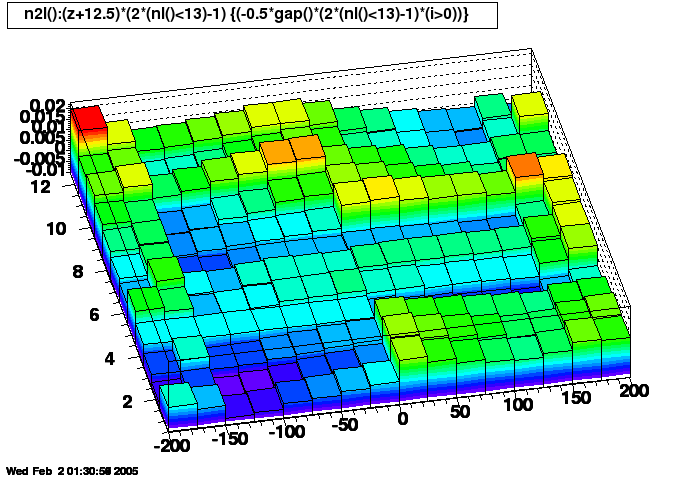
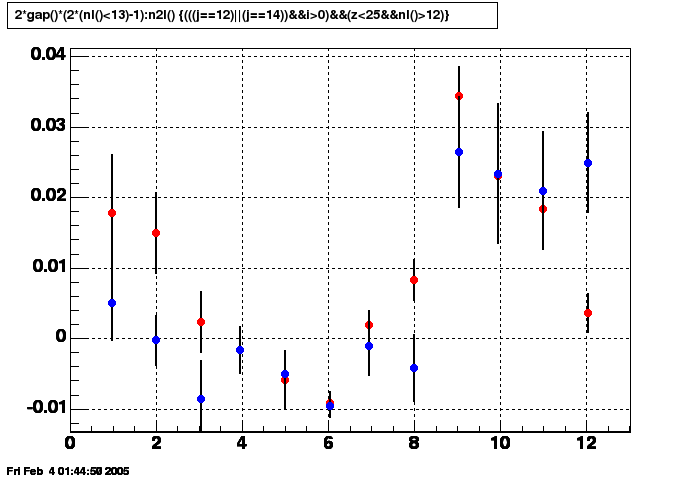
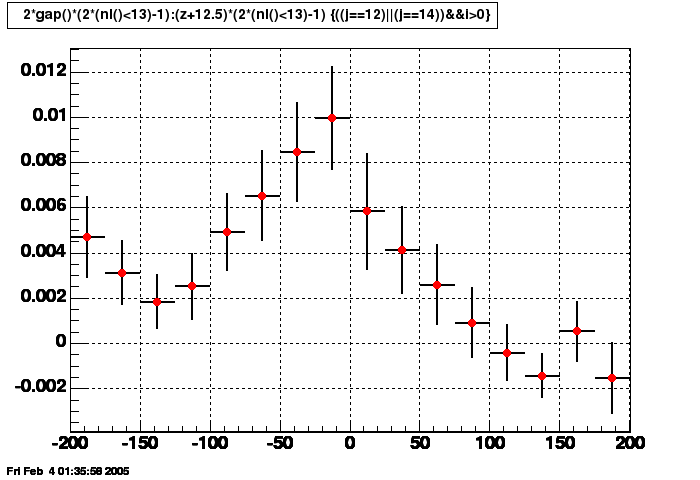
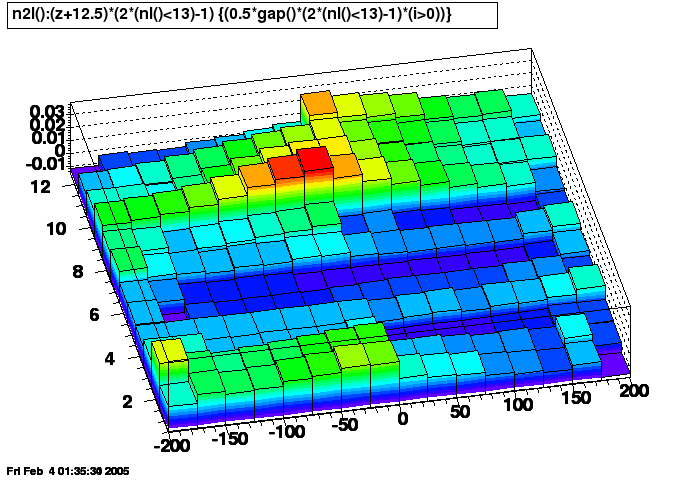
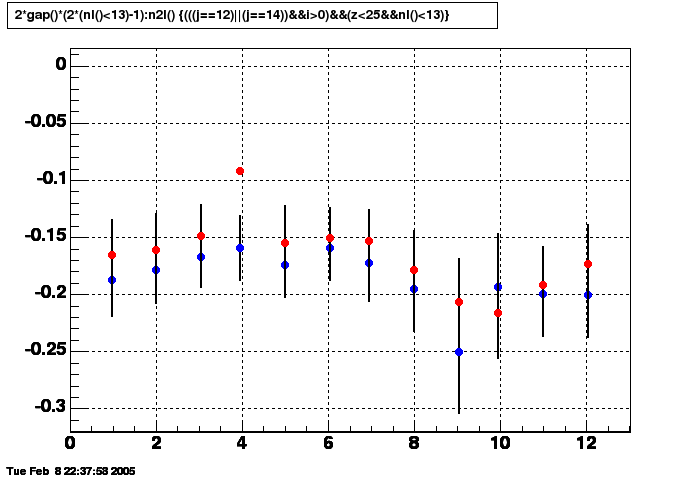
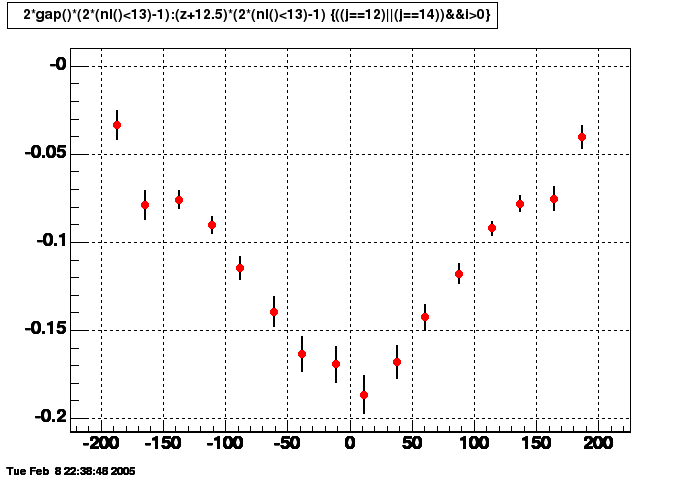
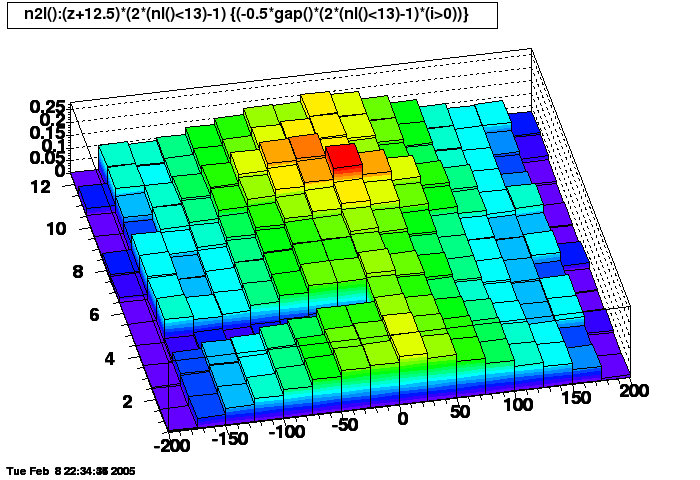
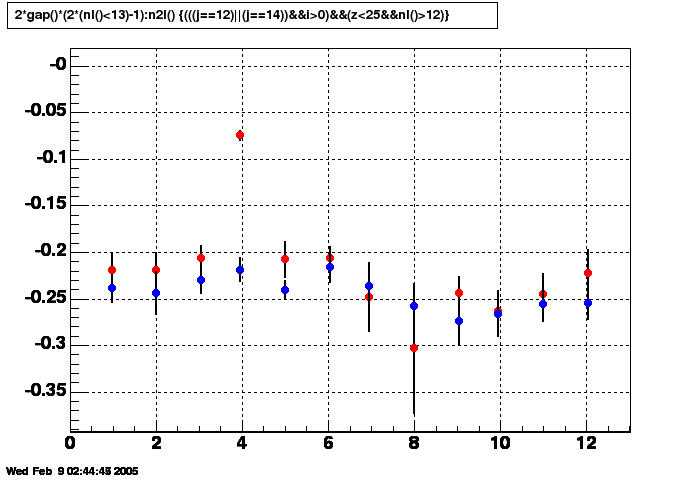
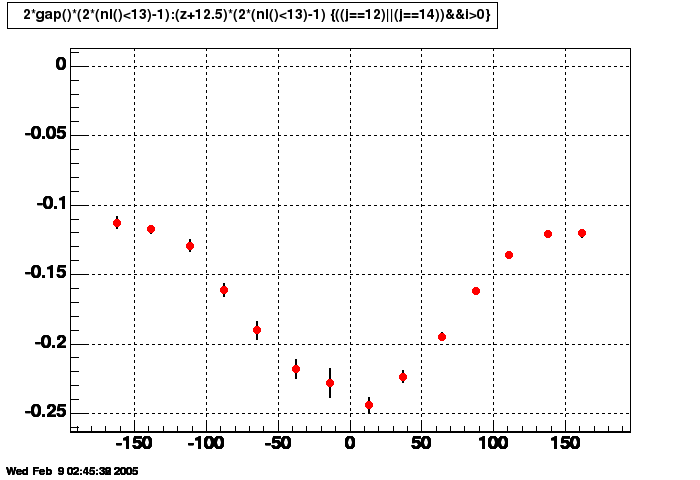
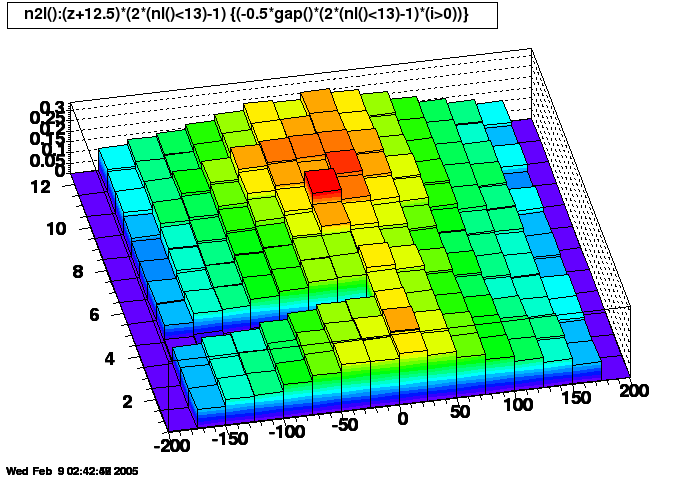
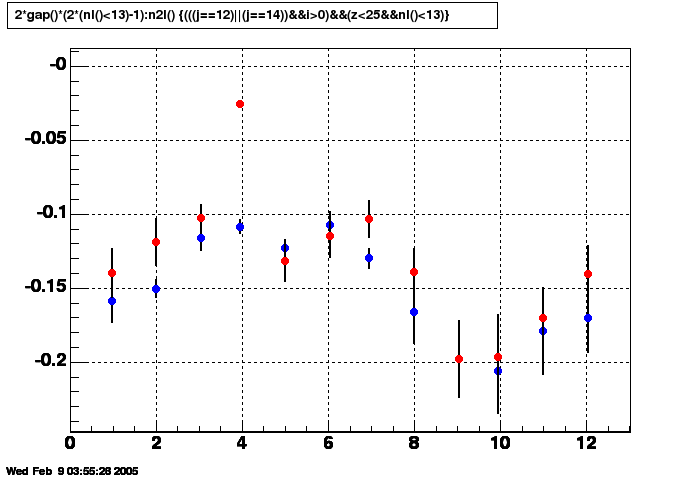
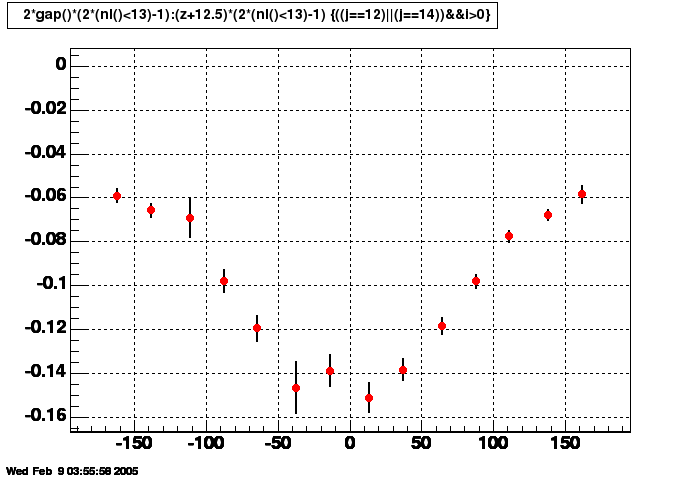
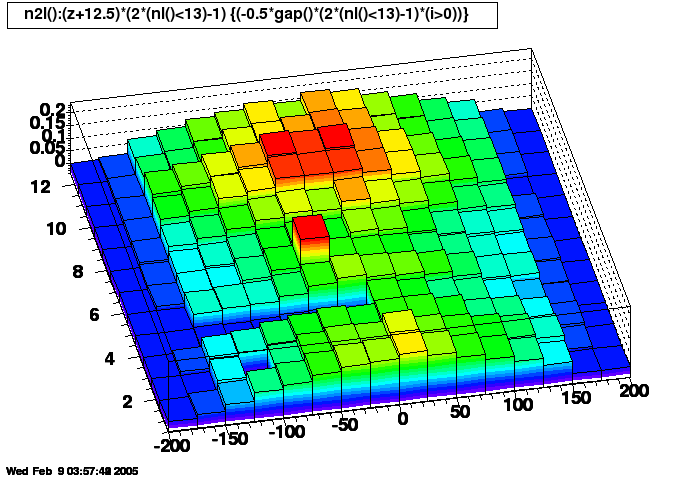
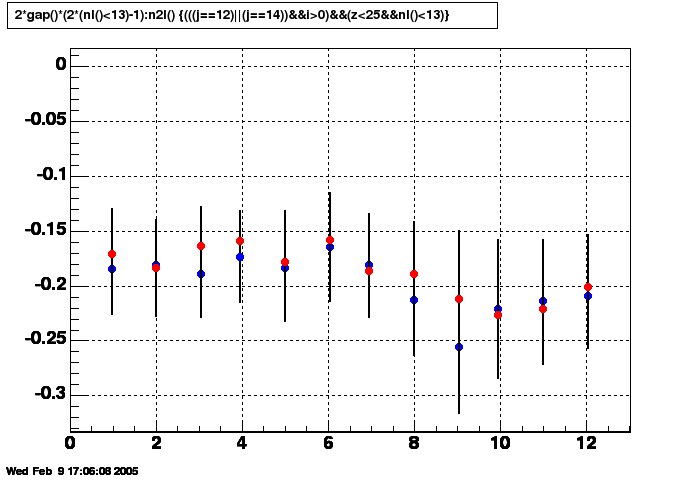
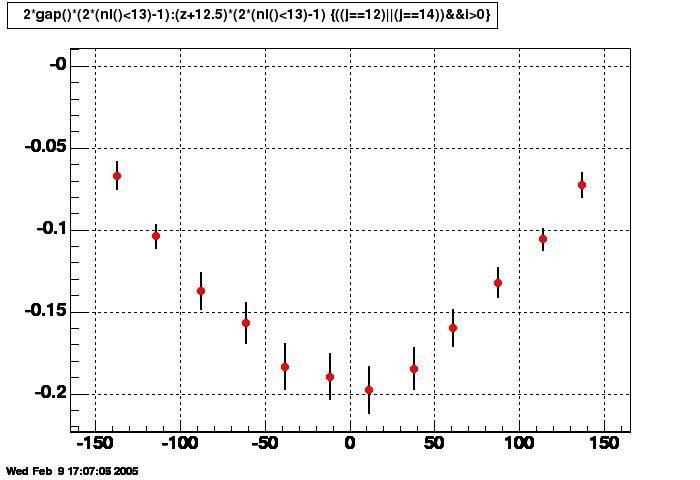
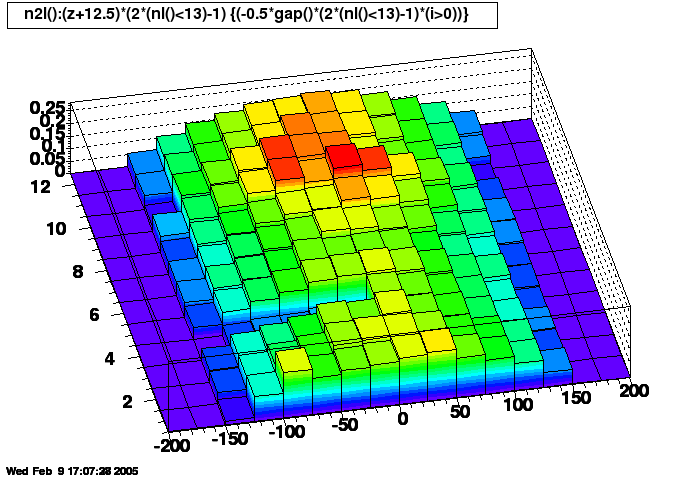
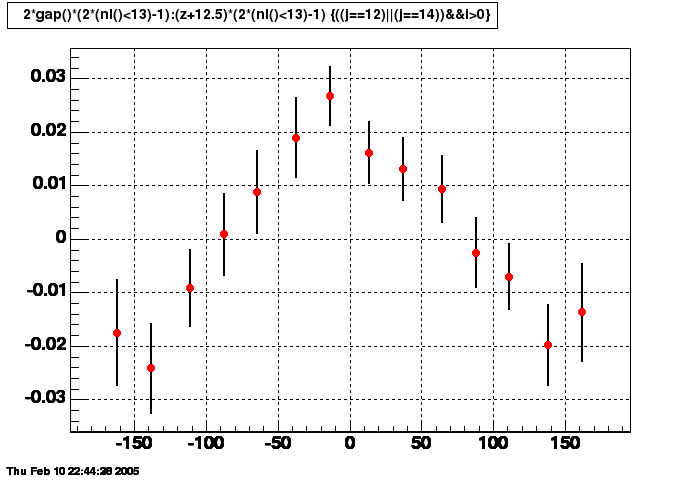
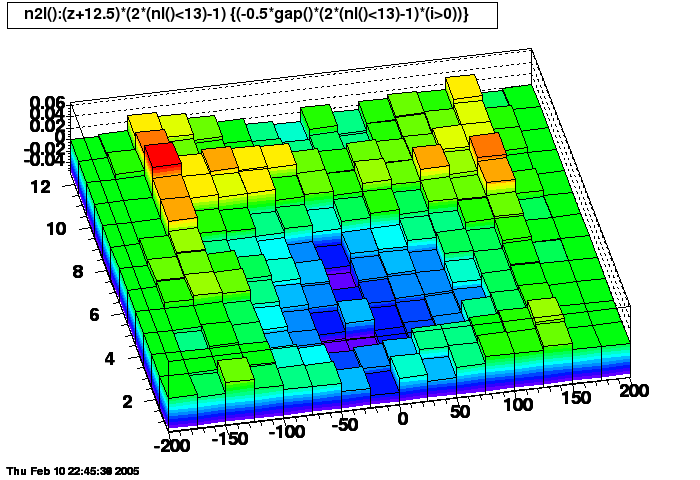
Studying the dependences of the GridLeak Gap, which I will define as the difference in position of the residual from padrow 12 to padrow 14, with sectors 13-24 sign-flipped to be comparable to sectore 1-12 (the code I was using for earlier plots flips this sign, and I'm un-flipping it here):[Left plots are azimuthal dependence for |z|<25, where horizontal axis is "o'clock" as viewed from the west side looking east. So 9 o'clock is north, towards the inside of the RHIC ring. Blue is for sectors 1-12 (west), and red is for sectors 13-24 (east). Middle plots are z-dependence for all sectors. Right plots are azimuthal and z-dependence in one plot (its middle 2 z bins are the data in the left plot).]
productionHalfHigh: (BEFORE CORRECTION)
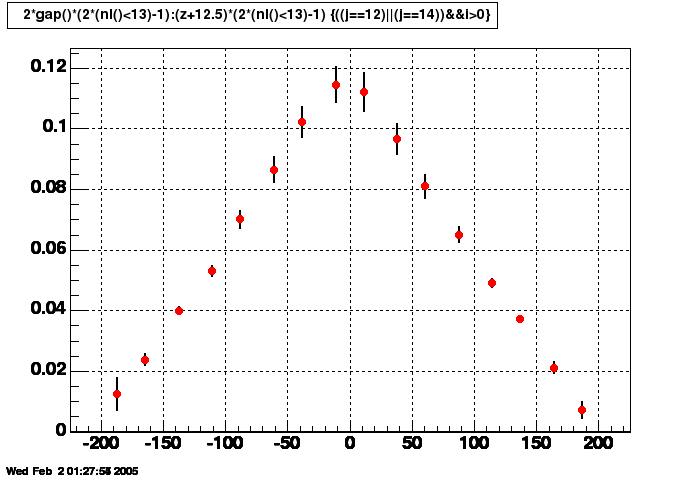
Beautifully linear z-dependence!
productionHalfHigh: (AFTER CORRECTION)
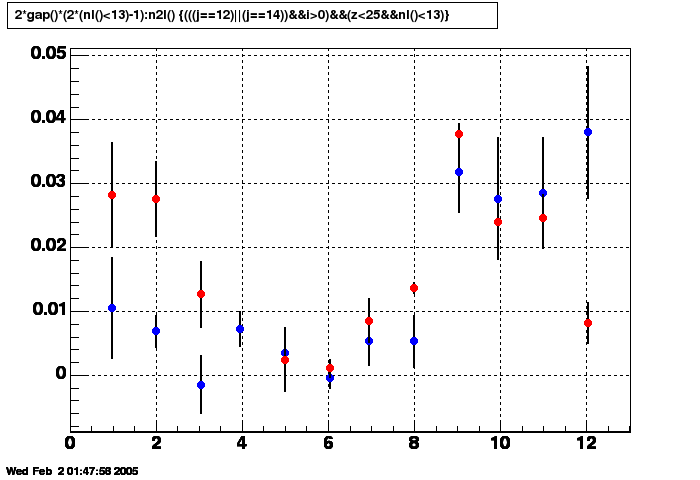
Remaining gap seems to be prominent in the 9-12 o'clock region.
productionHigh: (AFTER CORRECTION)
Reversed field flips the sign of the Gap. In the 3D plot, I have flipped the sign of the Gap so that any similarities to the forward field plots can be more easily seen. There is perhaps a similar effect of notable remaining Gaps at 9-12 o'clock and no Gaps at 4-7 o'clock, but the 1-3 o'clock region is markedly different. Also, there are notable issues at large z values on both sides of the TPC (the worst at sector 24, east side, negative z, 12 o'clock).
productionHigh: Day 46 (AFTER CORRECTION)
Forward field, so no sign flip. Looks like some really odd problem at large negative Z, but the 3D plot shows that most of this problem is isolated to one sector at 2 o'clock (sector 22). Otherwise similar to the productionHalfHigh taken on day 58.
Effects of increased GG opening rate
Studying the effects of a high rate of opening the gated grid (GG) in this year's CuCu data. It is Reversed Full Field data, and I have flipped sign in the 3D plot again to make it easier to see/compare.Run 6035071: test (high gated grid rate, ZDCx = approx. 20k)
A little worse than last year's AuAu, but not an order of magnitude (compare 2mm gap at the central membrane with the un-GridLeak-corrected productionHalfHigh AuAu value of about 1.2mm). ZDCx rates are significantly higher for CuCu, though event sizes are smaller.
Run 6035027: control (normal rate, almost same ZDCx, taken several hours earlier during previous fill)
Not much different from the test file!!! So the gap appears to be GG rate independent.
Run 6035042: slightly lower ZDCx, taken between above two runs
Just making sure we still see a luminosity dependence, which we do.
Correcting the Test data:
Now applying SpaceCharge to run 6035071:
I expected there to be no effect on the observed GridLeak gap from applying SpaceCharge, but I was wrong. This may be due to how I measure the gap (difference of two residuals at padrows 12 and 14 instead of closer to the sector boundaries). [NOTE: SpaceCharge was determined by a prepass on the first few events of the file, but event-by-event SpaceCharge was not operational for as yet unknown reasons.]
Now applying SpaceCharge + GridLeak to run 6035071:
We can remove the gap using the same GridLeakStrength (15.0) that we found for the AuAu data...on average. The azimuthal dependence we have always seen is still there and is actually worse than ever. Runs 6035027 (my control) and 6035071 (the high GG rate test) share similar phi dependence for the gap, so the phi dependence appears to be GG rate independent.
Small note: ioratio = 0.75 worked best.
Correcting the Control data:
Now applying SpaceCharge to run 6035027:
Unfinished section...Not getting SpaceCharge prepass to work: no SpaceCharge means no GridLeak correction...
Now applying SpaceCharge + GridLeak to run 6035027:
I again applied the GridLeakStrength of 15.0, and this time EventByEvent SpaceCharge worked for some reason. It looks like we actually on average overcorrect (the V-shape in the Z dependence plot points upwards, though it points downwards before corrections). The strong azimuthal dependence remains.
- Printer-friendly version
- Login or register to post comments