Padrow 13 and Padrow 40 static distortions
Updated on Wed, 2021-03-03 14:19. Originally created by genevb on 2021-02-26 23:27.
Under:
These two distortion corrections focus on static non-uniformities in the electric field in the gating grid region of the TPC, radially between the inner and outer sectors. This region has an absence of gating grid wires where the subsector structures meet, allowing some bending of the equipotential lines, creating radial electric field components. In both cases, the region of distorted fields is quite localized near the endcap and only over a small radial extent, but this then distorts all drifting electrons (essentially from all drift distances equally) in that small radial region, affecting signal only for a few padrows on each side of the inner/outer boundary.
Padrow 13 Distortion
For the original TPC structure, the was simply nothing in the gap between the inner and outer sectors. More about the gap structure can be learned by looking some of the GridLeak documentation (which is different in that it is dynamic with the ionization in the TPC. This static distortion was observed in the early operation of STAR when luminosities were low, well before the GridLeak distortion was ever observed. It was modeled as an offset potential on a small strip of the TPC drift field boundary, with the offset equal to a scale factor times the gating grid voltage, where the scale factor was calibrated from fits to the data. Below are the related distortion correction maps.
Padrow 40 Distortion
With the iTPC sectors, a wall was placed at the outer edge of the new inner sectors with conductive stripes on it to express potentials primarily to suppress the GridLeak distortion. It was understood that this would modify the static distortion, and in the maps below it is apparent that the static distortions became a few times larger with the wall, but in both cases only at the level of ~100 μm or less at the outermost padrow of the inner sectors. It is also worth noting that the sign of the distortion flipped with respect to Padrow 13.
This distortion correction is determined from the sum of 3 maps that represent the distortion contributions from (1) the wall's grounded structure, (2) the potential at the wall's tip [nominally -115 V], and (3) the potential on the wall's outer side [nominally -450 V]. Plots on this page were made using the nominal potentials.
Distortion correction maps:
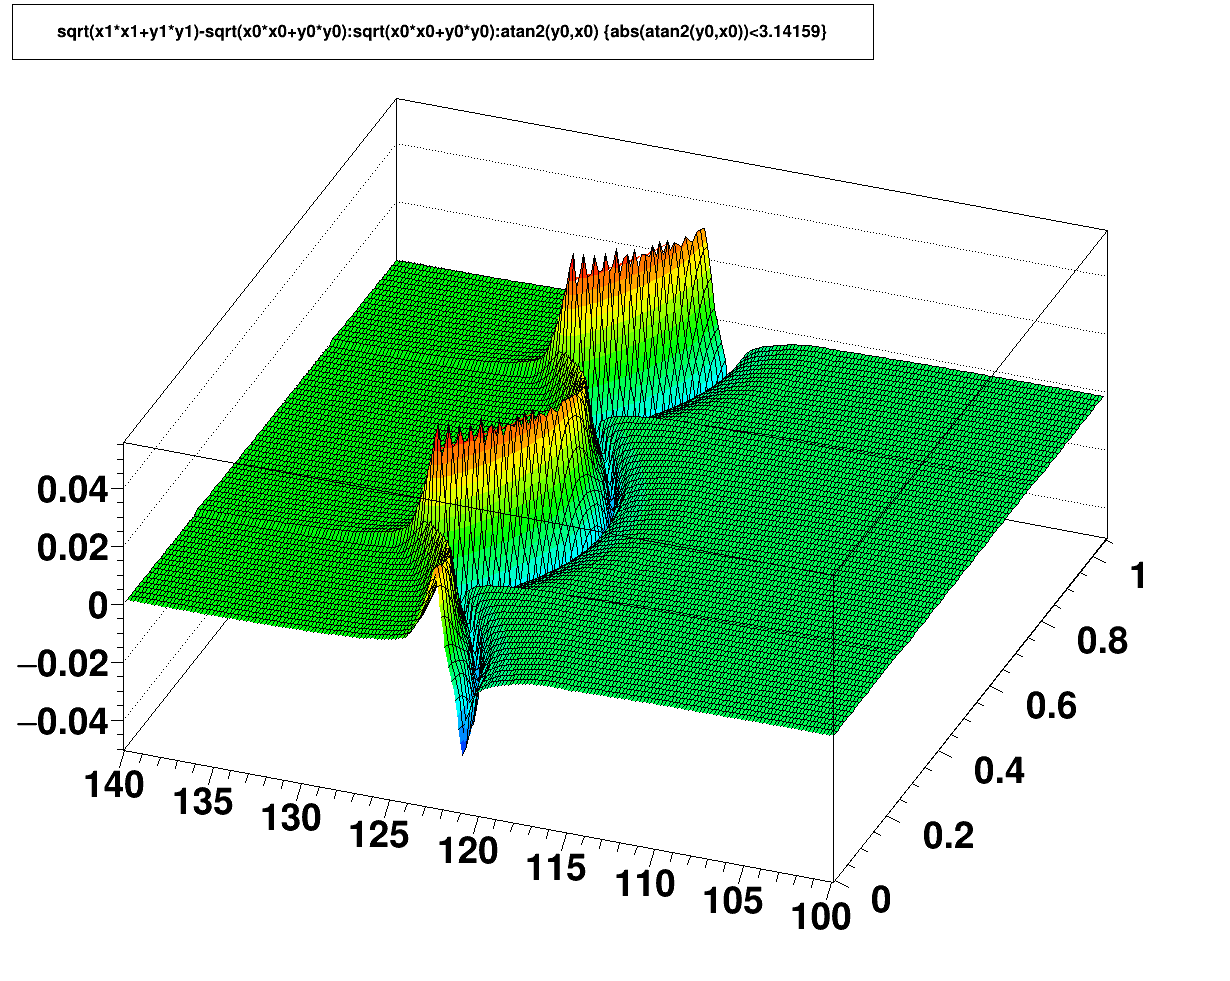
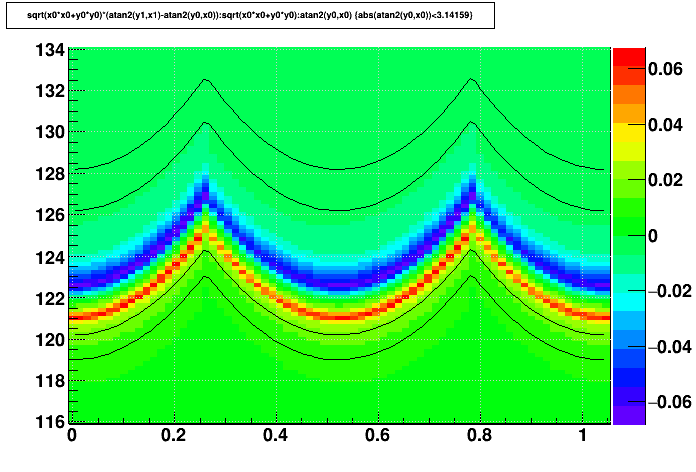
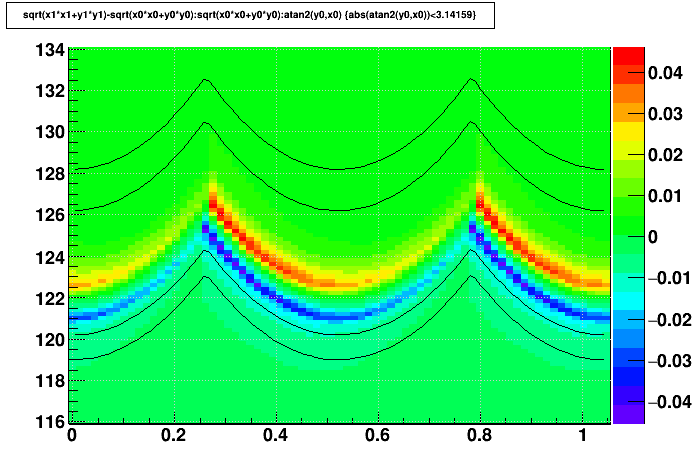
The maps are essentially uniform in z, so the maps shown below focus only on the radial and azimuthal dependencies. Further, there is no distortion more than a few centimeters away from the inner/outer boundaries, and there is essentially a 12-fold symmetry azimuthally (though this is not strictly true if different wall voltages are used on different iTPC sectors), so the maps zoom in on a limited region of r and φ to offer a better view of the fine details. Also, the inner and outer edges of the nearest padrows are shown as thin black lines on some plots to help understand their proximity to the distortions.
Open each map in a new web browser tab or window to see higher resolution. Units are [cm] and [radian].
-Gene
Padrow 13 Distortion
For the original TPC structure, the was simply nothing in the gap between the inner and outer sectors. More about the gap structure can be learned by looking some of the GridLeak documentation (which is different in that it is dynamic with the ionization in the TPC. This static distortion was observed in the early operation of STAR when luminosities were low, well before the GridLeak distortion was ever observed. It was modeled as an offset potential on a small strip of the TPC drift field boundary, with the offset equal to a scale factor times the gating grid voltage, where the scale factor was calibrated from fits to the data. Below are the related distortion correction maps.
Padrow 40 Distortion
With the iTPC sectors, a wall was placed at the outer edge of the new inner sectors with conductive stripes on it to express potentials primarily to suppress the GridLeak distortion. It was understood that this would modify the static distortion, and in the maps below it is apparent that the static distortions became a few times larger with the wall, but in both cases only at the level of ~100 μm or less at the outermost padrow of the inner sectors. It is also worth noting that the sign of the distortion flipped with respect to Padrow 13.
This distortion correction is determined from the sum of 3 maps that represent the distortion contributions from (1) the wall's grounded structure, (2) the potential at the wall's tip [nominally -115 V], and (3) the potential on the wall's outer side [nominally -450 V]. Plots on this page were made using the nominal potentials.
Distortion correction maps:
The maps are essentially uniform in z, so the maps shown below focus only on the radial and azimuthal dependencies. Further, there is no distortion more than a few centimeters away from the inner/outer boundaries, and there is essentially a 12-fold symmetry azimuthally (though this is not strictly true if different wall voltages are used on different iTPC sectors), so the maps zoom in on a limited region of r and φ to offer a better view of the fine details. Also, the inner and outer edges of the nearest padrows are shown as thin black lines on some plots to help understand their proximity to the distortions.
Open each map in a new web browser tab or window to see higher resolution. Units are [cm] and [radian].
| Δ(r-φ) vs. r and φ | Δ(r) vs. r and φ | |
|---|---|---|
| Padrow 13 | 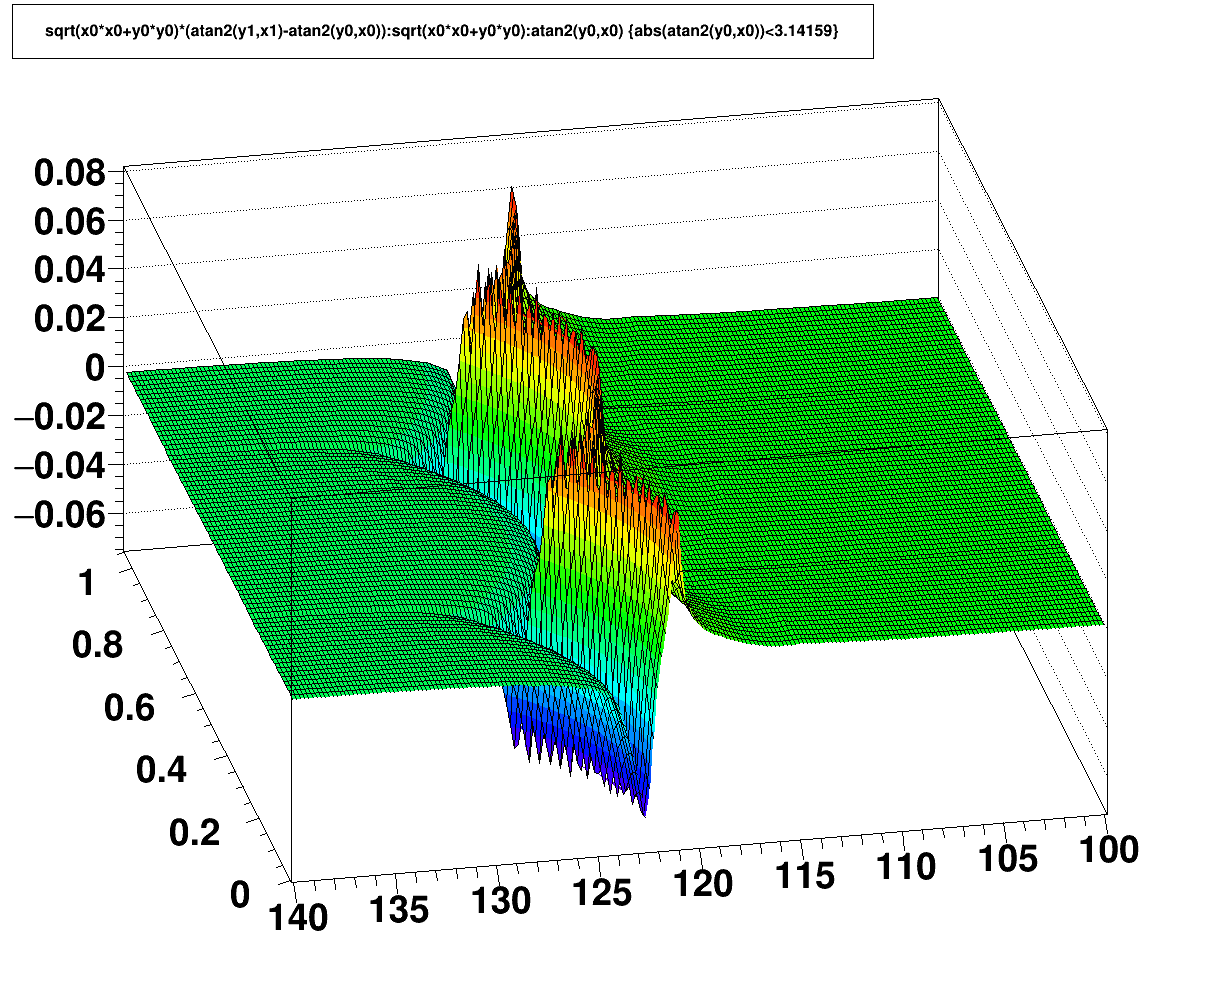 |
 |
| Padrow 13 lines indicating locations of rows 13 and 14 |
 |
 |
| Padrow 40 |  |
 |
| Padrow 40 lines indicating locations of rows 40 and 41 |
 |
 |
-Gene
»
- Printer-friendly version
- Login or register to post comments