- General information
- Data readiness
- Calibration
- Databases
- Frequently Asked Questions
- How-To: user section
- How-To: admin section
- How-To: subsystem coordinator
- Online Databases
- Offline Databases
- FileCatalog Databases
- Software Infrastructure Databases
- Maintenance
- DB & Docker
- Development
- Test
- Quality Assurance
- Grid and Cloud
- Infrastructure
- Machine Learning
- Offline Software
- Production
- S&C internal group meetings
- Test tree
Plots - Star Default
Updated on Fri, 2008-06-06 15:39. Originally created by deph on 2008-06-06 14:58.
Under:
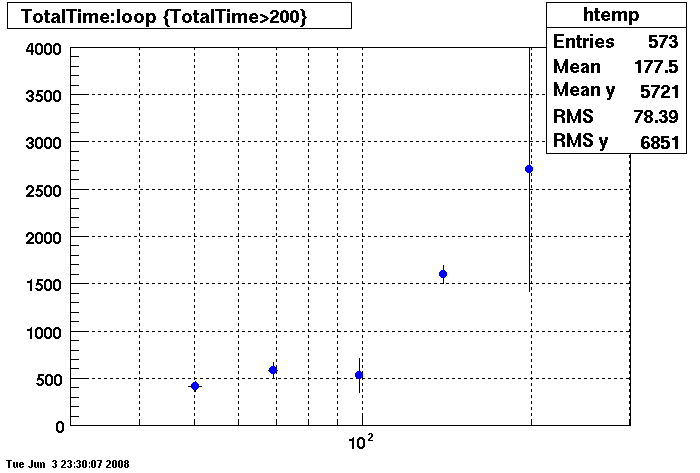
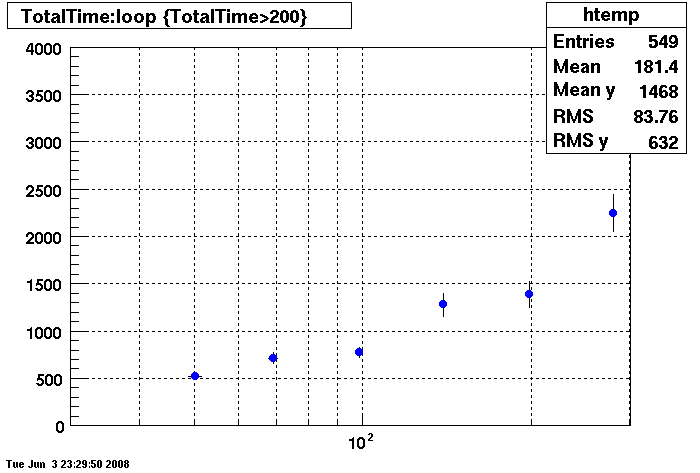
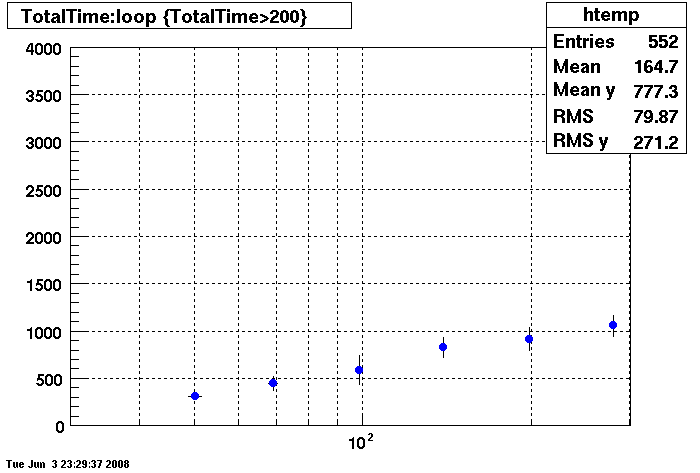
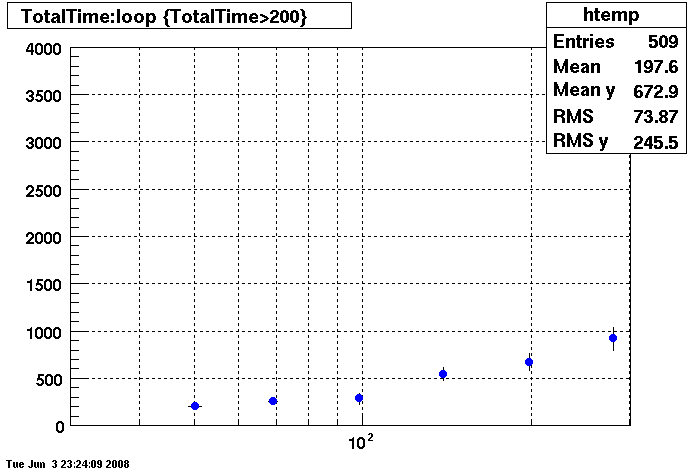
This plot shows x=number of connections , y=time it takes for the StDbLib to retrun a complete data set for all the Star Offline databases. This set of plot uses the STAR defualt parameters as described one page up. This is to be used as a baseline for comparisions.
Bogart

DB02

DB03

DB08

»
- Printer-friendly version
- Login or register to post comments
