Test with real data
The PPV with BTOF included is then tested with Run 9 real data. The detail of the coding explanation can be found here.
The PPV is tested for two cases: w/ BTOF and w/o BTOF and then I make comparisions later. The data files used in this test are (1862 events in total):
st_physics_10085140_raw_2020001.daq
st_physics_10096026_raw_1020001.daq
(Note that in 500 GeV runs, many of the triggered events are HT or JP, presumably with higher multiplicity compared with MB triggers.) And the chain options used in the production are:
pp2009a ITTF BEmcChkStat QAalltrigs btofDat Corr3 OSpaceZ2 OGridLeak3D beamLine -VFMinuit VFPPVnoCTB -dstout -evout
Production was done using the DEV lib on 11/05/2009. Here shows the results:
Fig. 1: The 2-D correlation plot of # of good vertices in each event for PPV w/ TOF and w/o TOF.
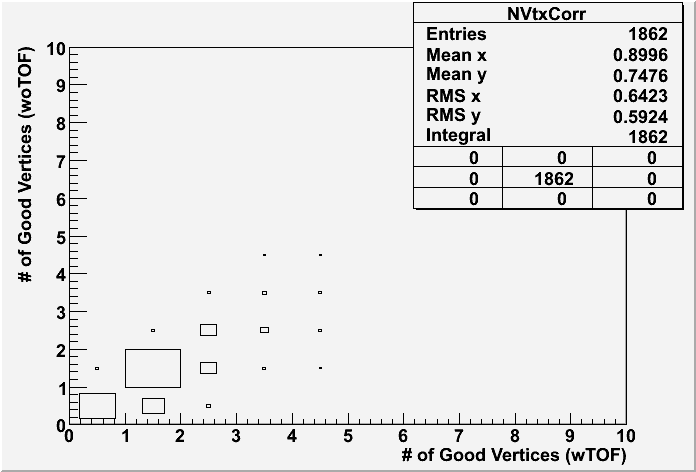
Fig. 2: The ranking distributions for all vertices from PPV w/ and w/o TOF
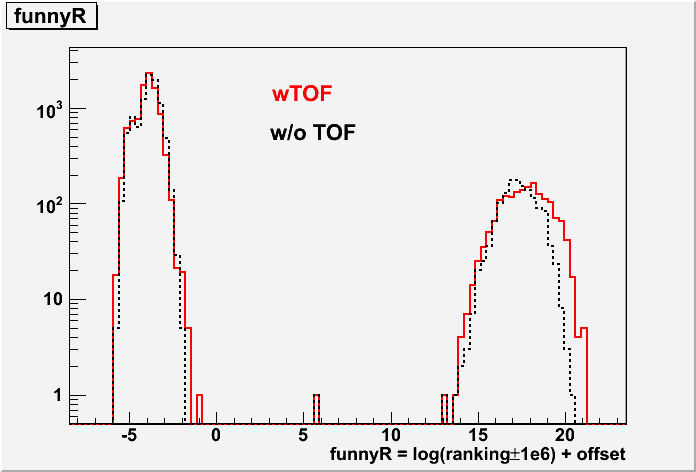
Fig. 3: Vz correlation for the good vertex (ranking>0) with the highest ranking in each event for PPV w/ and w/o TOF. Note that, if the event doesn't have any good vertex, the Vz is set to be -999 in my calculation, which appears in the underflow in the histogram statstics.
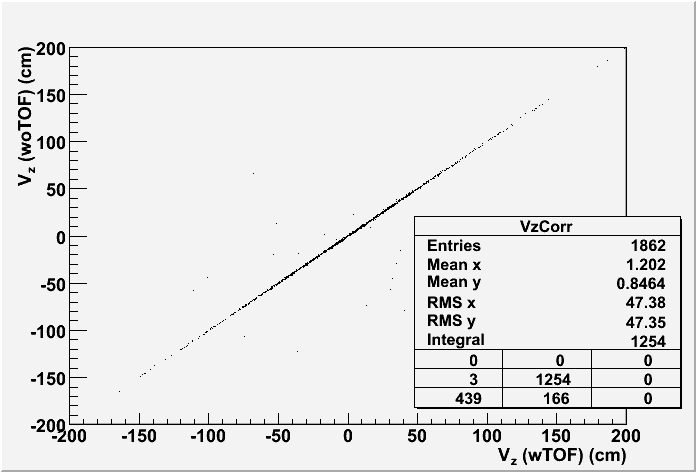
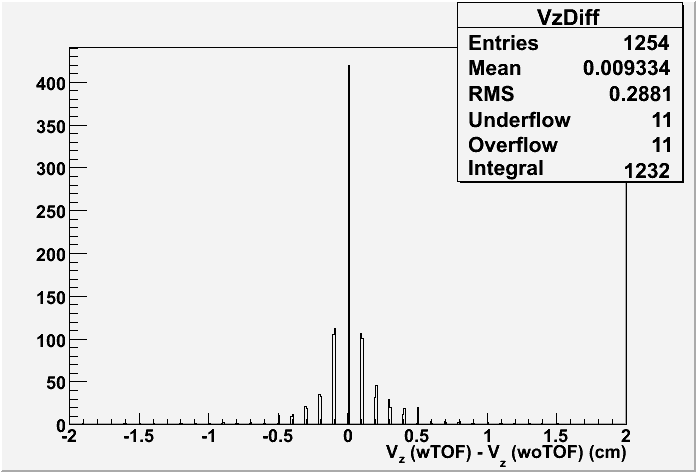
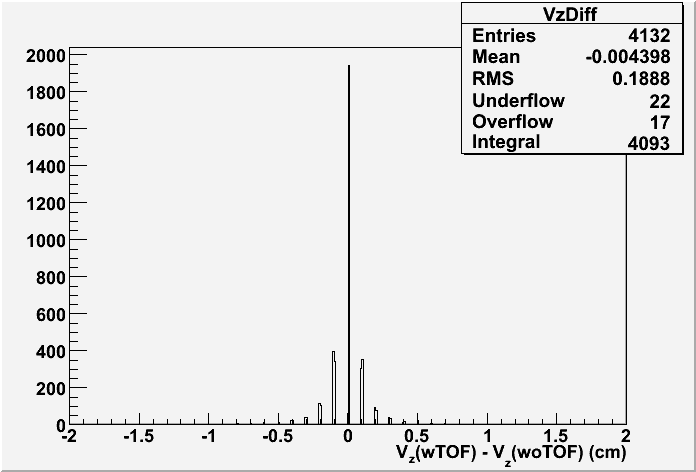
Fig. 4: Vz difference between vertices found in PPV w/ TOF and w/o TOF for the first good vertex in each event if any. The 0.1 cm step seems to come from the PPV.
Update on 4/5/2010:
I have also run some test with the 200 GeV real data. The test has been carried out on the following daq file
st_physics_10124075_raw_1030001.MuDst.root
All the rest setup are the same as described above. Here are the test results:
Fig. 5: The 2-D correlation plot of # of good vertices in each event for PPV w/ TOF and w/o TOF (200 GeV)
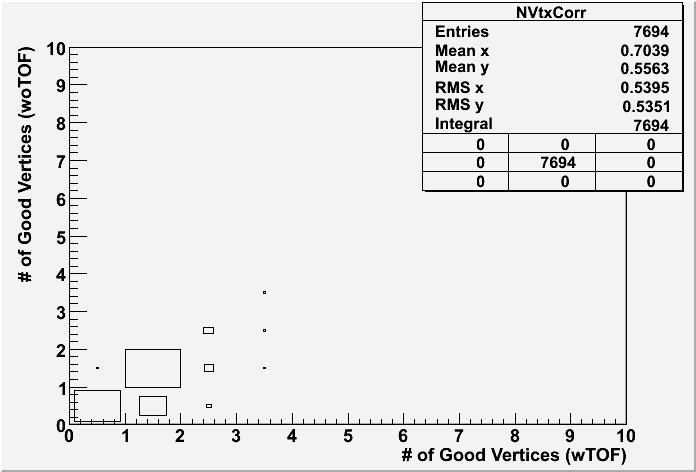
Fig. 6: The ranking distributions for all vertices from PPV w/ and w/o TOF (left) and also the correlation between the funnyR values for the first primary vertex in two cases. (200 GeV)
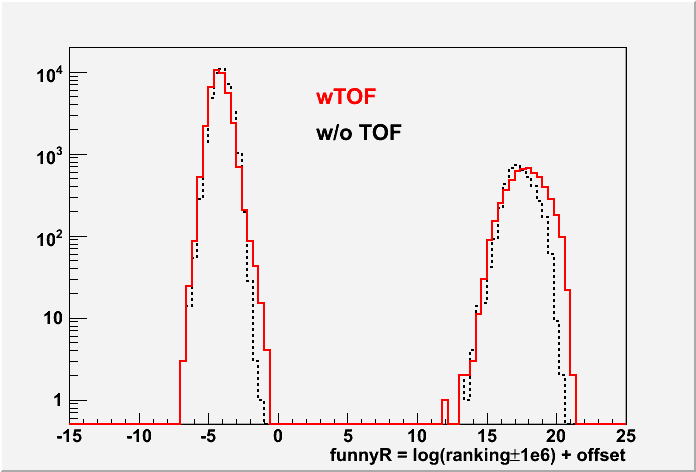
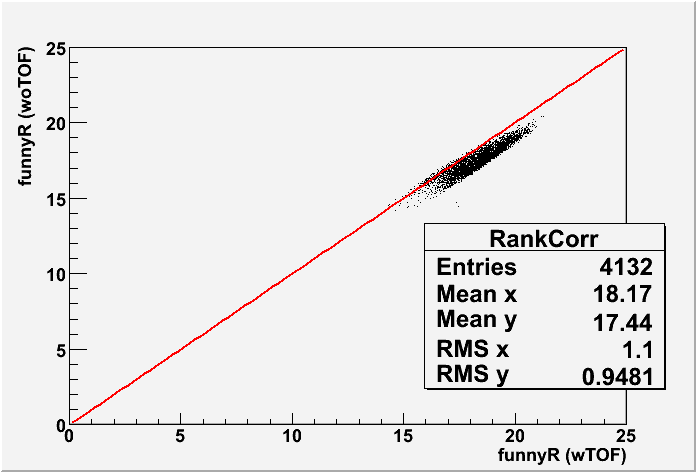
Fig. 7: Vz correlation for the good vertex (ranking>0) with the highest ranking in each event for PPV w/ and w/o TOF (200 GeV).
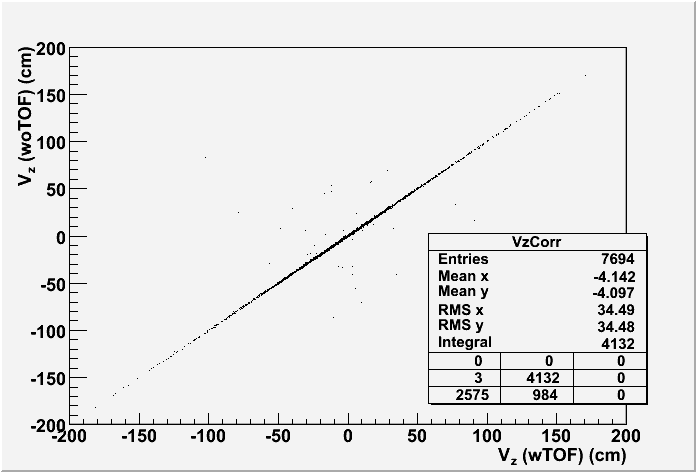
Fig. 8: Vz difference between vertices found in PPV w/ TOF and w/o TOF for the first good vertex in each event if any (200 GeV)
Conclusion:
The above tests with real data have shown the expected PPV performance with inclusion of BTOF hits.
- Printer-friendly version
- Login or register to post comments
