Comparison with Cross Sections
Abstract: We cross check prompt-photon yields against "known" cross sections, based on pythia expectations. The extracted yields are found to be within a factor of two of what pythia predicts.
We cross check the results of the conversion method (both with the tight hadronic veto cuts, and the looser SMD energy ratio cuts (see section 3 in the link)) against the expected cross sections from perturbative QCD. The goal here is to determine if we are even close to being in the right ball park.
Figure 1 -- pT spectrum for photons extracted using the EEmc Gammas via conversion method. At left we use the cuts described in the link. At right, we remove the postshower (hadronic veto) cut and replace it with a cut on E(smd)/E(candidate).
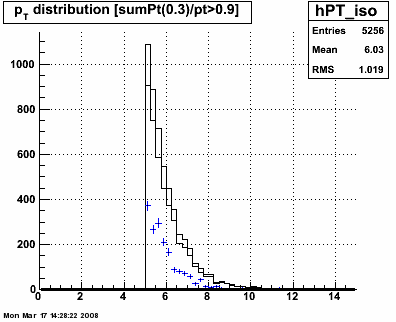
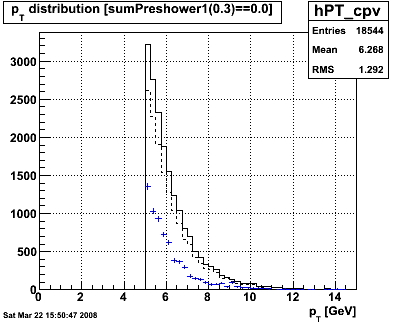
Result: trigger ID 137641 / aka EEMC L2gamma accumulated 4.3 pb-1. FOM is 0.27 pb-1 based on online polarizations.
Result: 6800 events in EEmc above pT = 5 GeV for Ntried = 232468 σ = 1.557 times 105 mb. Luminosity = 1.49 pb-1.
Figure 2 -- pT spectrum for 4.3pb-1 of data, pythia 8.100.
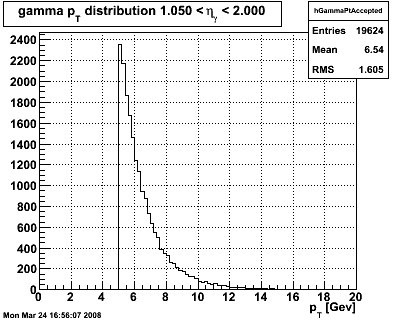
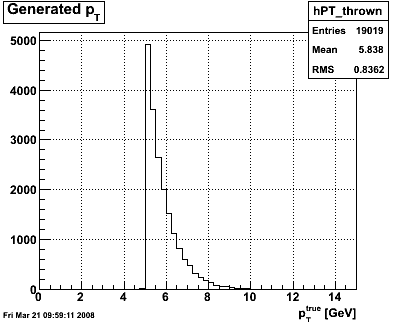
Figure 3 -- Generated pT distribution (left), acceptance, i.e. fraction of photons which hit the endcap (right).
d. Run the gamma extraction code using both sets of cuts:
Set I: Tight Cuts with Hadronic Veto
Set II: Loose cuts with SMD ratio cut
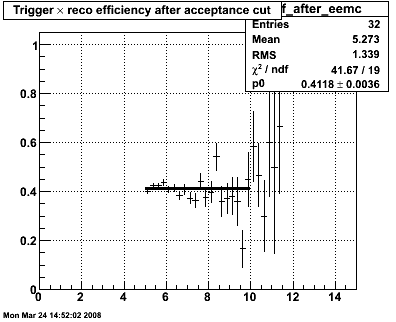
Figure 4 -- Ratio of number of gammas passing the CPV cut to the total number generated. Note-- to get the efficiency, we should divide by the acceptance function from figure 1. Set I (left), set II (right).
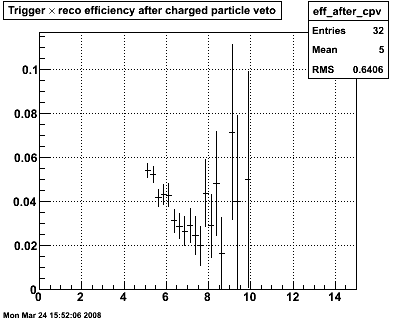
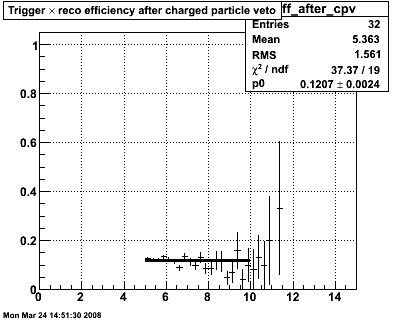
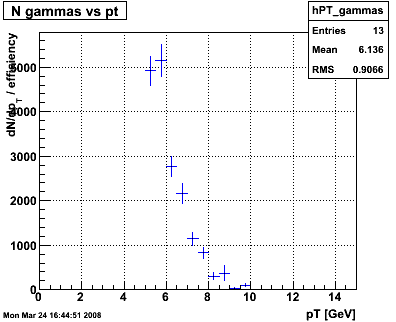
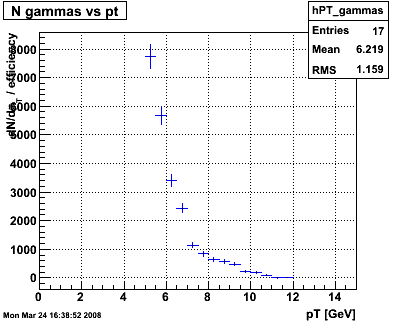
Figure 5 -- Single-gamma pT spectra for set I cuts (left) and set II cuts (right), corrected for inefficiencies. Error bars should not be taken overly seriously at this point. Still, set I integrates to 17.7k events. Set II integrates to 23.6k events.
6. Tabulate yields, corrected for efficiencies, livetime, dead detectors
| SET | raw | eff. corrected | live time corrected [see note] |
| I | 1780 | 17.7k | 28.7k |
| II | 6800 | 23.6k | 38.2k |
| pythia | -- | 19.6k | 19.6k |
Conclusions:
The gamma yields extracted using the conversion method are within a factor of 2 of expectations based on pythia.
Email from Carl--
The standard luminosity estimate already includes the effects of
finite live time (assuming you used the appropriate number for slow
detector events). Therefore, the 1/0.65 factor that you included
represents double counting. However, correcting that won't change
your conclusion that you are at least in the right ballpark.
Carl
I assume that Jamie's perl script already takes this into account... if so, then the comparison is with the efficiency corrected column, and the conclusion is that we are within 10-20% of the yields expected from pythia.
- jwebb's blog
- Login or register to post comments
