Run 13 BEMC Calibration : PID_Cuts (nSigmaPion and nSigmaElectron) study
Here's a summary of what I learned from PID cut study as of now. (look for details below)
It seems we can pretty much explained allmost all the obseravations / issues we encountered during the run13-BEMC-calibration from this study.
1) How "slope band" in 2D distributions of E/P vs mometum [ related E/P drop ( BHT1 and BHT3) with increasing momentum ] arises ?
2) Why outtermost 2 Eta rings [E/P vs eta] have systamatically lower E / P relative to all other eta rings and Why innermost eta rings have relatively lower (NOT systamatically significant, though) E/P compared to forward Eta rings (except outtermost rings) ? In fact pretty much mean E/P variation in the all Eta rings ?
3) How's the Electron Positron asymmetry in Eta rings 19 - 27 arises ? ( We have assumed asymmteric pion contamination , and this is cleraly can seen in ring by ring nSigmaPion Vs EoverP distributions - check below under item 3)).
4) How's the cluster Energy method showed larger (lower) E/P (~2%) for inner(outtermost 2) eta rings than tower Energy method ? [still styding ,, but green light from this]
As far as I understand from this study we can explain above Questions and we will able to ajust our nSigmaPion and nSigmaElectron cuts accordingly to resolve above issues. Questions and comments are Welcome!
*********************************************************************************************************************************************************
First of all before go in to more details let me tell the structure of the histograms. The two variables I have plotted everywhere are "nSigmaPion" and "nSigmaElectron" .
Here's the 1-D distributions of these variables for Case 1) and Case 2) described below. [Here nSigmaPion distribution does not peak around 0 , because we alredy have dE/dX cut plced which cut off pions]
.jpg)
.jpg)
.jpg)
.jpg)
One could see that roughly Pions peak around 2.0 while Electrons peak rougly around 4.0 in the "nSigmaPion" scale. You can see that the overlap region is pretty large.
Ring by ring distribution below shows that at outtermost Eta-Rings, it is extremly hard to avoid this large fraction of BG leaking in to the signal region.
Here's (click here) 1D distributions of "nSigmaPions" and "nSigmaElectrons" in ring by rings. Now during the electron analysis of the clibration process, as a part of track cuts (PID) we placed cuts on both these varibales. But most effective one is the "nSigmaPion" cut which will remove majority of the pion BG. To undersatand the various dependancies of these 2 variables, namely "track-Momentum" , "tower-Energy", "tower-Energy/ track-Momentum(E/P)" and also dependance of these 2 variables on each other I have organized the various distributions of nSigmaPion" and "nSigmaElectrons" in 3 different cases.
Case 1) Without placing any of the cut of these 2 variables that we currently use in the analysys, looked at various distribution of both these variables.
Case 2) Place "nSigmaPion cut " ( namely remove everyting below 3.0 of nSigmaPion in our sample) and then looked at various distribution of "nSigmaElectron"
Case 3) Place "nSigmaElectron cut " ( namely remove everyting below in -1 and above 2 of nSigmaElectron in our sample) and then looked at various distribution of "nSigmaPion"
First I consider all the events without triggr specification and then same distributions only using BHT1 trigger fired events and BHT3 trigger fired events separatly.
*********************************************************************************************************************************************************
Now in Case 1) distributions are dominate with BG. So it is bit difficult to analyze them . But in case 2) and 3) it is easy to understand . So most of the time I have included distributions of Case 2) and Case 3) . [ I will link Case 1 distribution later! ] Ring-by-Ring Plots will always be linked.
Below I kind of put together and tried to understand isses I listed at the begining.
*******************************************
1) How "slope band" in 2D distributions of E/P vs mometum [ related E/P drop with increasing momentum ] arises ?
more details [click here]
First of all we need to better understand the "nSigmaElectron" and "nSigmaPions" distribution. The best distributions are tower-Energy dependancy distributions.
Here they are. [ For BHT1 and BHT3 trigger specific distributions (click here ) ] , [ for case 1 distributions as I mentioned in the beginig (click here)]
[[[[[[[UPDATE :
Since we already have placed a dE/dX cut to remove Pions in below plots probaly many of the tracks say 2 could be electrons track.. But tail of the pions goes even up to 4.0 in the scale.
Now clarification of my wording befor you read further.
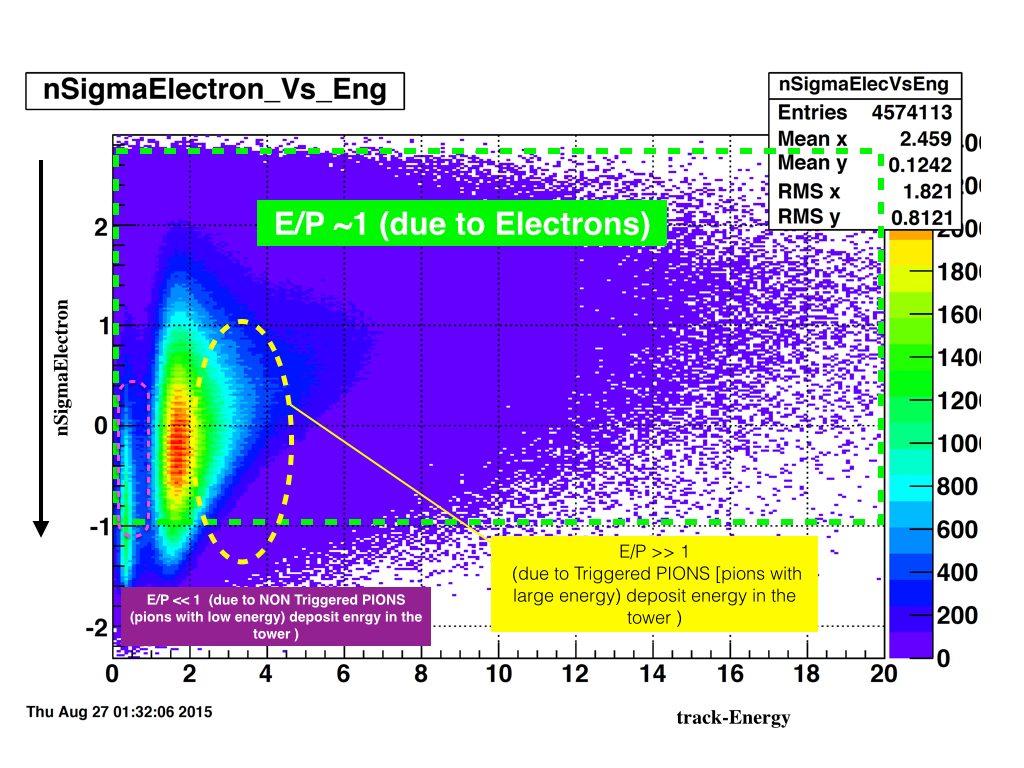
Purple region , which I mentioned as low E/P BG , these are electrons tracks with low energy deposition in the tower ( E/P <<1 , because of poor calorimeter resolution)
Yellow region , which I mentioned as high E/P BG, Triggerd electrons around the thershold ( in other words , matched tracks ) , these are high energetic electrons and deposit there energy in the tower + some other energies from pi0 decay secondary electrons + photons+ some other hadrons act crazy around the trigger thershold ==> E/P >>1 .
]]]]]]]
.jpg)
What I meant as Triggered PIONS is actually pi0 and photons
You can clearly see taht there are sevaral distinguish bands in both distributions as I have highlighted in different colors. Starting from around BHT0 trigger thershold (2.6 ) untill BHT3 trigger thersolds (7.3) pi0s, photons which passes the therosholds and deposit BG energy in the tower marked in the Yellow dash margin causes the data sample to have(trigger bias) high E/P ( E/P >>1). ( I called this due to triggered PIONS( actually pi0 + photons) photons deposited enrgy in the tower). Since these BG are almost everywhere in the momentum region strating from the trigger thereshol We can't remove the effect of this using a momentum cut. But ofcourse their statistics drops offs well above and below the trigger thereshold. The efect from these BG to our average E/P below the thereshold or ( any where for that matter which included the statistics of momentum below 2.5 ) is not notable because the large amount of statistics with E/P ~ 1 (electrons) and E/P << 1 ( Non triggered pions-- : low energetic pions (pi0s, photons) ) lies in the low momentum region . But the moment one goes away from the high density statistics region (low mometum region ) then the sample will be dominated by these triggered pions and you will get <E/P > >>1 . This is the reason why we would get larger E/P if we choose the mometum region above the trigger thereshold.
Now as we witnessed before in the famous "E/P drop with increasing mometum" and also in the above distributions the contribution to the Energy from these BG falls off when goes away from the theresholds, hence dropping of E/P. But still these high E/P BG dominate the sample well above the trigger thershold than the rest of the momentum region ( In BHT1 trigger only after mometum = 8 GeV we notice that E/P is smaller than the E/P seen in low momentum region) .
Heres the "nSigmaPions vs Energy" [click here] , distributions in different mometum slices.
By looking at above ditribution one can conclude theres basically almost no electons above the threshol. You can see top 2 histogram "nSigmaElectron" va "towerEnergy" move away from the nSigmaElectrons ==0 whare one would expect to see electrons.
Below find the E/P drop of BHT1 trigger and some other distribution which explains the drop. [ for BHT3 click (here)]
We can also see the effect from the slope Band in "nSigmaPion" vs "E/P" of BHT1 trigger (click here) and BHT3 (click here). The current "nSigmaPion cut =3 ) we have will not eleiminate this E/P >>1 BG.

We also observed that the E/P drop was more visible for BHT1 triggered events compared to BHT3 triggered events. This is true since the BHT3 trigger thereshold is higher than BHT1 . The below "nSigmaPions vs momentum" , distributions of BHT1 and BHT3 also shows the high E/P pion BG statistics differences in two triggers.
.jpg)
.jpg)
More momentum-slices distribution [will add here soon] !
*******************************************************************************************************************************************
By looking at the correlation between "nSigmaPion" Vs "nSigmaElectron" distribution we can Introduce a new cut to remove these high E/P BG and obtain a clean electron sample.
The below is a way one could introduce a new cut.
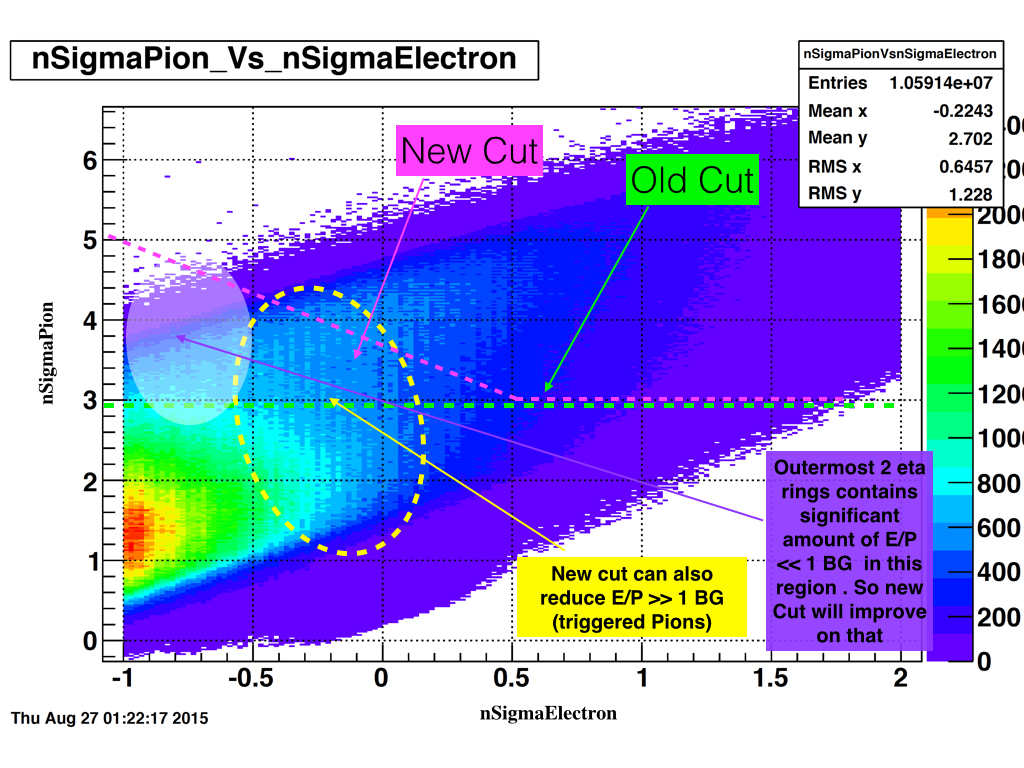
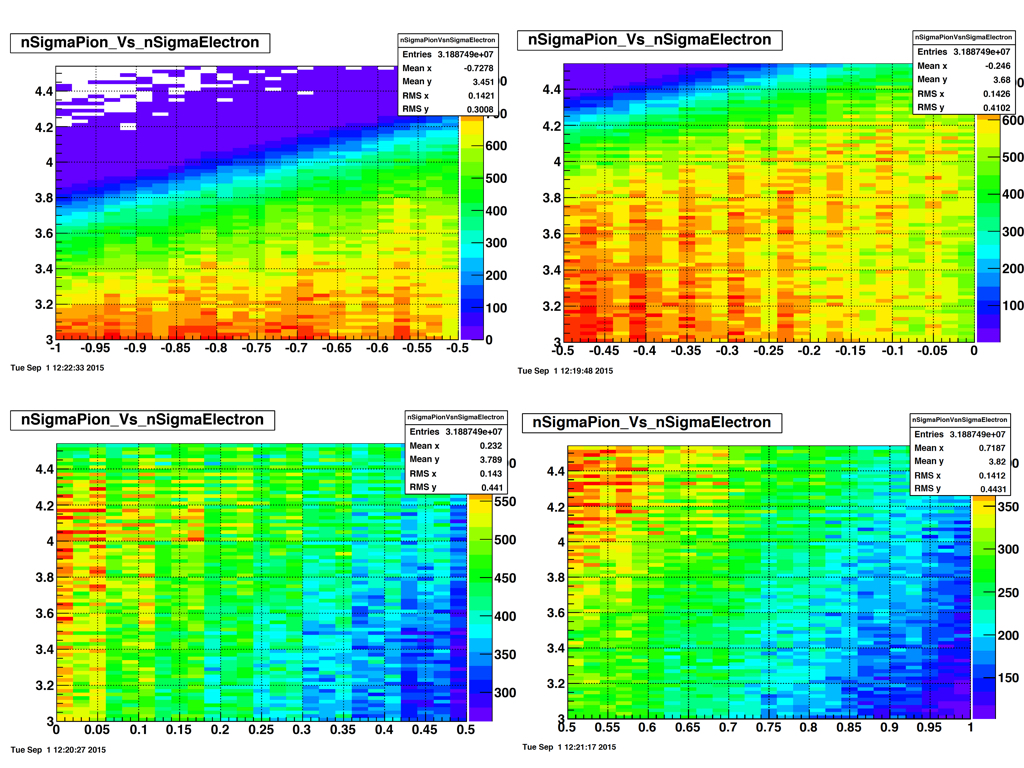
Here's distributions of different slices of "nSigmaElectron" to see clearly pion BG and electrons band changes
I have tested the above cut for now. But we can figure out an efficient "slope" value by fitting two distribution as shown in 1-D distribution above.
I will add new mean E/P fit Vs momentum distribution with the cut I tested here (soon!)
*****************************************************************************************************************************
2) Why outtermost 2 Eta rings have systamatically lower E / P relative to all other eta rings and Why innermost eta rings have relatively lower (NOT systamatically significant, though) E/P compared to forward Eta rings (except outtermost rings) ? In fact pretty much how/why the variation of mean E/P we see for differnet eta rings as wee see it ?
A separate page for this question . [click here]
The main reason for this issue is the low statistics in these outermost 2 eta rings and yet sample is dominated by the low E/P BG. .
To clearly see the differences in terms of ring-by-ring, of distributions of "nSigmaPion and nSigmaElectron Vs tower-Energy" (click here) [ trigger specific] , "nSigmaPion and nSigmaElectron Vs tower-Momentum" (click here)[trigger specific] , "nSigmaPion and nSigmaElectron Vs tower-Energy/ P" (click here) [trigger specific]. 1-D distrubutions (click here) [trigger specific].
As you see below, all the distibution confirm the small N_signal / N_BG for outtremost 2 eta rings. Only way to reduce the effect of the BG is to tight the "nSigmaPion" and "nSigmaElectron" cuts.
Also can check in ring by ring distributions that at innermost eta rings N_signal / N_BG ~ 1 and hence bit low E/P .
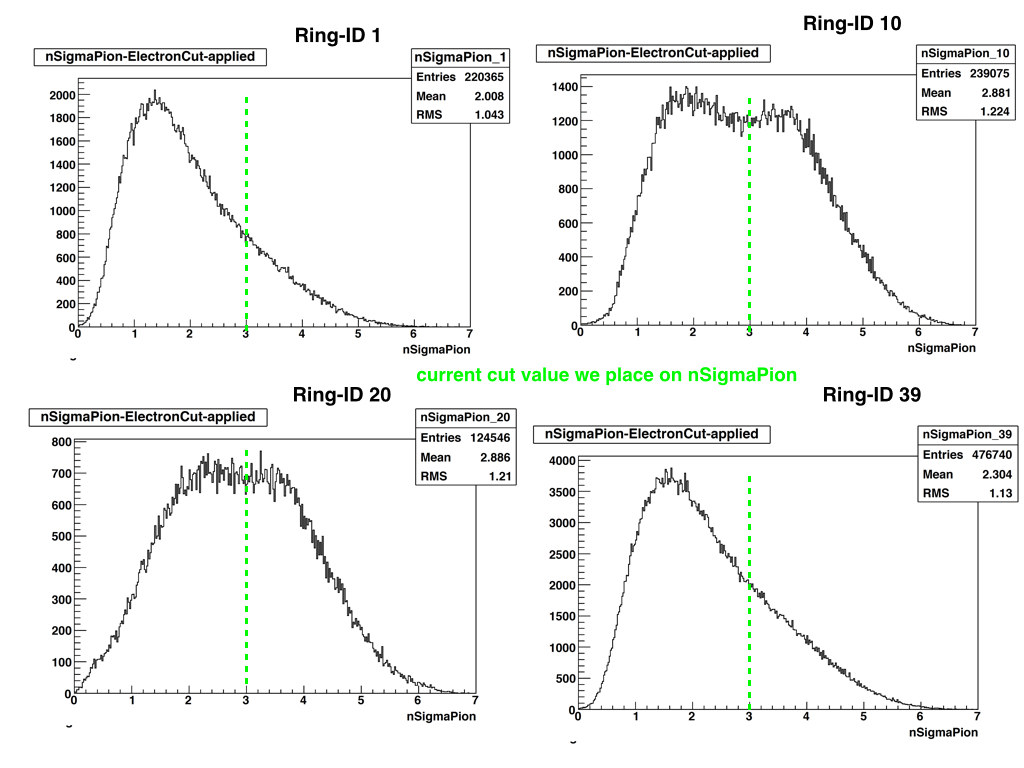
So basically we can see something like this clearly in the 1-D distributions of "nSigmaPion",
Eta rings --> 1,2,39,40 ==> N_signal / N_BG <<<1 ==> E/P <<<< 1
Eta rings --> 3-7, 33-38 ==> N_signal / N_BG >>1 ==> E/P ~ 1
Eta rings --> 8-32 ==> N_signal / N_BG < 1 ==> E/P < 1
Some distributions of ring-ID 1 - eta ~ -1.0 below

.jpg)
[more discussion and plots with new cuts will be added later!!!]
*************************************************************************************************************************************************************
*************************************************************************************************************************************************************
3 ) How's the Electron Positron asymmetry in Eta rings 19 - 27 arises ?
We have seen the E/P asymmtery (click here) of "elctron and positron " betwenn ring -ID s around 19-27. So as we suspected this was cleary caused by the asymmteric pion+ and pion- BG in the data sample.
Here's the "nsigmaPion Vs towerEnergy/ P distribution for ring -ID 22. For other rings (click here)
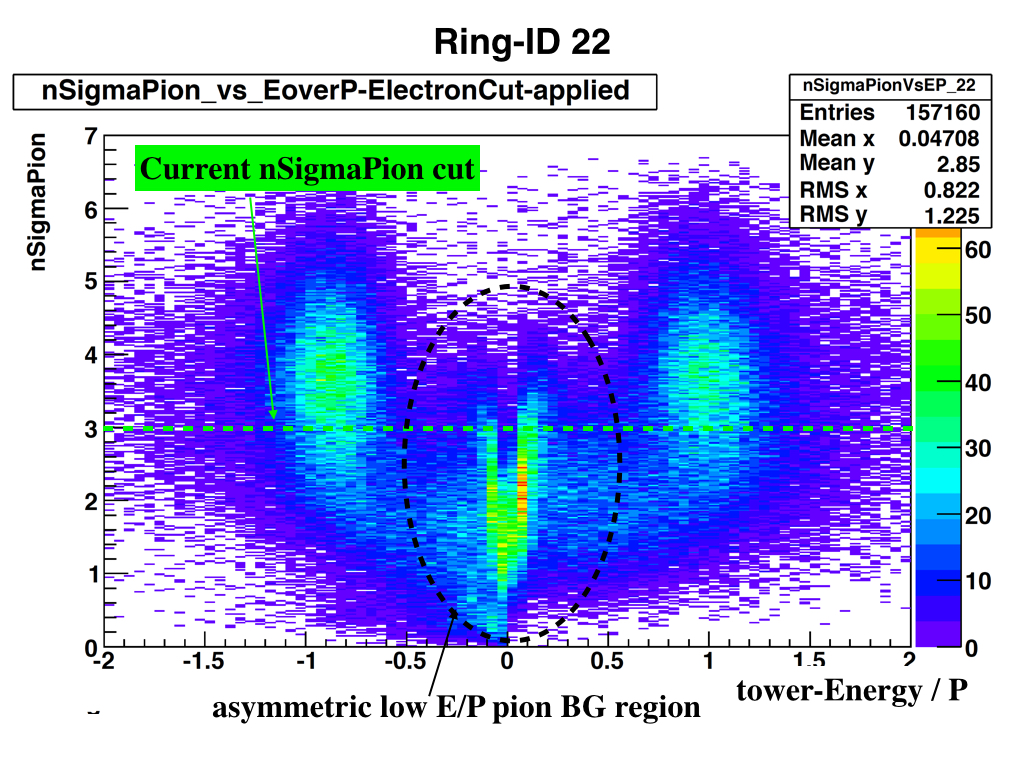
Further tightning the nSigmaPion cut could reduce the effect ,, But doing so we will loose lot of statistics. Or we could introduce charge specific pion cuts. But is it worth doing so?
Thats it for now :
I will add the study about question 4) later !
*************************************************************************************************************************************************************
*************************************************************************************************************************************************************
*************************************************************************************************************************************************************
*************************************************************************************************************************************************************
I wanted to study what type of Background / or other reasons causes the outter-most 2 Eta rings to have low E/P compared to innerEta rings. One easy approch was to introduce a tight "Low-Momentum-Cut" (assuming BG (pion type) dominated in low momentum regions) to these outtermost - eta rings. (check here) . But this method may be not the most efficient way since as we go up in the mometum we are affected by the "trigger bias"
So to investigate more on that I study Momentum, Energy , EoverP , dependance of PID cuts in the whole Eta regions and ring by rings Separately.
We use, nSigmaPion and nSigmaElectron as PID cuts. But out of these 2 cuts most effective cut is nSigmaPion cut.
Above 4 distributions tells Us that whare in particluar majority of Pion BG lies and wheres the electron signal is peak around . From Bottm right plot it is obvious that there is a larger pion contamination to electron signal which Peak around 4.0. We simply use a cut at 3.0 to get rid of the BG. But it seems the contamination of the pion BG in the signal can't eliminate this way. As long as we have more statistics [more electrons than pions we can fit the BG in the way that we used to do, but whenever this S/BG ratio goes up the fitting wont easly justify our BG]
Ring by ring Distribution : click here
In ring by ring plots you can see clearly how signal/BG ratio changes in different eta region .
************************************************************************************************************************************************
Distribution 2 :
nSigmaElectron Vs track-Energy and nSigmaPion Vs track-Energy
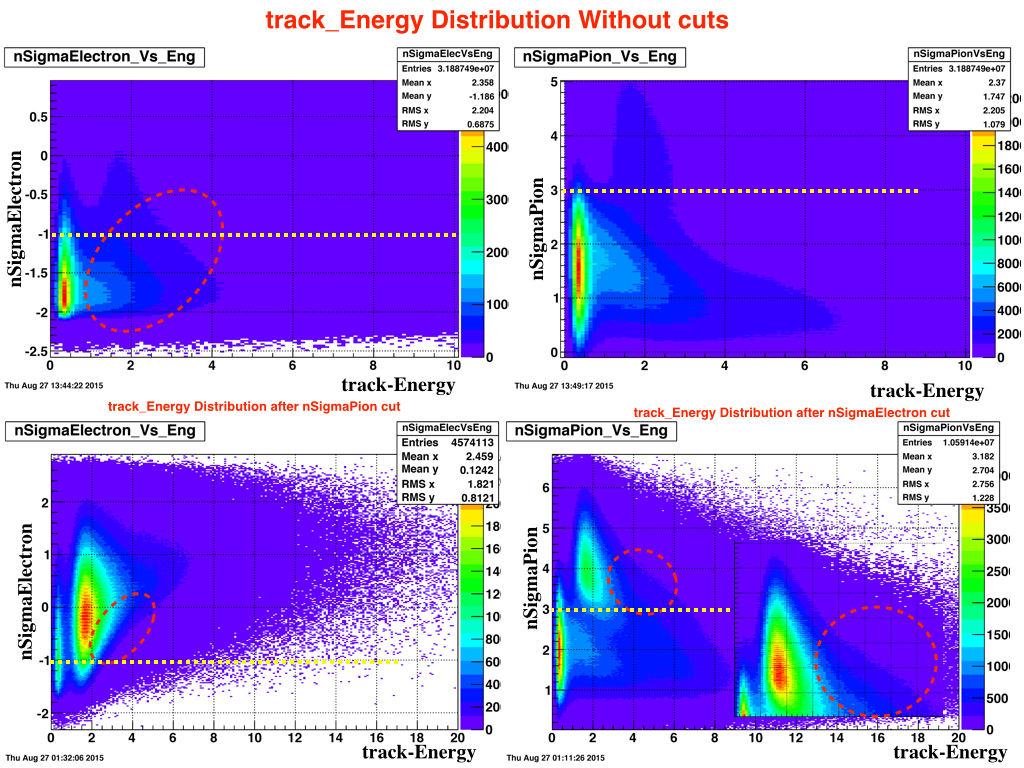
As shown by bottom right plot there seems to have considerable amount of pion BG leaking in to the signal as energy goes up. This BG can see in the bottom left plot as highligeted. Since our cuts for nsigmaElectron is between -1, and 2 the region highlighted will include in the final sample.
Some kind of BG seen in high energy region can clearly see in ring by ring plots.
Ring-by-Ring NO-both of cuts applied ..(here) , Ring-by-Ring One cut is applied ..(here)
In the ring by ring plots above can see that nSigmaElectron distribution started to being stable [ signal] changes with eta rings. Specially for outtermost eta rings this stable band lies above +1 .. (our cut is above -1 ,, so lot of pion BG is included.. ] . Increasing low momentum cut that I did before is not the correct way to solve the BG problem in outtermost 2 eta rings. But it will certainly remove lot of LOW E/P pions. But most efficient way to do this is place the nSigmaPion cut by looking at the corealation between "nSigmaPion" Vs "nSigmaElectron" Distribution.
Here's the distribution of "nSigmaPion" vs "nSigmaElectron" after applying "nSigmaElectron" cut .
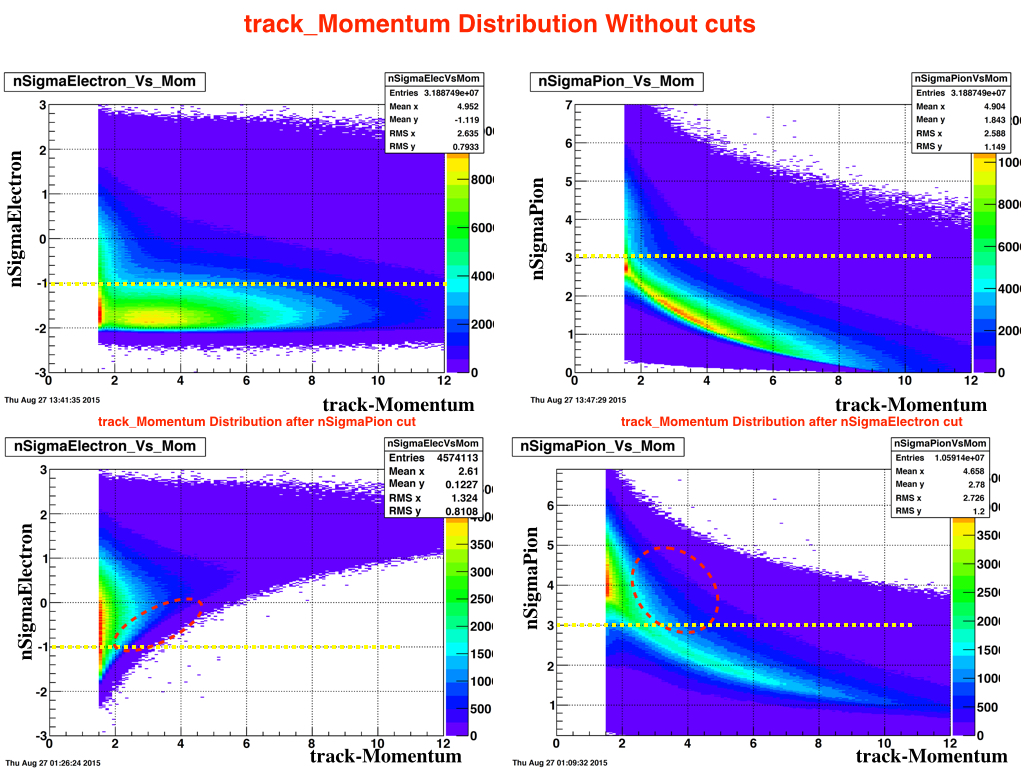
Thought I can get some idea about E/P drop we observe before from these momentum distribution . But This is actually well witnessed and explained in the Energy [ring by ring Energy distribution above ( here I linked again ) distribution above where pion enhancement can seen between Eng 4-6 GeV . This is actually where our trigger theresholds start. So these seems to be false tracks [ pion which passes the trigger therhold ] . These pions will give larger E/P as we seen before around the thershold suddenly , and then E/P will falls of as you see clearly in ring by ring plots that this contamination reduced after the thereshold ] But the affect fron this lies in a broad region in Energy so as discussed before we will not have enough statistics to see stable E/P afterwards. And also This effect I think cannot eliminate using a P cut below thereshold, since these pions BG has low momentum. So they will inevitably increase our E/P. But in low mometum region PIONS with LOW E/P dominate over PIONS with high E/P (comes from high energy region around the thereshold) ,, SO the effect is not so visible .. BUT when you goes up in the momentum contribution from the latter will be significant. One way to check this is to further tight our nSigmapion cut [ can get an idea how from the ring by ring distribution below ] and check the E/P drop in momentum slices for various nSigmaPion cuts!,, working now... ] . This is being analyzed in momentum slices in BHT1 and BHT3 triggers separatly now. (will update here later! ]
Ring by ring plots for mometum distribution :
no cut (here) ,, one cut applied (here)
Ring by ring :
No cut (here) ,,, one cut(here)
These plots "EoverP distributions of nSigmaPion and nSigmaElectron cuts " shows pion BG asymmtery which casese the "elctron" , "positron" asymmtery we witnessed before very clearly in middle rings 19 -30.
- devika's blog
- Login or register to post comments