Run 13 BEMC Calibration - Summary Report [STAR run 2013 pp510 GeV BEMC Calibration]
STAR run 2013 pp510 GeV BEMC Calibration
Introduction
This page outline a summary of STAR run 2013 510 GeV BEMC Calibration which is the first STAR pp 500 GeV energy calibration of the STAR BEMC detector. The Calibration was performed in two steps similar to previous BEMC Calibrations that was performed at STAR. ( STAR 2012 pp200 GeV BEMC Calibration, STAR 2009 pp200 GeV BEMC Calibration, STAR 2006 pp200 GeV BEMC Calibration). During the STAR 2013 pp500 W AL analysis the requiremnet of the BEMC detector calibration was urged due to following reasons.
- Reconstructed Z invarient mass peak from STAR 2013 data is shifetd by ~ 4.6 % towards low mass in comparison to embedded MC.
- Reconstructed W Jacobean peak position from STAR 2013 data is shifetd towards low ET in comparison to embedded MC and Run 12 data.
EMC -meeting-Calibration request - 03-03-2015 (slides)
Relative Calibration using MIPs (ADC)
Absoulte Calibration using Electron/Positrons ( E / p )
-
Method
The idea used here is that since electrons deposit all of their energy in the calorimeter towers, to compare that energy to the momentum of the electron track from the TPC. For a perfect calorimeter E=p = 1 assuming electrons to be massless which is a fine assumption for the tracks with momentum of order of GeV=c. First Trigger requirment was imposed based on the stability of the electrons E /p over the momentum region which was considered. Since no abundent electrons find tower by tower they were grouped in to "eta rings" and then E /p distrubutions of each ring was fitted using "gaussin + exponential" functions to assure that BG wer properly considered. A Gaussian mean of <E/p> was extracted from the fitted funtion and then used to ajust the relative calibarion constant henase obtain abosoulte gain constant for each tower.
-
Electron Selection Cuts
- Rank < 1e6
- -60 < Zvertex<+60
- 1.5 < Track P < 15 : Studies done on track momentum => Click (here)
- Tower QA cuts (Tower Status = 1, mip Status =1, )
- Track nHits > 25 : Studies done on track nHits => Click (here)
-
Trigger Options
Run 2013 Trigger Information (BHT , HT)
|
|
Run 12 pp200 GeV |
Run 13 pp500 GeV period 1, period2 |
L (pb-1) |
Nev (M) |
AV_prescale |
HT Thershold |
|
1 |
BHT0*VPDMB |
BHT0*VPD |
0.139 |
10.095 |
759.65 |
2.75 GeV |
|
2 |
BHT1*VPDMB |
BHT1*VPDMB |
61.635 |
282.985 |
1.729 |
4.25 GeV |
|
3 |
BHT2 |
BHT2, BHT2*BBCMB, BHT2*BJP1 |
~38 |
~35 |
~22 |
6.25 GeV |
|
4 |
BHT2*BBCMB |
BHT3 |
305.562 |
126.949 |
1.000 |
7.75 GeV |
|
5 |
|
JP2 |
286.880 |
162.027 |
1.000 |
~14 GeV |
Calibration Trees were produced including HT flags for BHT triggers using trigger IDs of BHT0, BHT1, BHT2, BHT3 and non HT flags for JP2 triggers. Since BHT0 and BHT2 trigger have neligeble statistics comapred to other HT triggers they were not considered to use in the analysis in the first place.
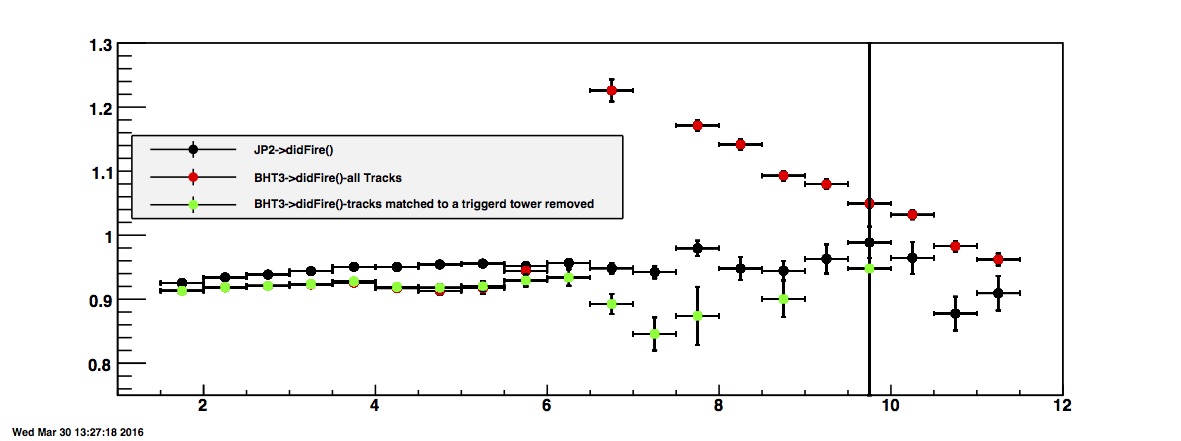
All the tracks of a triggered event were considered during the analysis regardless if the event was fired by an electron or any other particle. For the study of trigger biases of BHT trigger the distributions of E / p as a function of momentum were checked considering all the tracks of triggered events and removing tracks which pointed to a triggered tower.
Distributions Considering all the tracks of a triggered event
- Energy and Momentum distributions
- Energy vs Momentum 2D distributions
- E / p vs Momentum 2D distributions

- <E / p > in Momentum slices distributions
Actual distributions, (Click here) Actual distributions, (Click here) Actual distributions, Click (here)
Distributions after removing tracks which matched to triggered Tower
- Energy and Momentum distributions
- Energy vs Momentum 2D distributions
- E / p vs Momentum 2D distributions
- <E / p > in Momentum slices distributions
BHT1->didFire() : BHT3->didFire() :
Actual distributions, Click(here) Actual distributions, Click(here)

(link) (link)
Distributions considering only tracks which matched to triggered Tower
EMC -meeting-updates - 03-29-2016 (slides)
Emc -meeting-updates - 03-29-2016 - comments
- Accessing non HT triggers may introduce biases due to veto ing on HT did fire() conditions, can't really tell exactly what triggers are considered. [obtain truth tables to understand various trigger conditions of accessing non HT triggers].
- Understandand clearly the syaytamtic differnece of E /p between JP2 (or other non HT for that matter) and HT below the HT thershold. May be consider HT (BHT3) below the thershold and fold the differnces in to systamatics.
- Check out the distribution of E /p for HT triggers after removing tracks which matched to a triggerd tower
[ ( JP2->didFire () || (track P < 3 && BHT->didFire())]
-
Trigger Options and momentum cuts based on the Eta Rings
bla
2x2 Cluster Method
EMC -meeting-updates - 05-10-2016 (slides)Emc -meeting-updates - 05-10-2016 - comments
- E / p difference beween JP2 vs HT at P < 3 GeV put in to systametics [ How ?] [ Separatly fit E / p for JP2 and BHT3 below P > 3 in eta rings and take the difference on <E /p > in all eta rings
- Low P E / p drop : Fitting supposed to adress this BG well , may be ther's a another pedestal BG which does not expalin well with exponential shape , [ look for different fitting shapes ? ]
- BHT3 below P = 3 GeV is good
- Cluster method - Isolation cut
Explantion of the flat region below 0.82 does not agree with our explanation !
Systamatic Error Calcualtions
blaEMC -meeting-updates - 06-21-2016 (slides)
Summary
Spin PWG -meeting-summary report - 07-11-2016 (slides)
Comments : Run 13 BEMC Calibration Gain Constants
Period 1 Period 2 Momentum Dependance for E / p for HT trigger [ E / p drop study]
Slides
Analysis Note
Draft
References
Run13-period2 Run 12 pp 200 Gev BEMC calibration:
Trigger-conditions-truth-tables- https://drupal.star.bnl.gov/STAR/system/files/TriggeringCondition_2012_pp200.pdf
Previous years BEMC Calibration:
2006 BEMC Tower Calibration Report
2009 BEMC Tower Calibration Report
Report from the STAR EMC Calibrations Workshop
BEMC Calibrations section on Drupal (Click here)
Systamtic error References :
Run 12 systamatic error doumentations :
https://drupal.star.bnl.gov/STAR/system/files/CalibSystematics_10132015_PDF.pdf
https://drupal.star.bnl.gov/STAR/system/files/CalibSystematics_02102016_v2_PDF.pdf
https://drupal.star.bnl.gov/STAR/system/files/ErrorTable_PDF_0.pdf
Run 9 systamatic error doumentations :
https://drupal.star.bnl.gov/STAR/blog/wwjacobs/2012/nov/20/btow-calibration-notesdiscussion-11-20-12
- devika's blog
- Login or register to post comments