- dilks's home page
- Posts
- 2019
- 2018
- December (1)
- November (1)
- October (1)
- August (2)
- July (4)
- June (3)
- May (1)
- April (2)
- March (2)
- February (1)
- January (5)
- 2017
- December (3)
- November (1)
- October (2)
- September (3)
- August (2)
- July (2)
- June (1)
- May (2)
- March (3)
- February (3)
- January (3)
- 2016
- November (2)
- September (4)
- August (2)
- July (6)
- June (2)
- May (3)
- April (1)
- March (2)
- February (3)
- January (2)
- 2015
- December (3)
- October (3)
- September (2)
- August (6)
- June (3)
- May (3)
- April (4)
- March (3)
- February (5)
- January (3)
- 2014
- December (1)
- November (1)
- October (3)
- September (4)
- August (3)
- July (3)
- June (2)
- May (2)
- April (2)
- March (1)
- 2013
- 2012
- 2011
- My blog
- Post new blog entry
- All blogs
A_LL Consistency Checks
This page collects the results of various consistency checks for ALL calculation over Run13 data
SLIDES FOR 5 JUNE 2014 SPIN MEETING
Relative Luminosity -- DETAILS
- Omitted bXings with low scalers
- Omitted first 2 bunches from each beam for F17512-17520 (details found in wcm data here and in scalers rate here)
- Not using spinbit equalized calculation
π0 Cuts -- KINEMATICS PLOTS
- 100 mrad isolation cone
- Triger mask -- TrigBits & 0x200 == 1
- 200 = jet 1
- 400 = jet 2
- Energy sharing -- Z < 0.8
- Mass Cut -- | M12-0.135 | < 0.1
- Not kicked from rellum analysis -- kicked == 0
Kinematic Ranges
- E12 range: 12.000902 -- 249.192657
- pT range: 0.285719 -- 15.0 // cut off at 15 GeV, since pi0 reconstruction unreliable at higher pT
- η range: 2.566771 -- 4.462000
~~~~~~~~~~~~~~~~~~~~~~~~~~~~~~~~~~~~~~~~~~~~~~~~~~~~~~~~~~~~~~~~~~~~~~~~~~~~~
ALL binned in pT
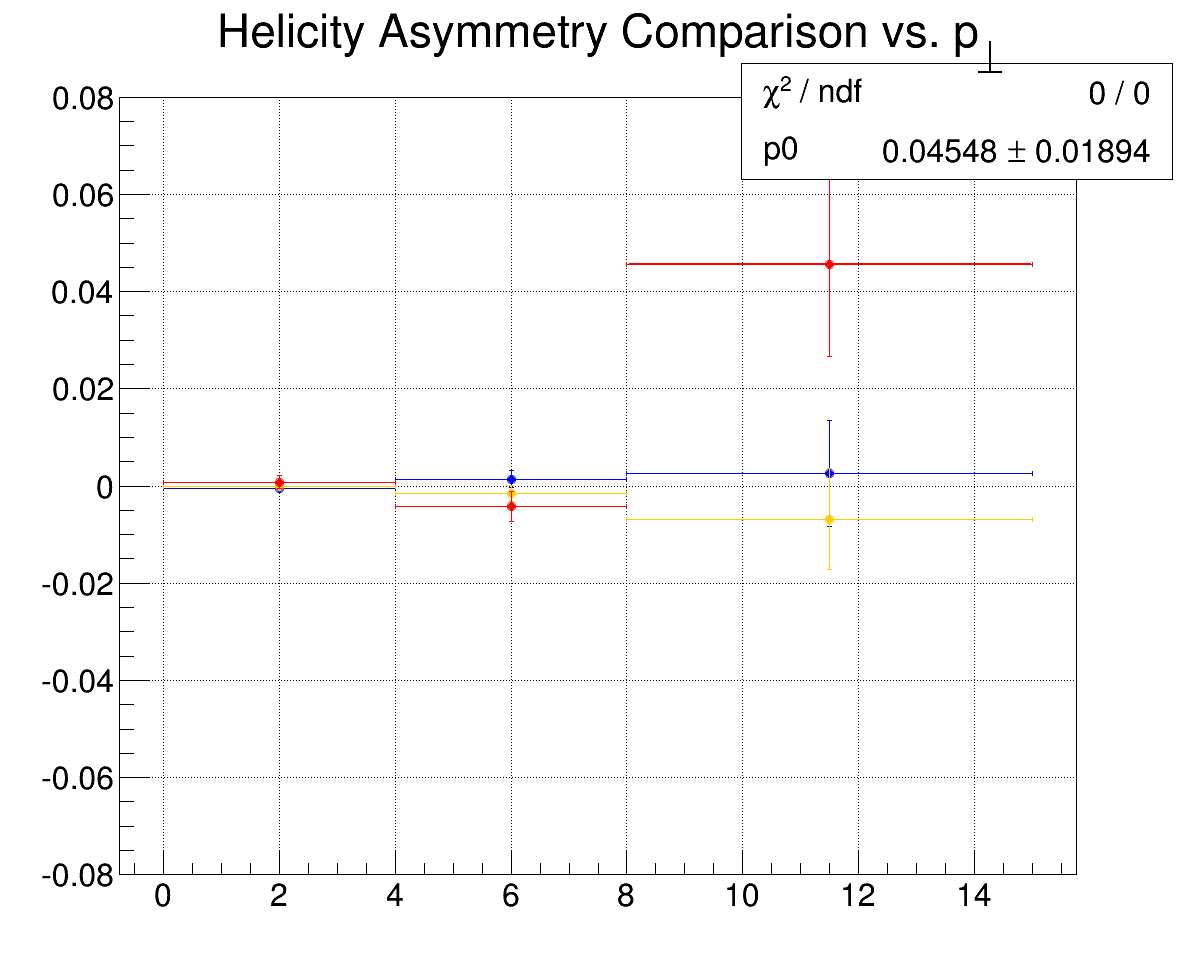
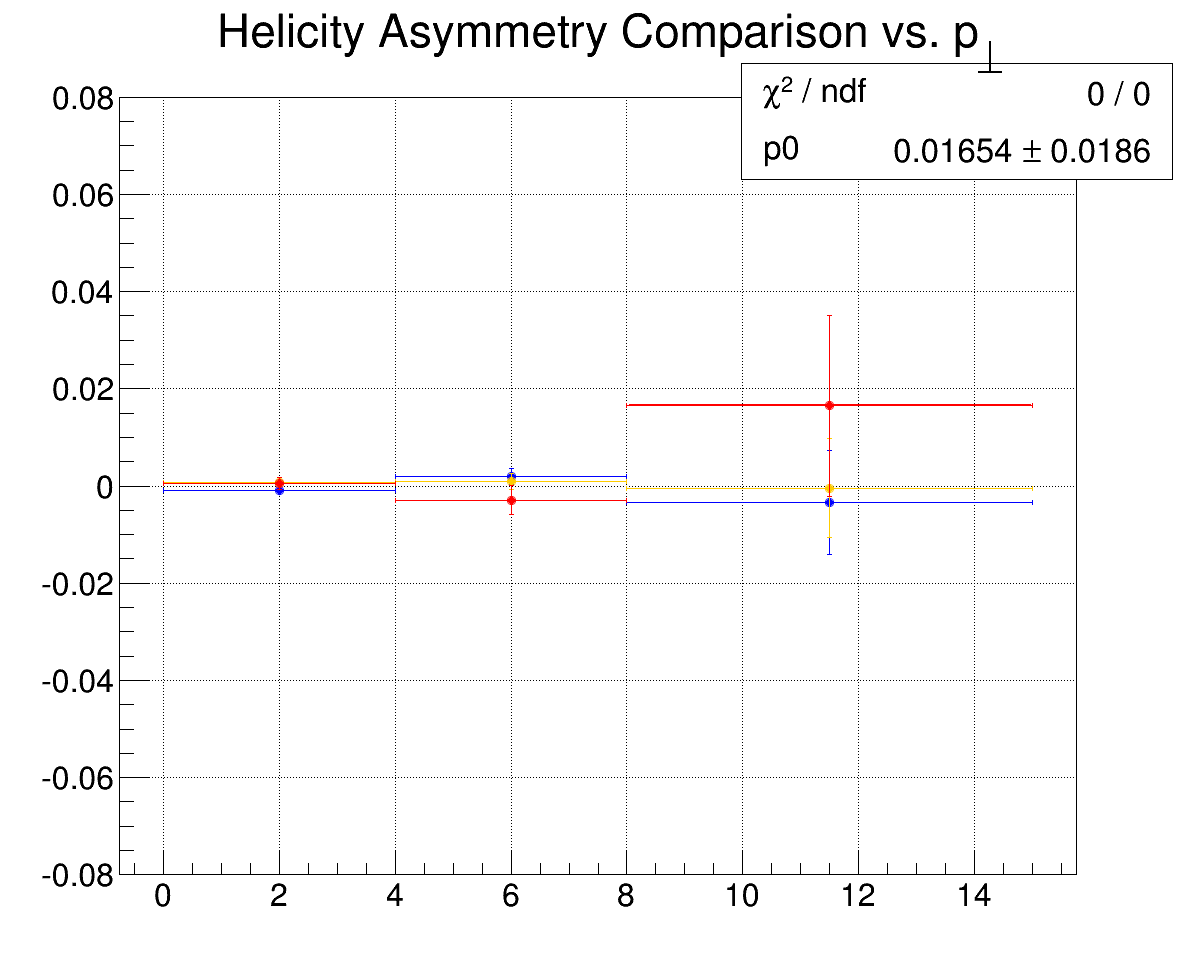
The quoted fit parameters are nominal value and error of ALL in the high pT bin; chi2/ndf is irrelevant
The colors represent:
- Red = ALL
- Blue = blue AL
- Yellow = yellow AL
All runs that pass consistency checks in rellum analysis which intersect pi0 reconstruction are included in this calculation
.png)
ALL with F17512-17520 omitted
- This calculation omits the problematic region, where first bunch of fill was low for each beam
- Nominal value is a bit closer to zero, but the error bar is 6e-4 higher
.png)
ALL for first half of Run13 vs. second half
- Left: runs 14107139 -- 14144035
- Right: runs 14144036 -- 14158017
- The first half of run13 data set shows higher asymmetry than second half
- The conclusion here does not differ much if we exclude the 'problem region'
.png)
.png)
ALL for even run numbers (left) and odd run numbers (right)


ALL for first half of bXings vs. second half
- Left: bXing no. < 60
- Right: bXing no. >= 60
- pT dependence seems similar; error bars overlap from each
.png)
.png)
If we compute a "baseline" asymmetry, defined as the double (or single) helicity asymmetry for π0s with only mass cut, Z cut, trigbits cut, and pT < 15, integrated over all kinematic bins, we find that:
- For all bXings:
- double asymmetry = 0.000133786 +/- 0.000825267
- blue single asymmetry = -0.000300261 +/- 0.00047286
- yellow single asymmetry = 0.000249872 +/- 0.000453059
ALL binned in Energy ~ pL
This first plot shows the difference of energy and pL vs. pT
For pT<15 GeV, we see the difference of energy and longitudinal momentum is <1 GeV, thus considering
dependences of variables on energy is approximately the same as considering dependences on longitudinal momentum.
.png)
Full ALL
Consistent with zero
.png)
For the data set omitting the problematic region and the first half of runs compared to second half, there are no indications of nonzero asymmetry
.
Now consider the pT dependence of ALL for different energy bins, shown in the first row, as well as AL for blue and yellow shown in the second and third rows:
.png)
.png)
.png)
.png)
.png)
.png)
.png)
.png)
.png)
- dilks's blog
- Login or register to post comments
