Subtle flow and anti-flow patterns visible on the EPD - Au+Au 27 GeV
Updated on Sat, 2018-06-02 08:19. Originally created by lisa on 2018-06-01 18:47.
Executive Summary
Flow and antiflow patterns can be visualized with the EPD. This post is almost entirely pictures.
The idea for these images was suggested by OSU grad student Andrew Kubera.
I've pointed out that charged particle flow evolves from flow (v1>0) to antiflow (v1<0) within the acceptance of the EPD. Now that we have decent first-order event plane resolution, we can use the EPD to directly see flow and anti-flow patterns.
I focus on Au+Au collisions at 27 GeV, 10-40% centrality, |Vz|<30 cm. For EPD experts, I use MAX=2.0, and the RG16 optimized ringweights.
After phi-weighting, the weight distribution, shown in figure 1 is isotropic for every ring.
When viewing these plots:
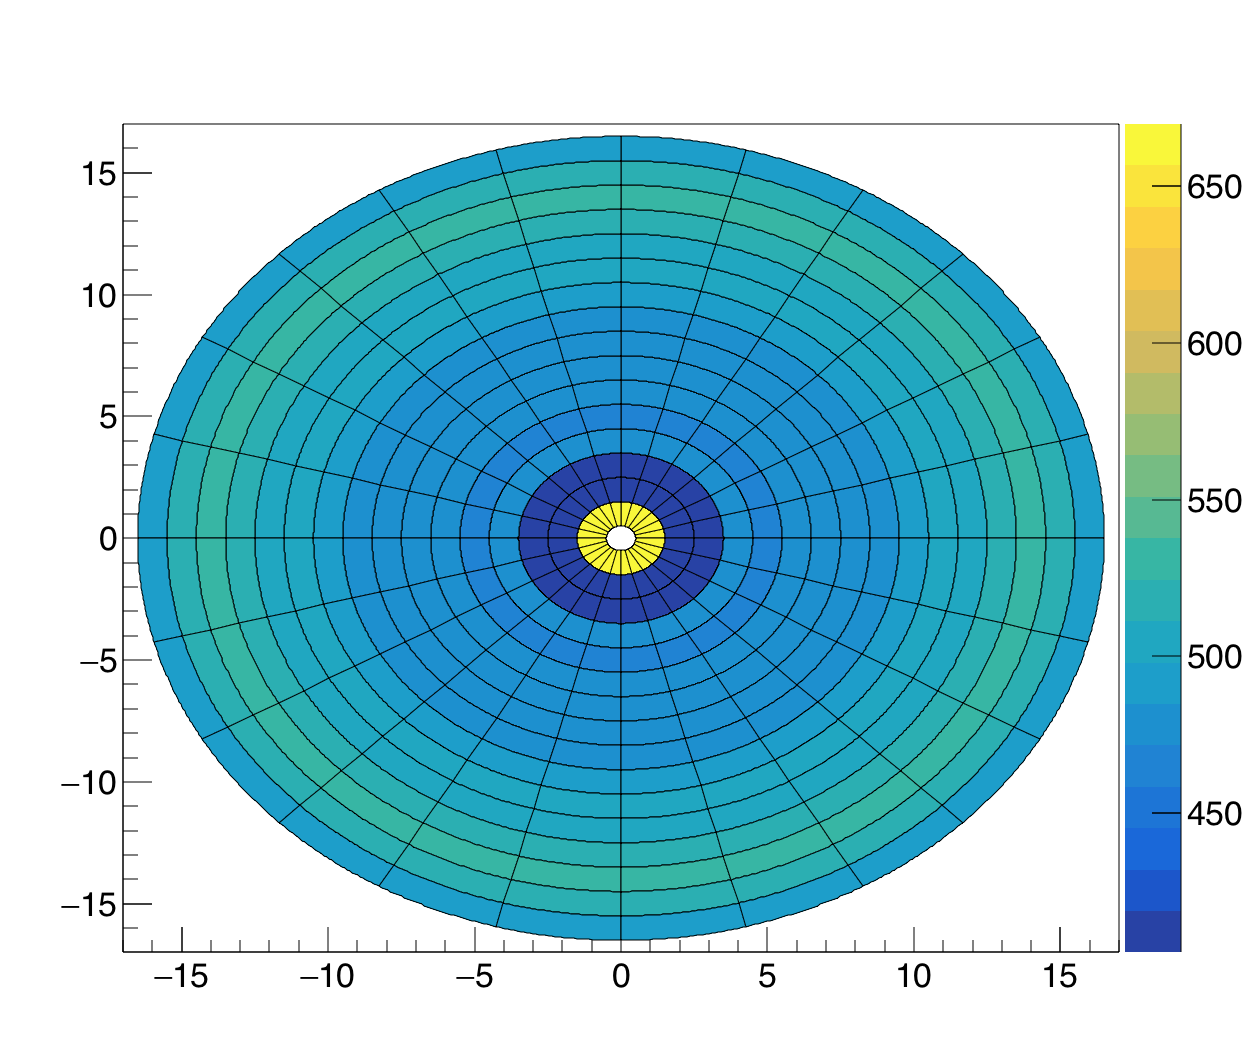
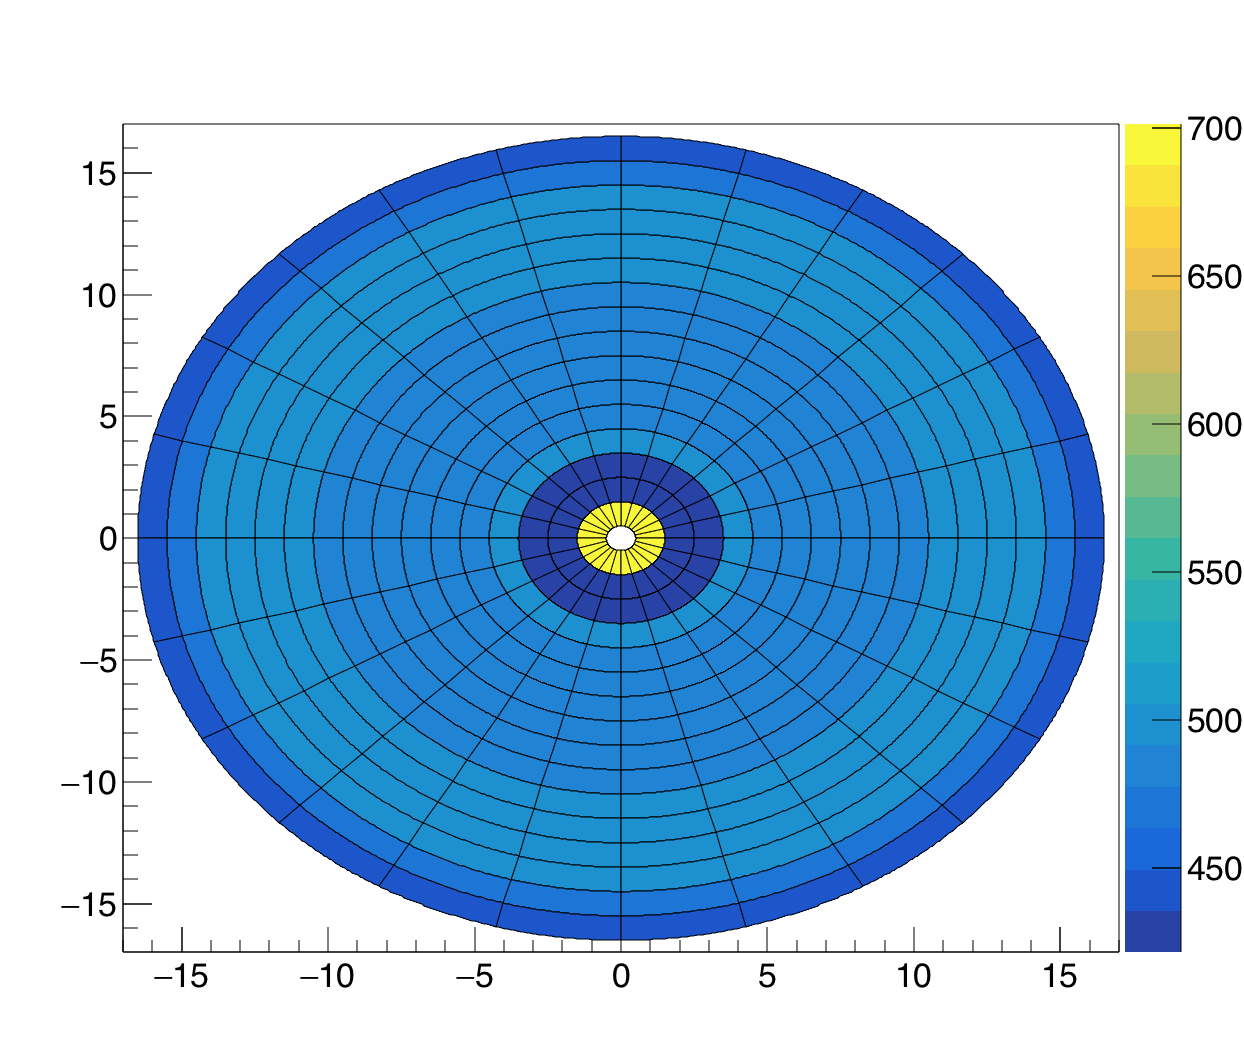
Figure 1- East (left) and West (right) EPD wheels, after phi-weighting. The phi-weighting corrects for anisotropies and fluctuations present at the ~5% level. Note the difference in scales: the West EPD shows higher flux for the innermost rings, likely an effect of upstream scattering.
Now we find the "full event" (i.e. using information from both East and West EPD) first-order event plane, and rotate the hits such that Psi[1]=0.0 (i.e. it points South in the STAR Hall).
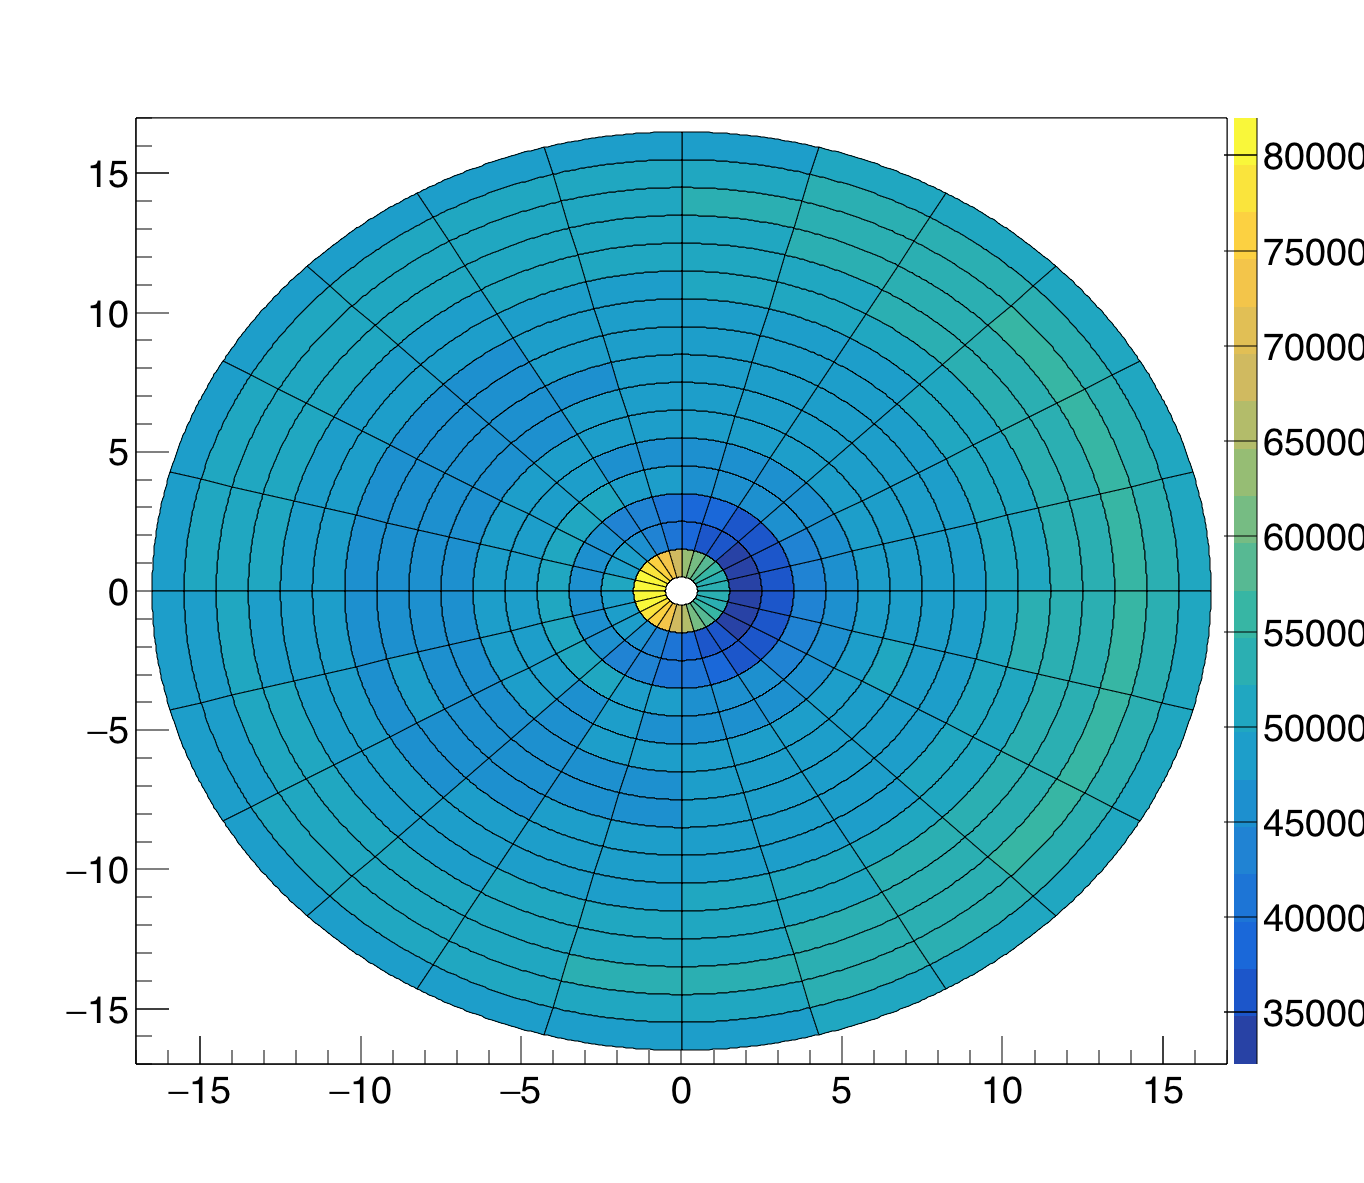
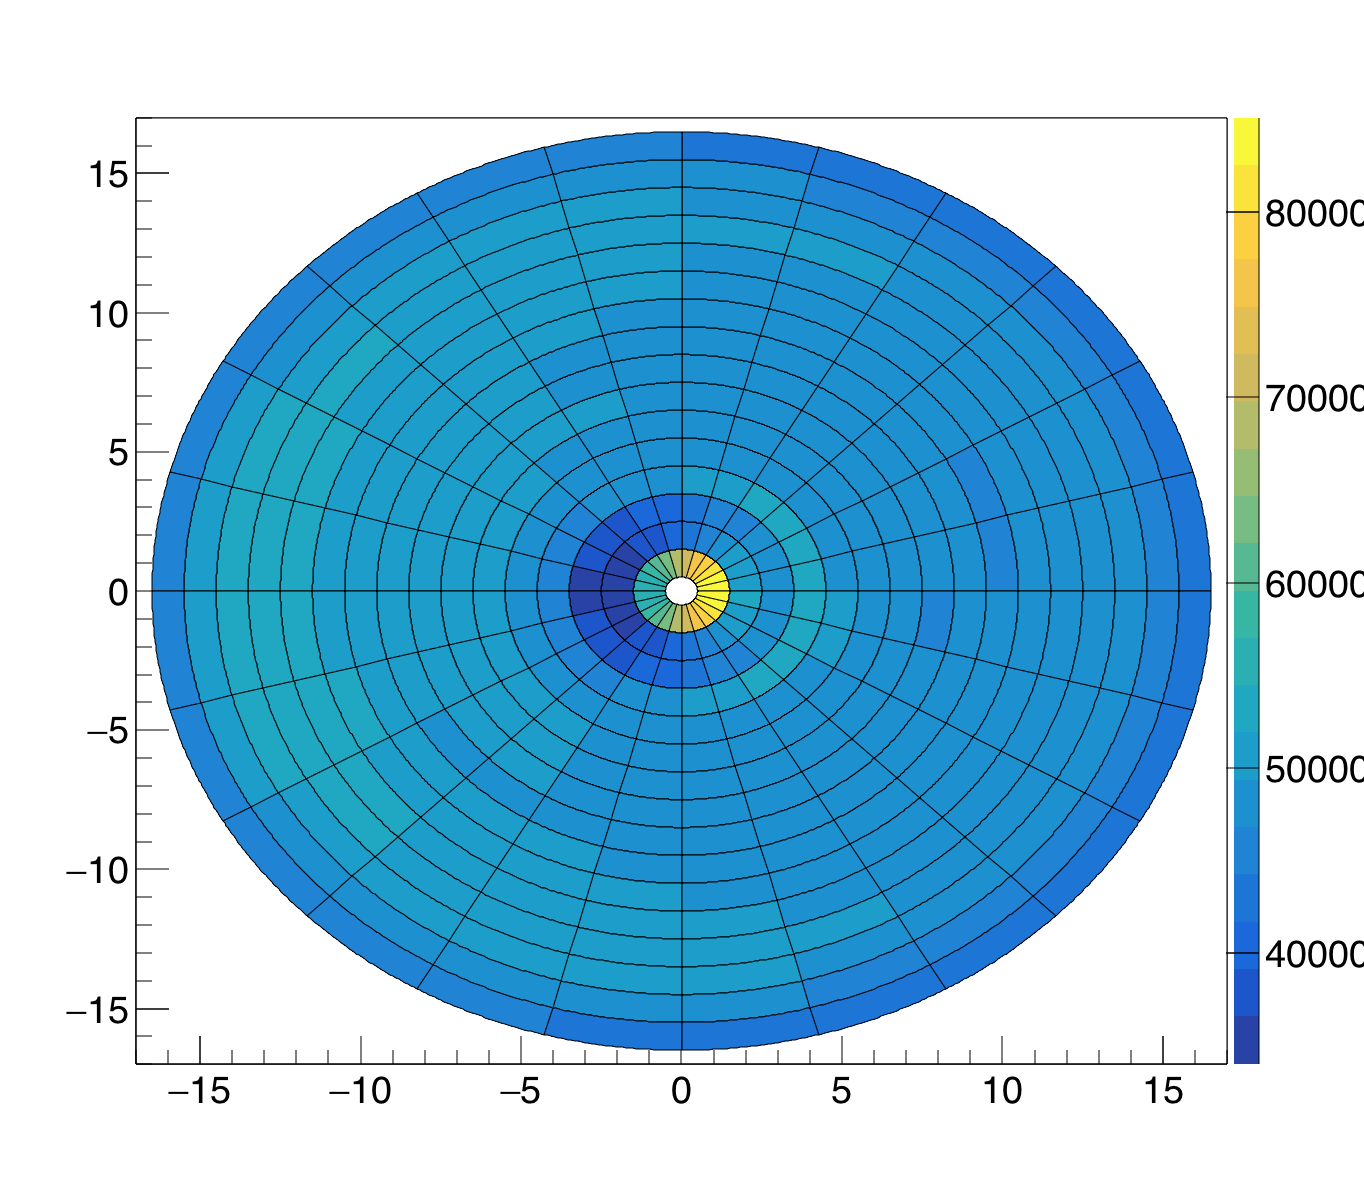
Figure 2 - East (left) and West (right) EPD wheels. Hits have been rotated such that the full event plane angle points at 0 degrees in STAR Coordinates.
Spectators are at eta~5, so hit the innermost ring. These show positive flow, so, for the inner tiles, the West (z>0) EPD has excess signal at phi=0, and the East (z<0) EPD has excess signal at phi=pi.
A little more subtle is the pattern from the anti-flow of the participants, which hit the outer rings. But it is there, if you look closely. Go ahead, look.
Still hard to see? A more direct way to see it is with a lego plot:
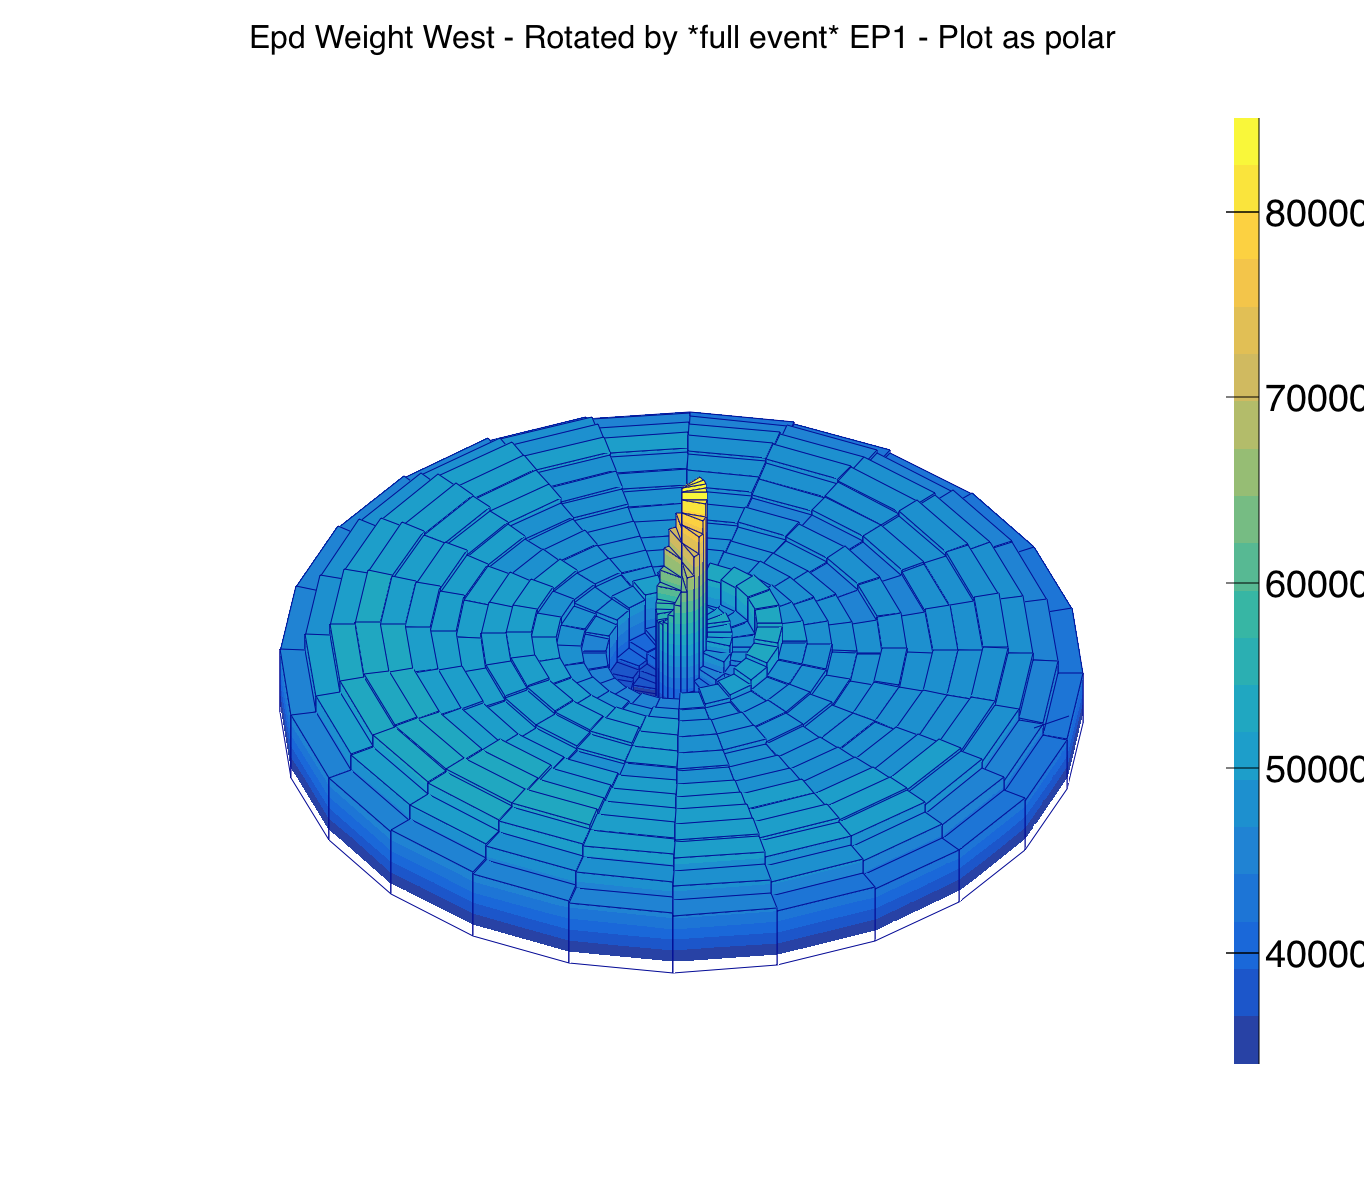
Figure 3 - Same as the right panel of figure 2, except as lego plot, seen from perspective.
.png)
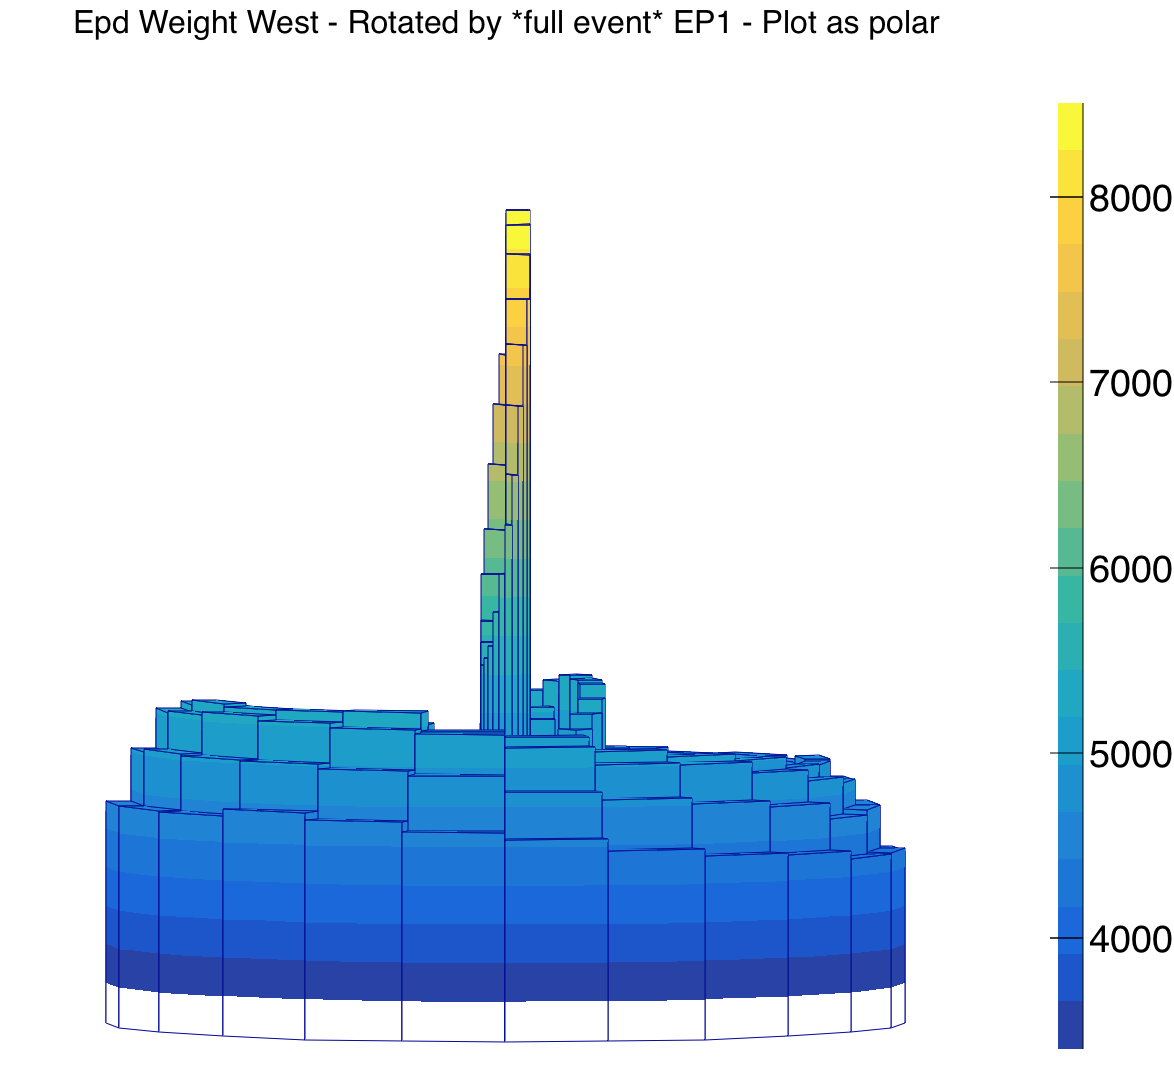
Figure 4 - Same as figure 2, except in lego plots from side view.
Well, now it's a little clearer, isn't it?
We can also divide out the radial dependence, by dividing the histograms from figure 2 with those from figure 1. That is below in figure 5:
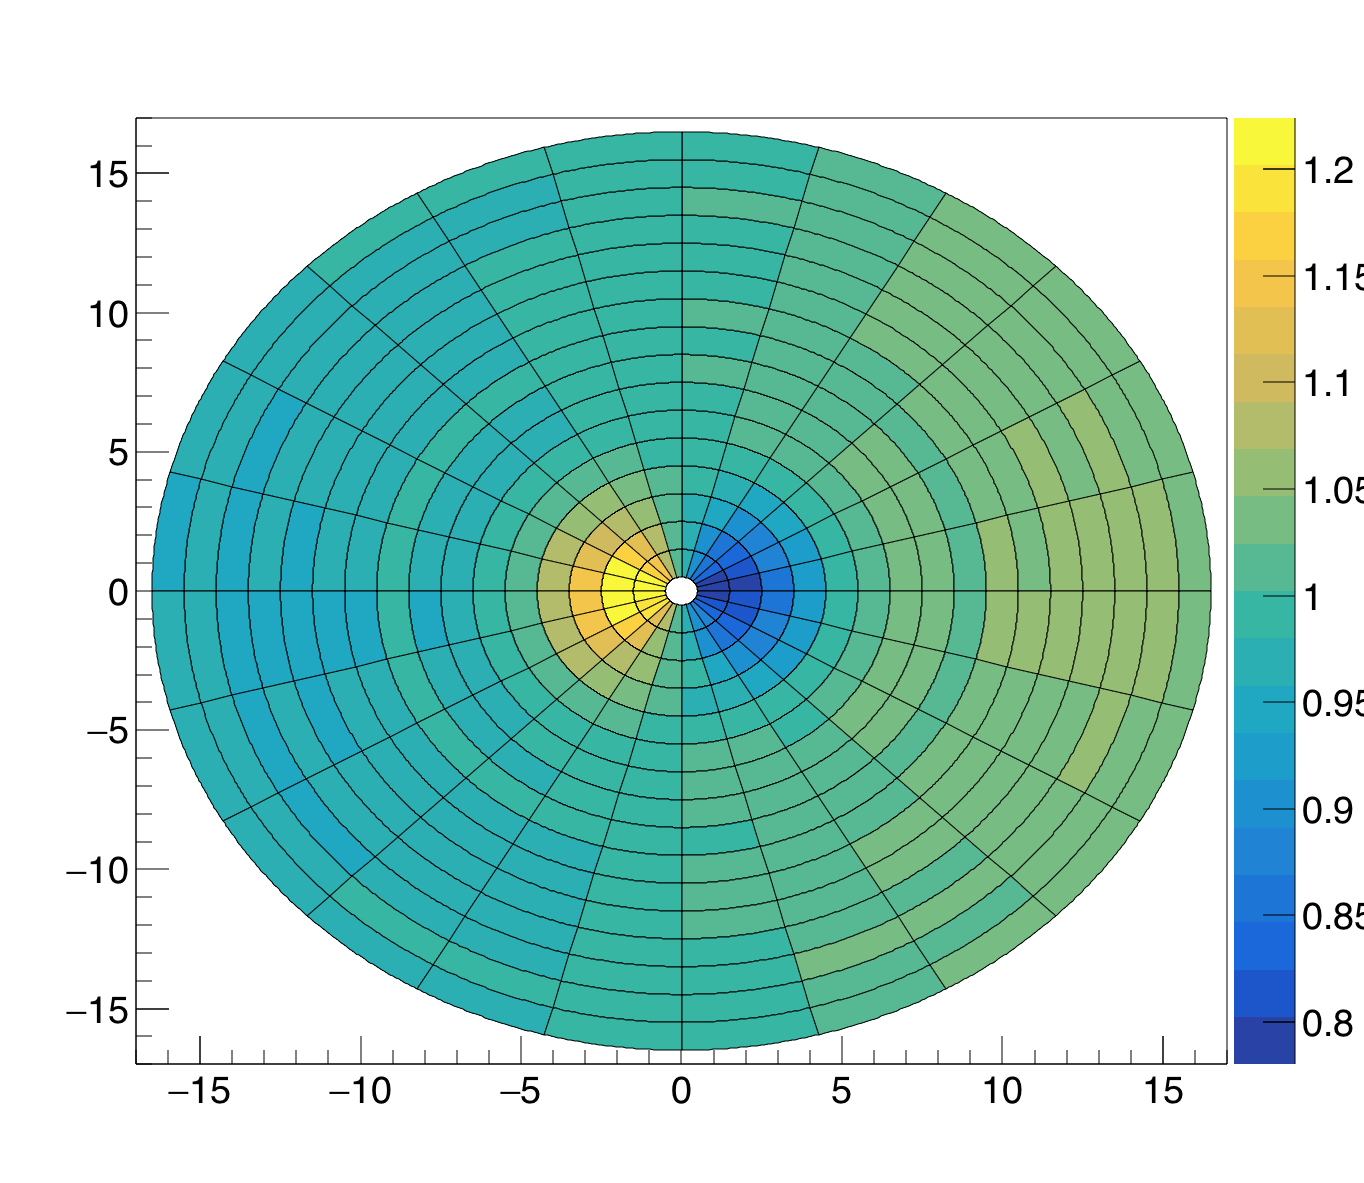
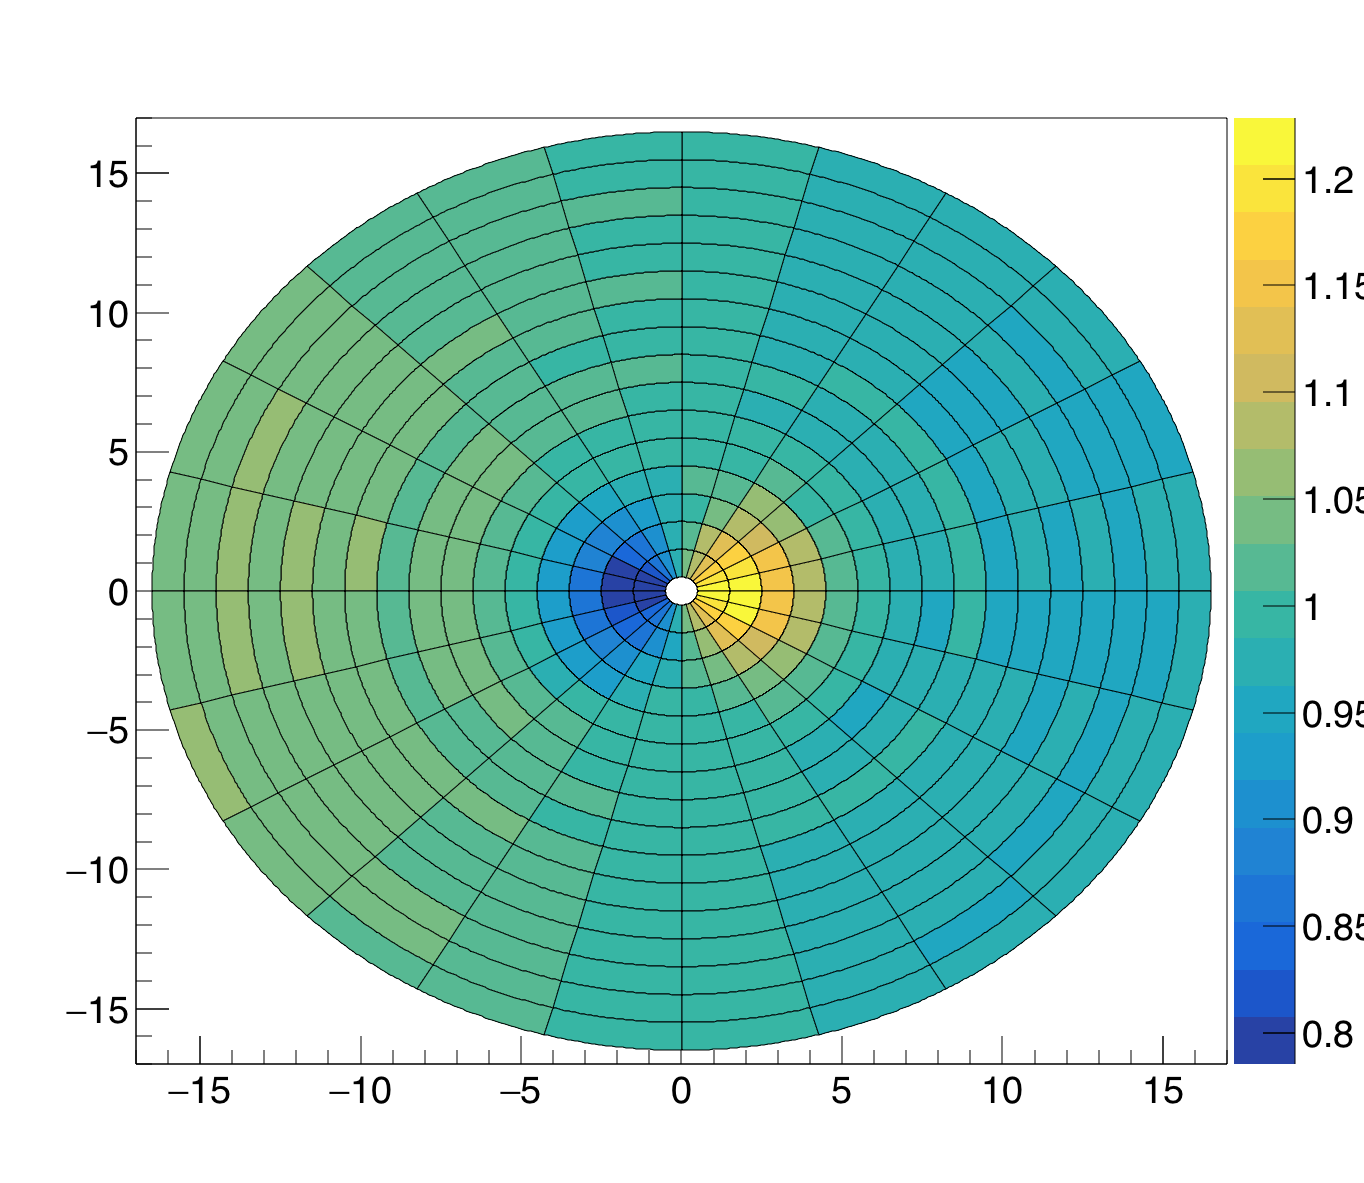
Figure 5 - Histograms from figure 2 divided by those from figure 1. The positive flow in the inner rings is clear. Careful inspection shows negative flow in the outer rings.
Again I can plot these "normalized" histograms as lego plots. Not entirely clear it helps, but maybe a little:
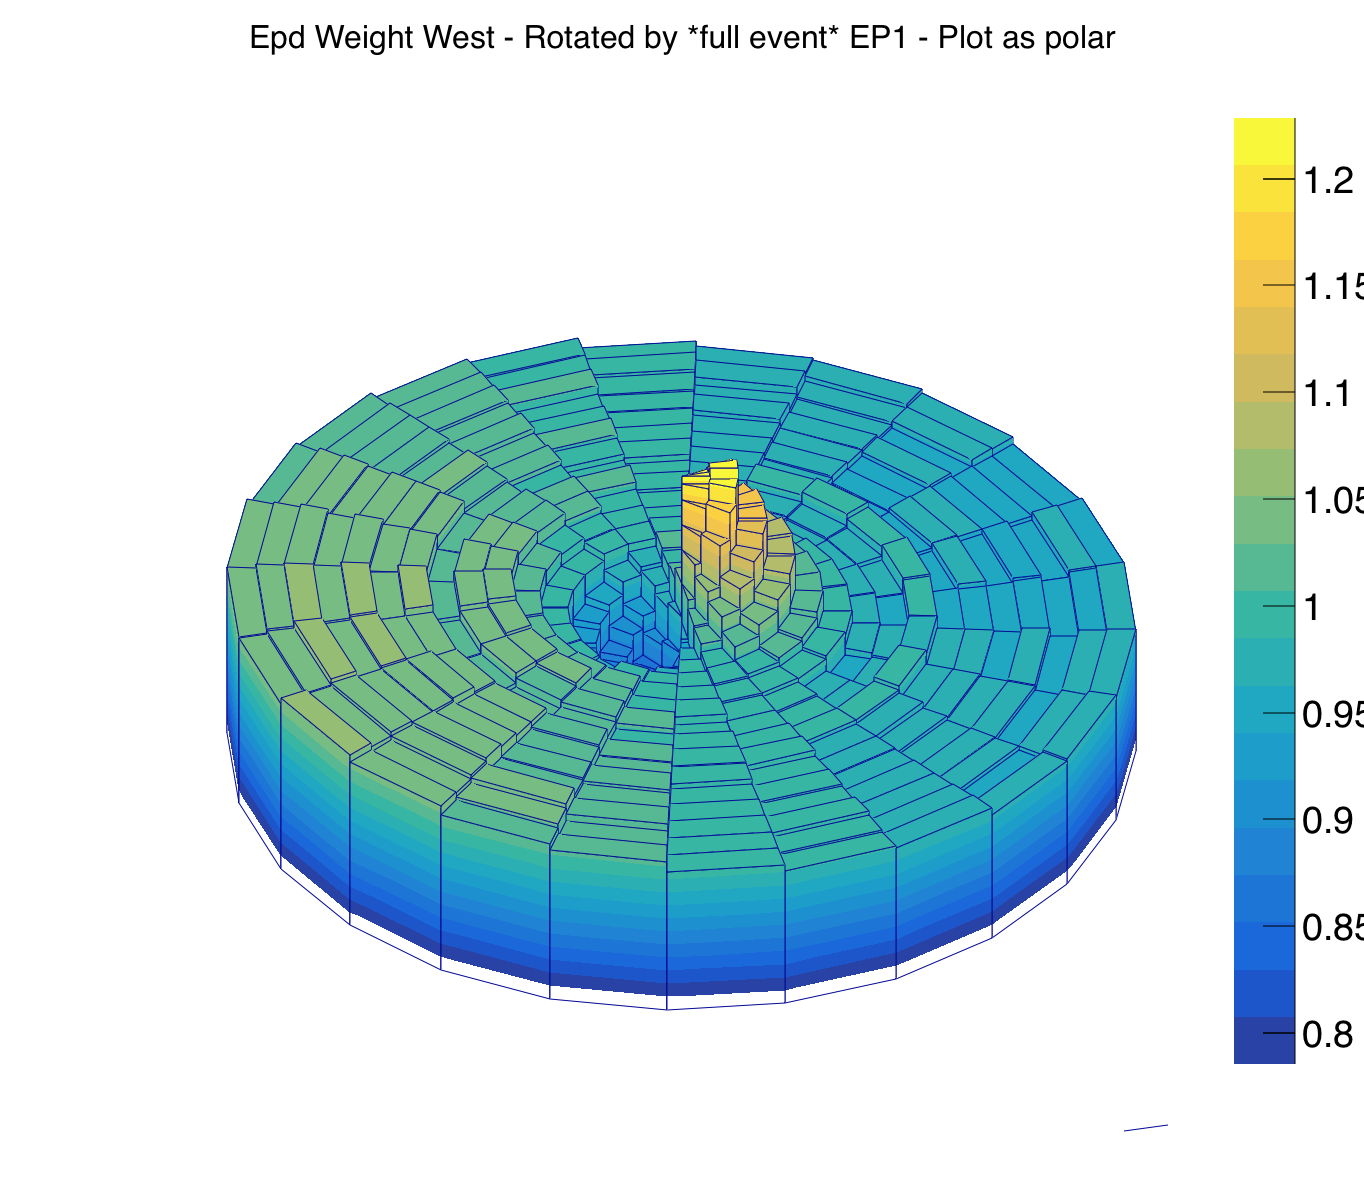
Figure 6 - Same as right panel of figure 5 except as lego plot from perspective.
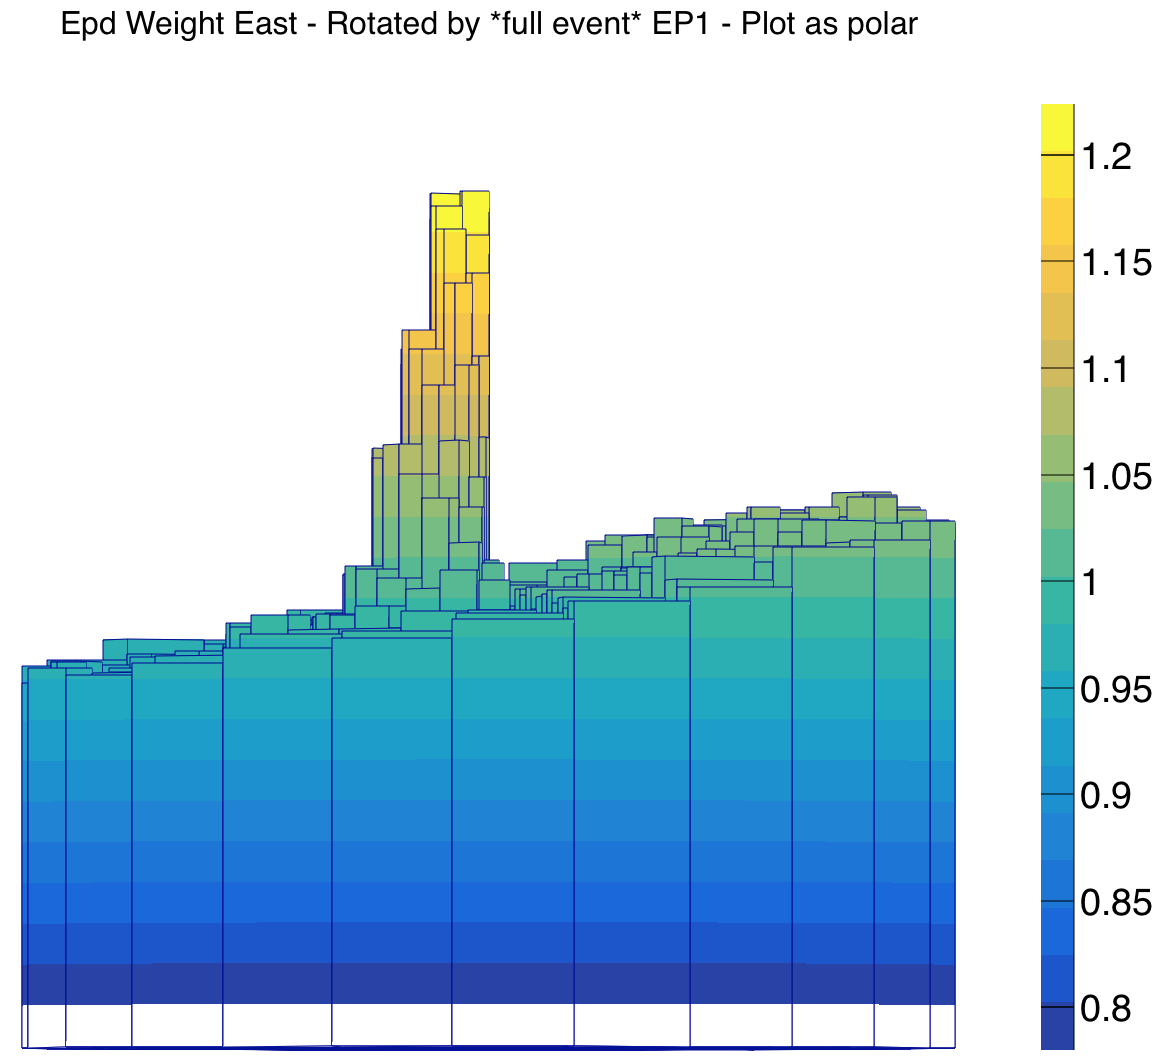
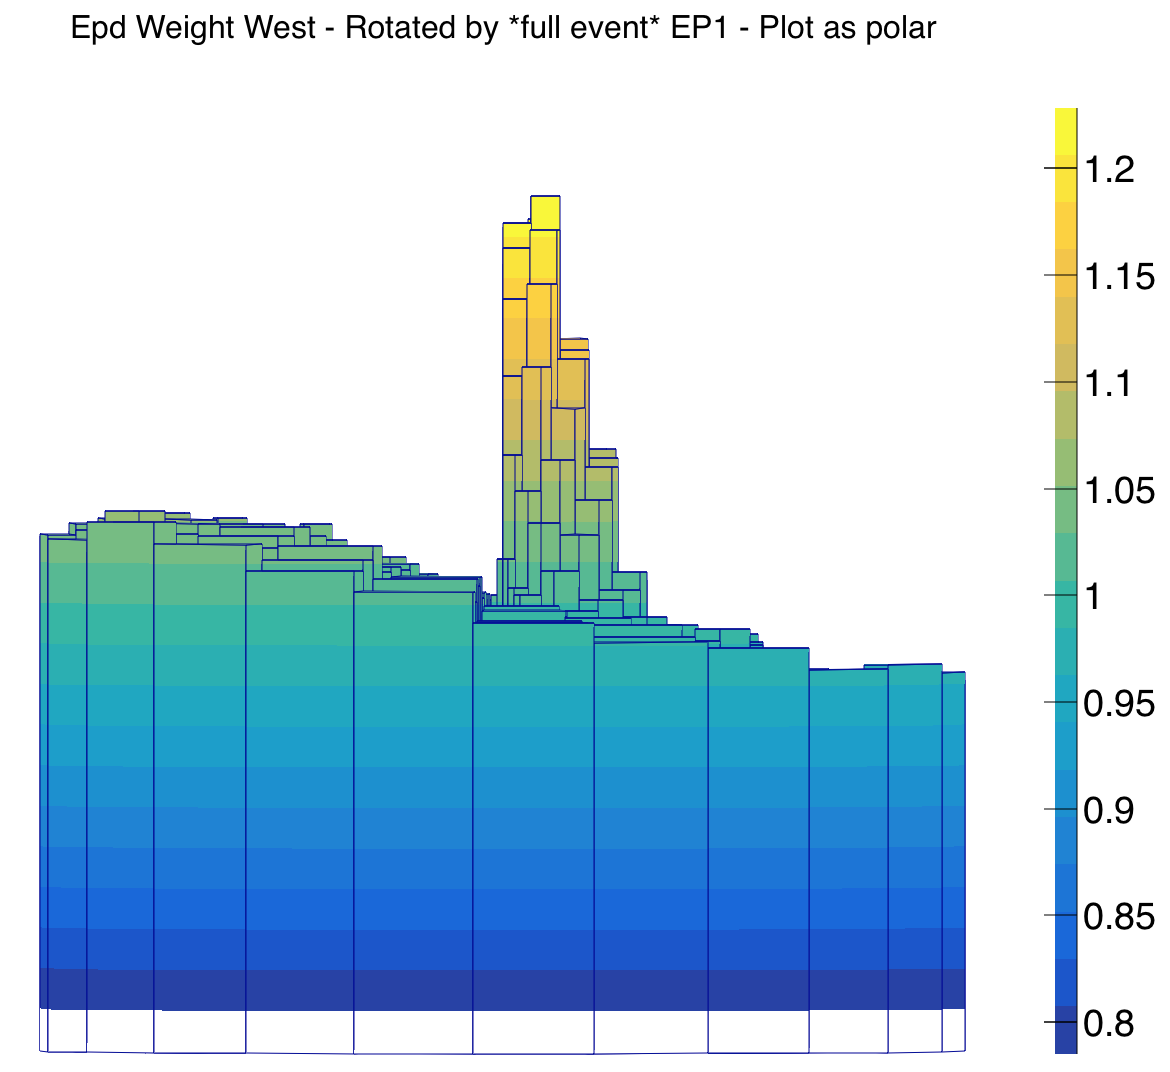
Figure 7 - Same as figure 5, but plotted as lego plots viewed from the side.
Now the flow/antiflow pattern is pretty clear, yes?
Maybe it's even better in Cartesian format:
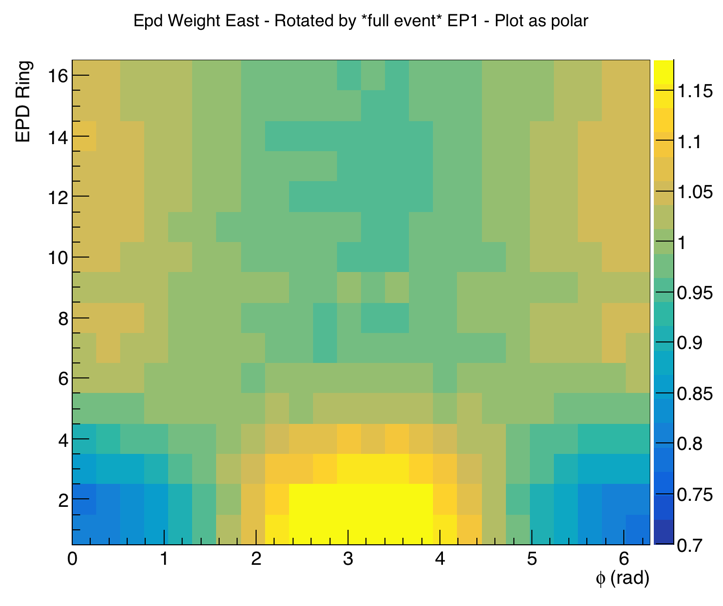
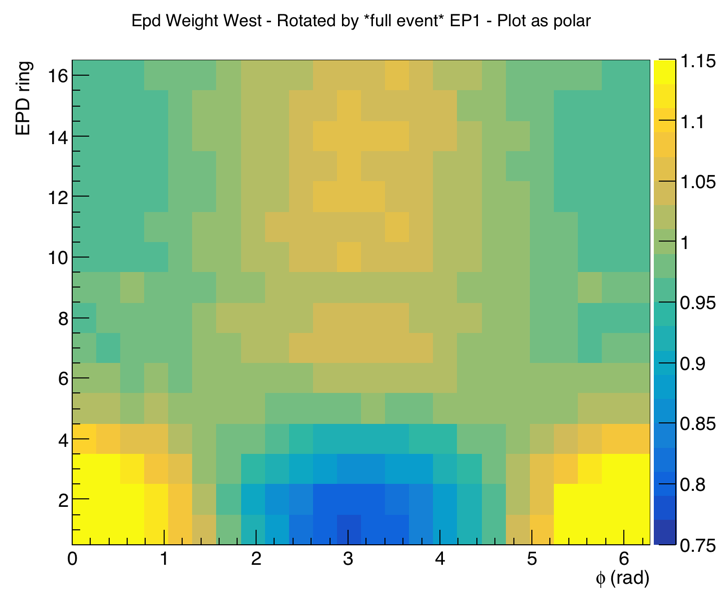
Figure 7.5 - Same as figure 5, but in Cartesian format.
Probably that's the most clear.
Autocorrelation?
But many of you are saying "Hey! That's a little unfair! You show that yields are preferentially to the left and right, but that's because the event-plane determination used information from both EPDs." Okay okay.... It's not as bad as you think, but I get your point... So, in what follows I will show the same as above, except hits from the East EPD will be rotated by the angle found exclusively from the West EPD, and vice versa.
Don't be surprised when the patterns get harder to see. "Just a factor of sqrt(2) change in resolution" is a LOT! That's why we need the EPD...
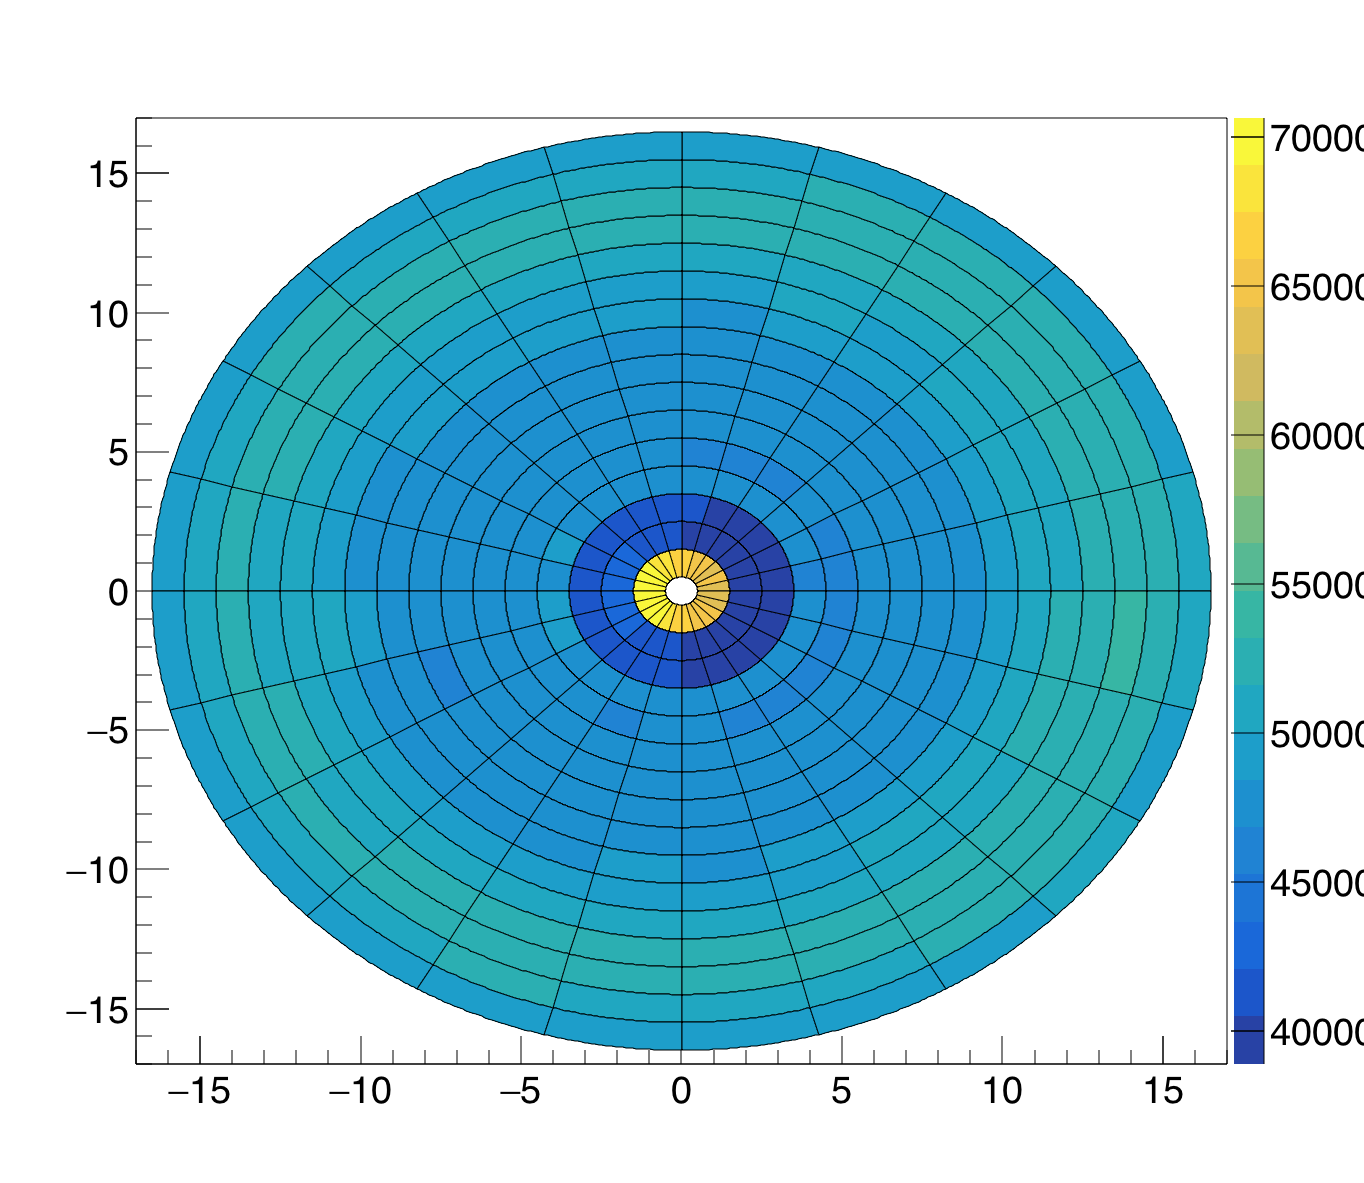
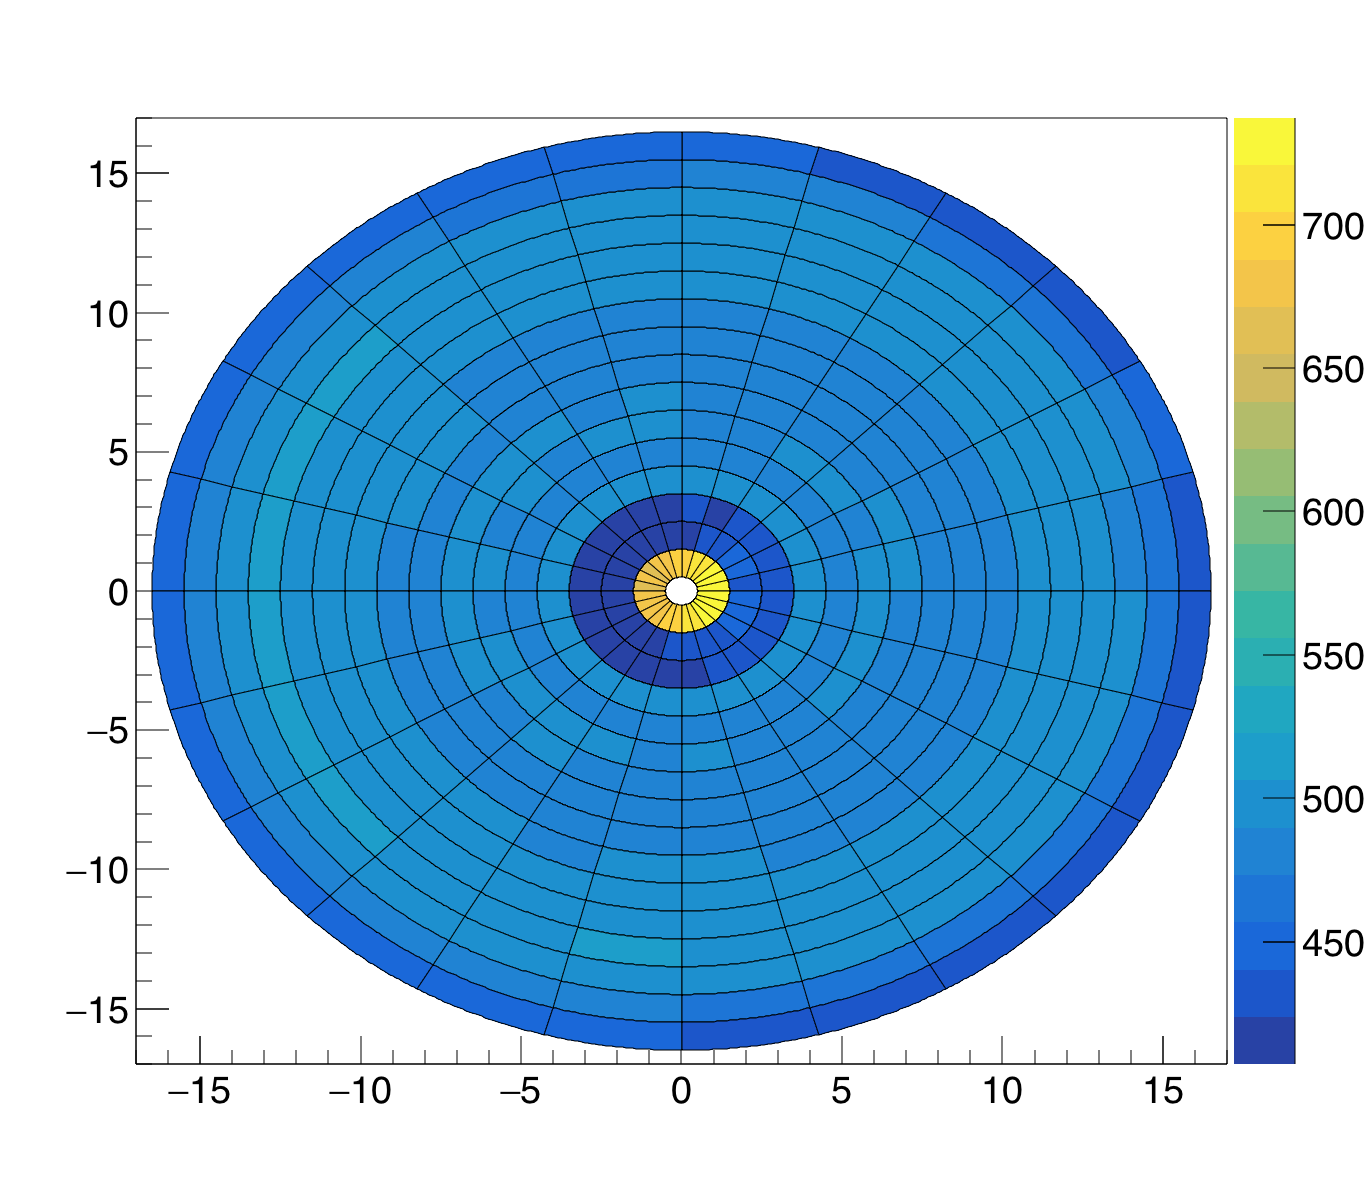
Figure 8 - Same as figure 2, except each EPD wheel is rotated by the angle as determined from the other EPD wheel.
As above, I divide out the radially average distribution, and plot as a lego histogram from the side. The flow and antiflow are pretty clear:

.png)
Figure 9 - Same as figure 7, except each EPD wheel is rotated by the angle as determined from the other EPD wheel.
Finally, we plot this in Cartesian format again. This probably does make it the clearest:
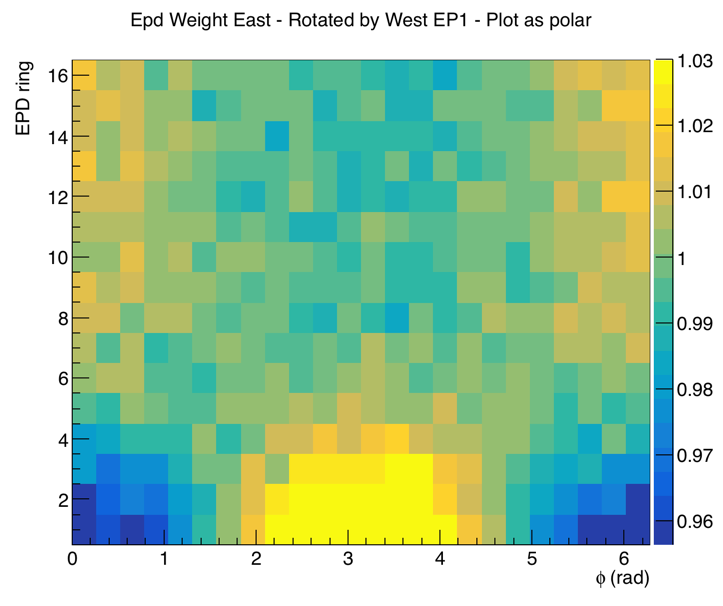
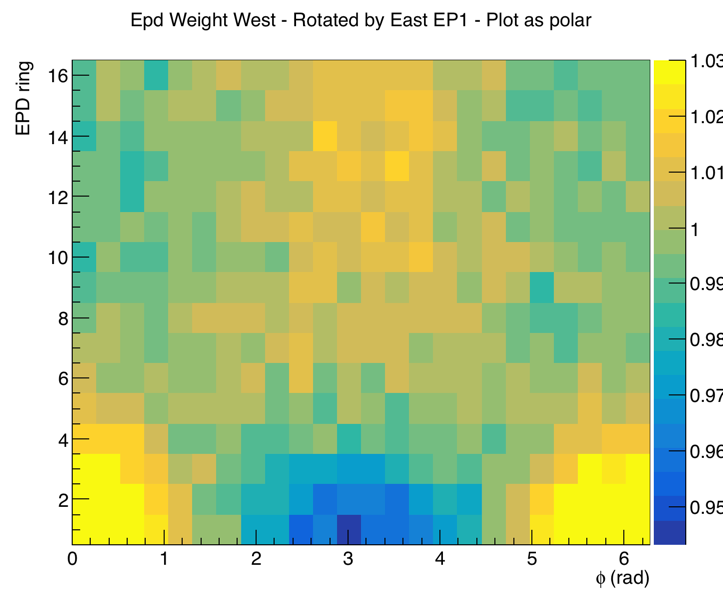
Figure 10 - Same as figure 7.5, but in this case the East EPD hits were rotated by the West EP, and vice versa.
In conclusion, there is no doubt that long-range, eta-antisymmetric flow patterns are visible in East-West EPD distributions. It is interesting (and must be accounted for in analysis) that the sign of the flow changes in the acceptance of our device.
Flow and antiflow patterns can be visualized with the EPD. This post is almost entirely pictures.
The idea for these images was suggested by OSU grad student Andrew Kubera.
I've pointed out that charged particle flow evolves from flow (v1>0) to antiflow (v1<0) within the acceptance of the EPD. Now that we have decent first-order event plane resolution, we can use the EPD to directly see flow and anti-flow patterns.
I focus on Au+Au collisions at 27 GeV, 10-40% centrality, |Vz|<30 cm. For EPD experts, I use MAX=2.0, and the RG16 optimized ringweights.
After phi-weighting, the weight distribution, shown in figure 1 is isotropic for every ring.
When viewing these plots:
- Tile 1-- the innermost tile-- is plotted as two tiles, just for polar binning convenience.
- Note that the +x direction is South. You are looking to the East. Therefore, you are looking "at the face of the East EPD and the back of the West EPD."
Figure 1- East (left) and West (right) EPD wheels, after phi-weighting. The phi-weighting corrects for anisotropies and fluctuations present at the ~5% level. Note the difference in scales: the West EPD shows higher flux for the innermost rings, likely an effect of upstream scattering.
Now we find the "full event" (i.e. using information from both East and West EPD) first-order event plane, and rotate the hits such that Psi[1]=0.0 (i.e. it points South in the STAR Hall).
Figure 2 - East (left) and West (right) EPD wheels. Hits have been rotated such that the full event plane angle points at 0 degrees in STAR Coordinates.
Spectators are at eta~5, so hit the innermost ring. These show positive flow, so, for the inner tiles, the West (z>0) EPD has excess signal at phi=0, and the East (z<0) EPD has excess signal at phi=pi.
A little more subtle is the pattern from the anti-flow of the participants, which hit the outer rings. But it is there, if you look closely. Go ahead, look.
Still hard to see? A more direct way to see it is with a lego plot:
Figure 3 - Same as the right panel of figure 2, except as lego plot, seen from perspective.
Figure 4 - Same as figure 2, except in lego plots from side view.
Well, now it's a little clearer, isn't it?
We can also divide out the radial dependence, by dividing the histograms from figure 2 with those from figure 1. That is below in figure 5:
Figure 5 - Histograms from figure 2 divided by those from figure 1. The positive flow in the inner rings is clear. Careful inspection shows negative flow in the outer rings.
Again I can plot these "normalized" histograms as lego plots. Not entirely clear it helps, but maybe a little:
Figure 6 - Same as right panel of figure 5 except as lego plot from perspective.
Figure 7 - Same as figure 5, but plotted as lego plots viewed from the side.
Now the flow/antiflow pattern is pretty clear, yes?
Maybe it's even better in Cartesian format:
Figure 7.5 - Same as figure 5, but in Cartesian format.
Probably that's the most clear.
Autocorrelation?
But many of you are saying "Hey! That's a little unfair! You show that yields are preferentially to the left and right, but that's because the event-plane determination used information from both EPDs." Okay okay.... It's not as bad as you think, but I get your point... So, in what follows I will show the same as above, except hits from the East EPD will be rotated by the angle found exclusively from the West EPD, and vice versa.
Don't be surprised when the patterns get harder to see. "Just a factor of sqrt(2) change in resolution" is a LOT! That's why we need the EPD...
Figure 8 - Same as figure 2, except each EPD wheel is rotated by the angle as determined from the other EPD wheel.
As above, I divide out the radially average distribution, and plot as a lego histogram from the side. The flow and antiflow are pretty clear:
Figure 9 - Same as figure 7, except each EPD wheel is rotated by the angle as determined from the other EPD wheel.
Finally, we plot this in Cartesian format again. This probably does make it the clearest:
Figure 10 - Same as figure 7.5, but in this case the East EPD hits were rotated by the West EP, and vice versa.
In conclusion, there is no doubt that long-range, eta-antisymmetric flow patterns are visible in East-West EPD distributions. It is interesting (and must be accounted for in analysis) that the sign of the flow changes in the acceptance of our device.
»
- lisa's blog
- Login or register to post comments