Centrality in the EPD - take 2
Some links from earlier studies that would be useful:
drupal.star.bnl.gov/STAR/blog/rjreed/thoughts-centrality-epd
drupal.star.bnl.gov/STAR/blog/rjreed/centrality-and-epd-ii
drupal.star.bnl.gov/STAR/blog/rjreed/centrality-and-epd
I also looked at the effect of Landau fluctuations at: drupal.star.bnl.gov/STAR/system/files/RReedLandauCentrality04082018.pdf
Using the epd fast simulator code developed by Mike, and running over UrQMD 19.6 GeV data I have found:

Figure 1. Left plot - Total final state particles vs impact parameter. Right plot - projections of the left plot using the total number of particles to determine the centrality. The red lines indicate where the centrality bins are in terms of b. I need to check whether this is all particles/charged particles.
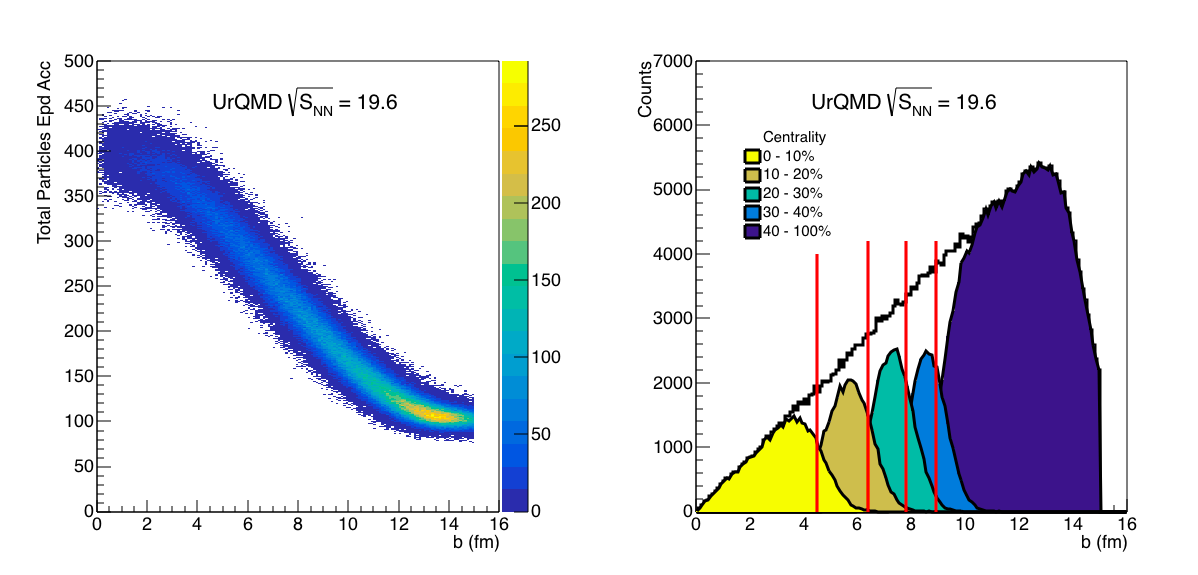
Figure 2: Same as Figure 1, but for particles with 2.1 < |eta| < 5.1.
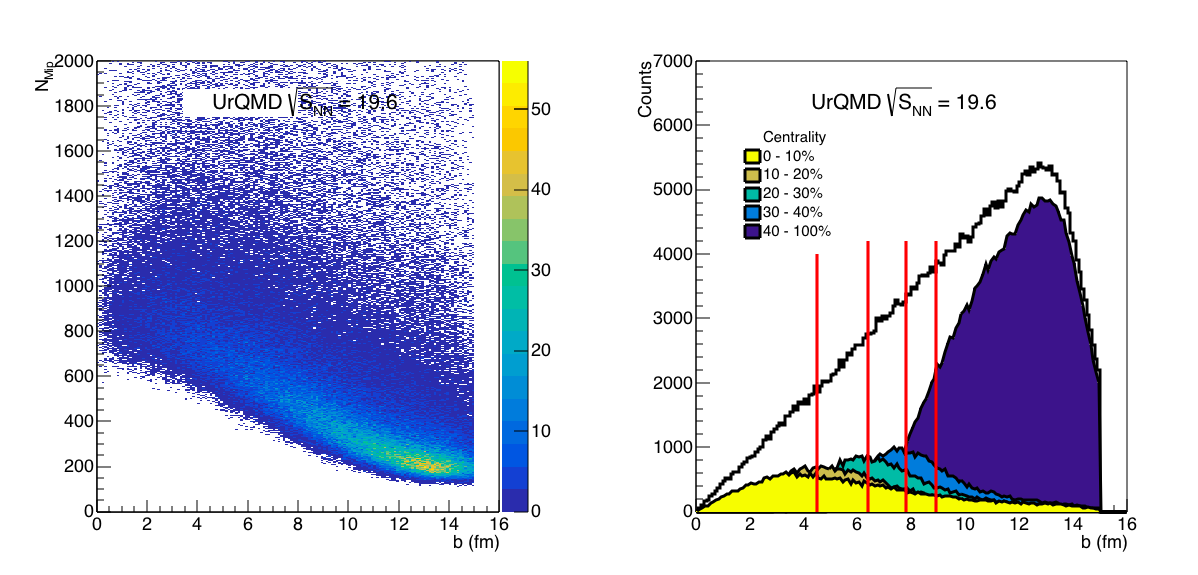
Figure 3: Same as Figures 1 + 2, but the y axis is the Nmip without any truncation. We see here that the landau fluctuations dominate the distribution. The projection on the right plot shows this doesn't have particularly good resolution.
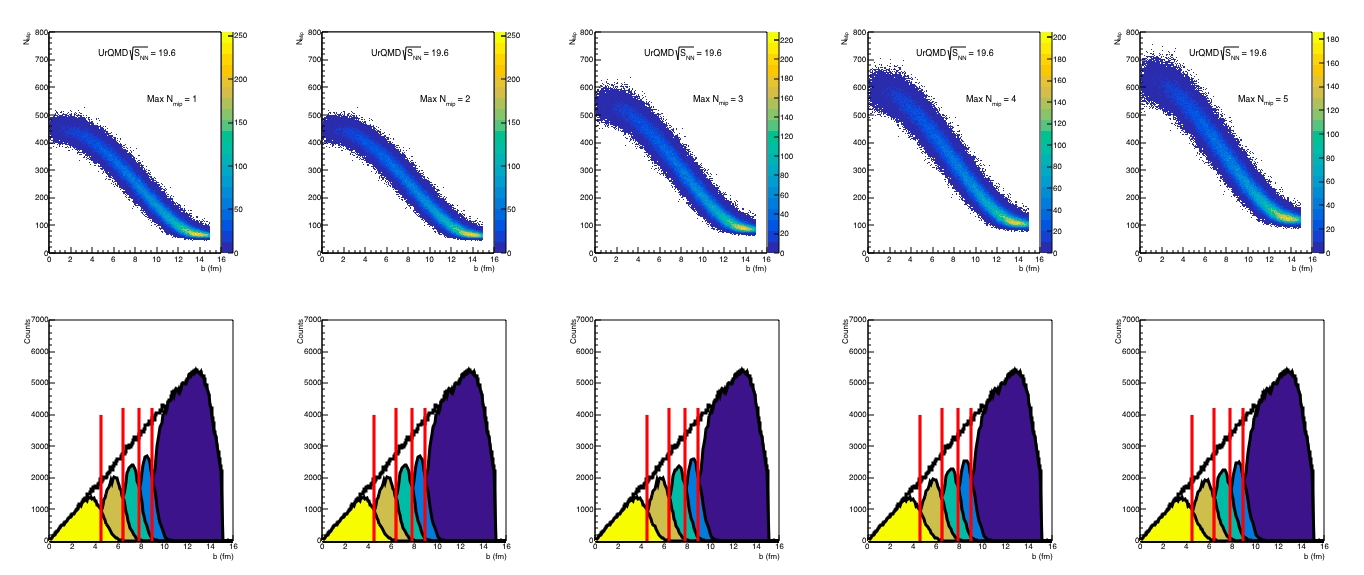
Figure 4: Same figure, but for difference choices in the the truncated Nmip, starting from 1 on the far left and going to 5 on the far right. The distributions look fairly similar.
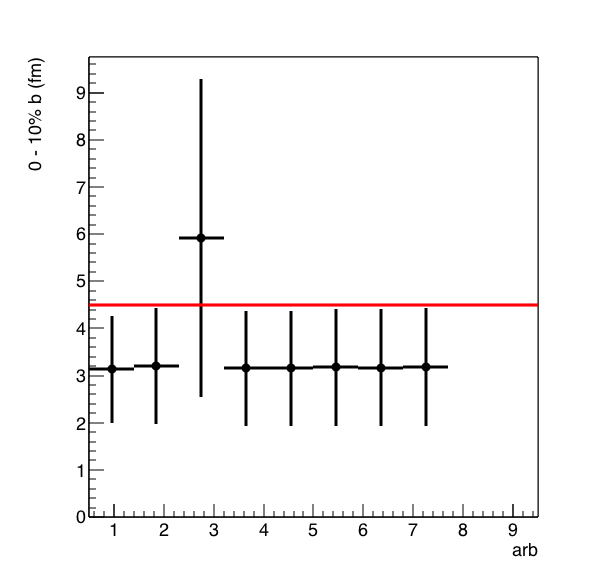
Figure 5: The mean and rms of the 0 - 10% centrality bin for the various test cases above. (1 is all particles, 2 is EPD Acc, 3 is Nmip, the next 5 are the different choices in truncated nmip.
Probably this isn't the best figure of merit - should think about this more.....
- rjreed's blog
- Login or register to post comments