Centrality in the EPD - take 3
Some previous information can be found at: drupal.star.bnl.gov/STAR/blog/rjreed/centrality-epd-take-2
I am using 19.6 GeV UrQMD and ran over 404k events (we have slightly more but my code stopped early). I count as charged particles p+/-, k+/-, p,pbar
The centrality definitions I will consider here are:
The impact parameter
Total Nch
RefMult1 = Nch with |eta|<0.5
RefMult2 = Nch with 0.5 <|eta| < 1.0
RefMult3 = Nch - p/pbar with |eta| < 1.0
FwdAll = Nch with 2.1 < |eta| < 5.1
Fwd1 = Nch with 2.1 < |eta| < 3.0
Fwd2 = Nch with 3.0 < |eta| < 4.0
Fwd3 = Nch with 4.0 < |eta| < 5.0
epd = Nmip with 0.2 threshold, Nmip,max = 2.0
LinearWeight = Linear Weighted sum of epd
LinearWeightParticle = LinearWeighted sum of FwdAll
epdRaw = epd but no maximum Nmip
The linear weights were calculated using the code written by Mike: drupal.star.bnl.gov/STAR/blog/lisa/ring-weights-estimating-global-quantities-linear-sums
Ring Weight Particle (404k events)
ring weight
1 0.143714
2 0.0714922
3 0.00153921
4 0.00375059
5 0.00210493
6 0.00343741
7 0.00229545
8 0.00206779
9 0.000307052
10 0.000557915
11 0.00150237
12 -0.000778207
13 -0.000899352
14 -0.00145341
15 -0.0013782
16 -0.00174739
Ring Weight (404k events)
ring weight
1 0.273525
2 0.0296001
3 -0.0601397
4 -0.0477917
5 -0.0337742
6 -0.0232543
7 -0.0117203
8 -0.00703337
9 -0.0024524
10 0.00399249
11 0.00605742
12 0.00908568
13 0.00985799
14 0.0102809
15 0.013745
16 0.0136804


Figure 1: b distribution divided into centrality bins, left side is linear the right side is log.

Figure 2: Particle Multiplicity - Left shows the 2D correlation with the impact parameter (b), the middle plot shows the b distribution for selection cuts on particle multiplicity, the right shows the particle multiplicity distribution with the centrality cuts.
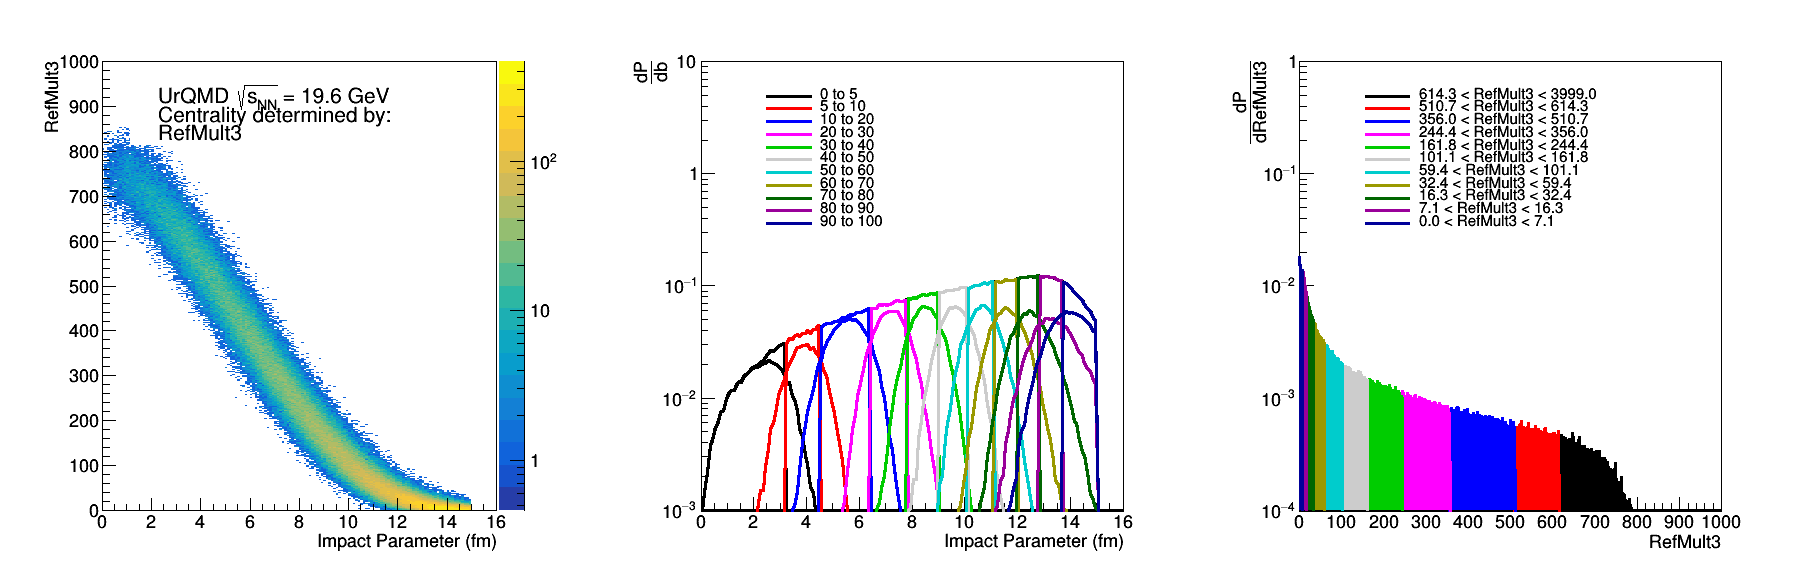
Figure 3: RefMult3 - Same as Fig 2.

Figure 4: RefMult2 - Same as Fig 2.
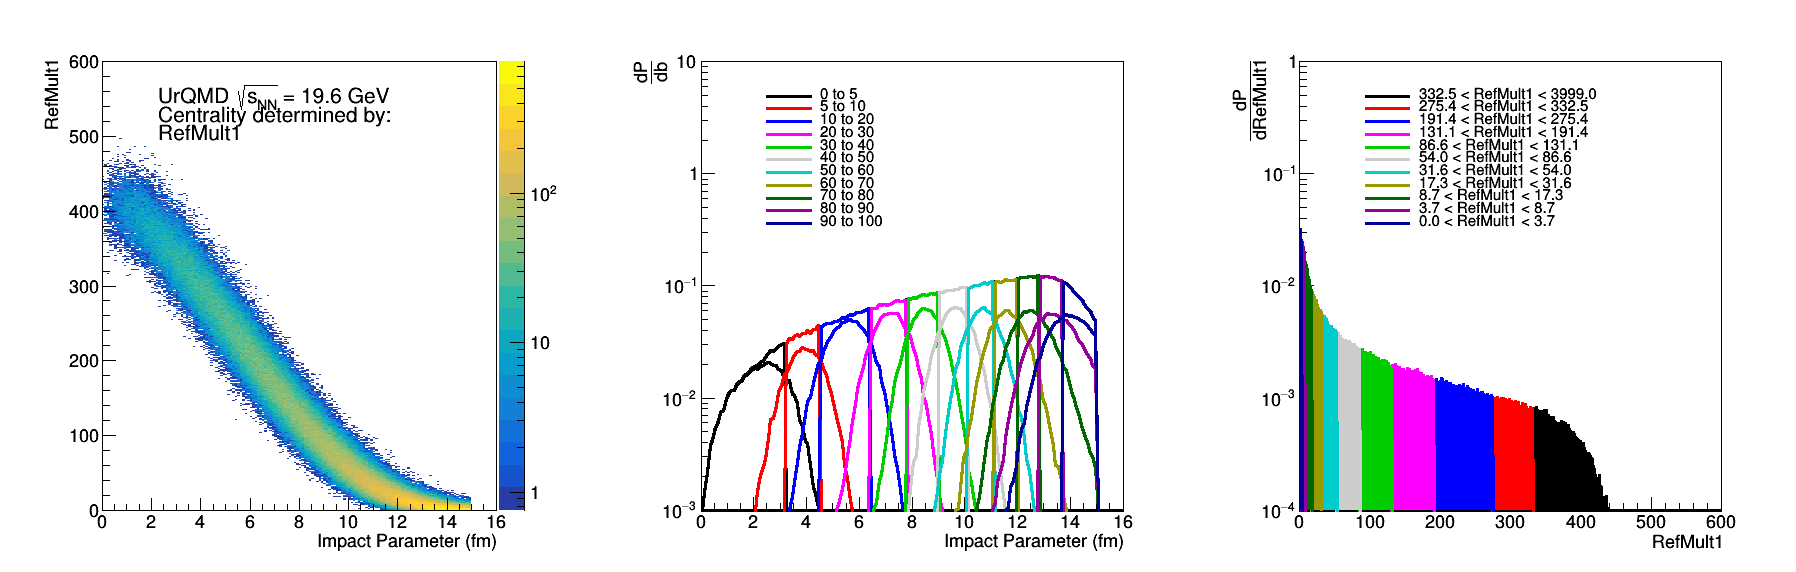
Figure 5: RefMul1 - Same as Fig 2.

Figure 6: FwdAll - Same as Fig 2. It should be noted that this is the particle count within the EPD acceptance.
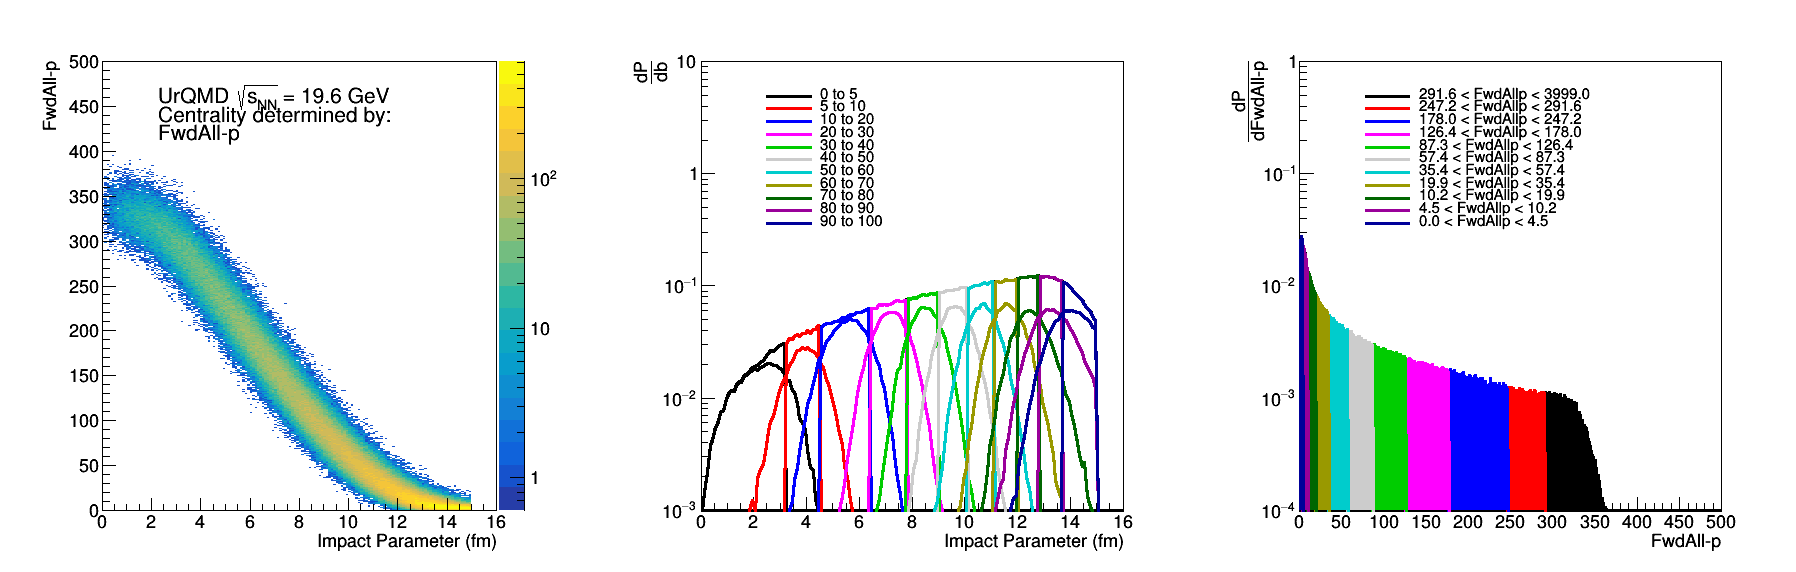
Figure 7: FwdAll-p - Same as Fig 2.

Figure 8:Fwd3 - Same as Fig 2. It should be noted that it is inappropriate to assume that the highest multiplicity events are the most central in this rapidity region, but this was done for comparison sake.
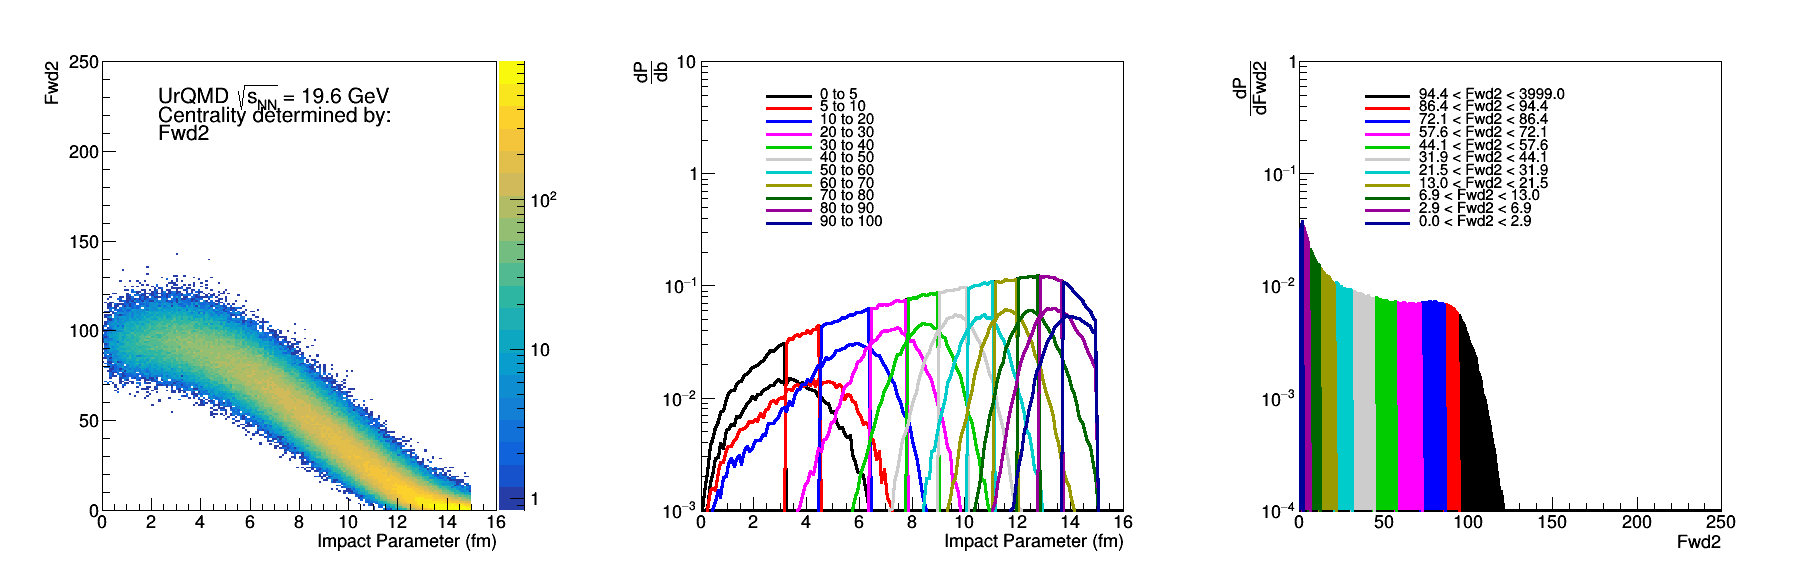
Figure 9: Fwd2 - Same as Fig 2.
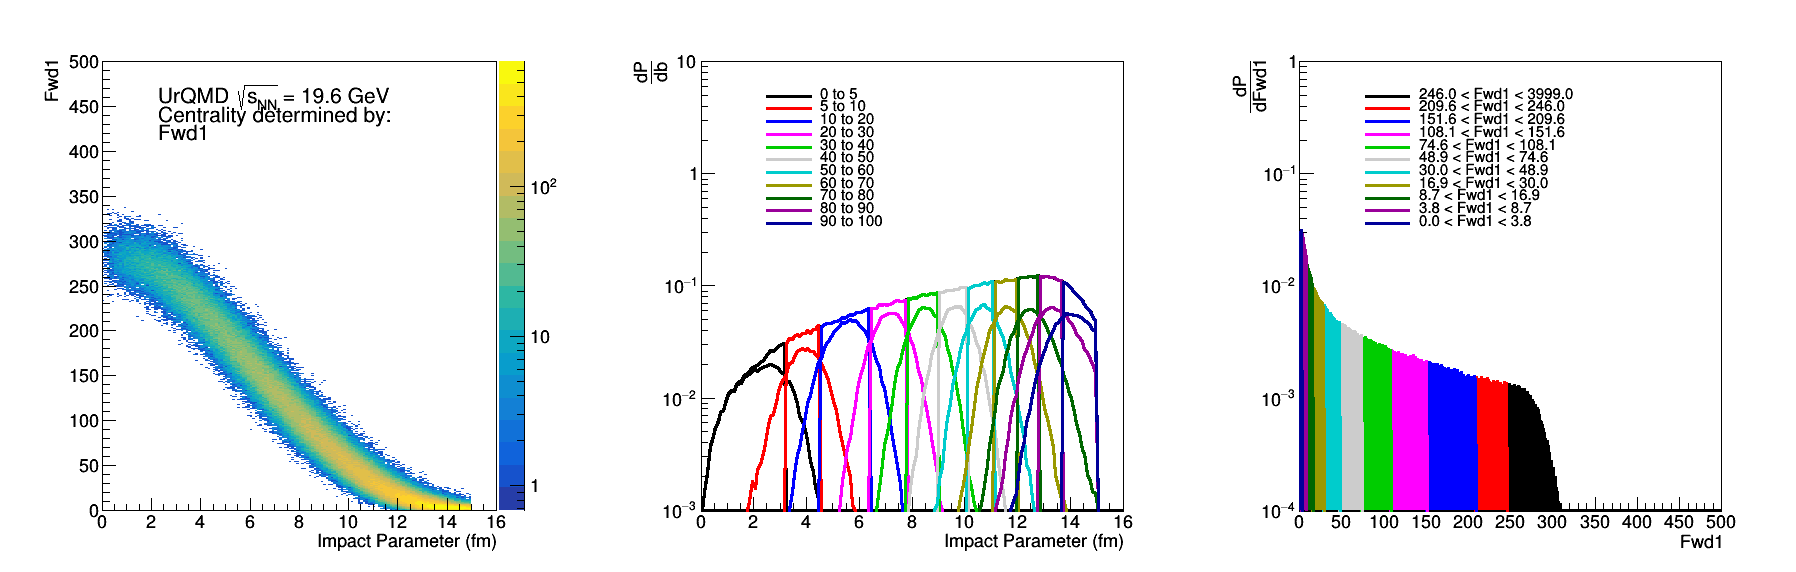
Figure 10: Fwd1 - Same as Fig 2.
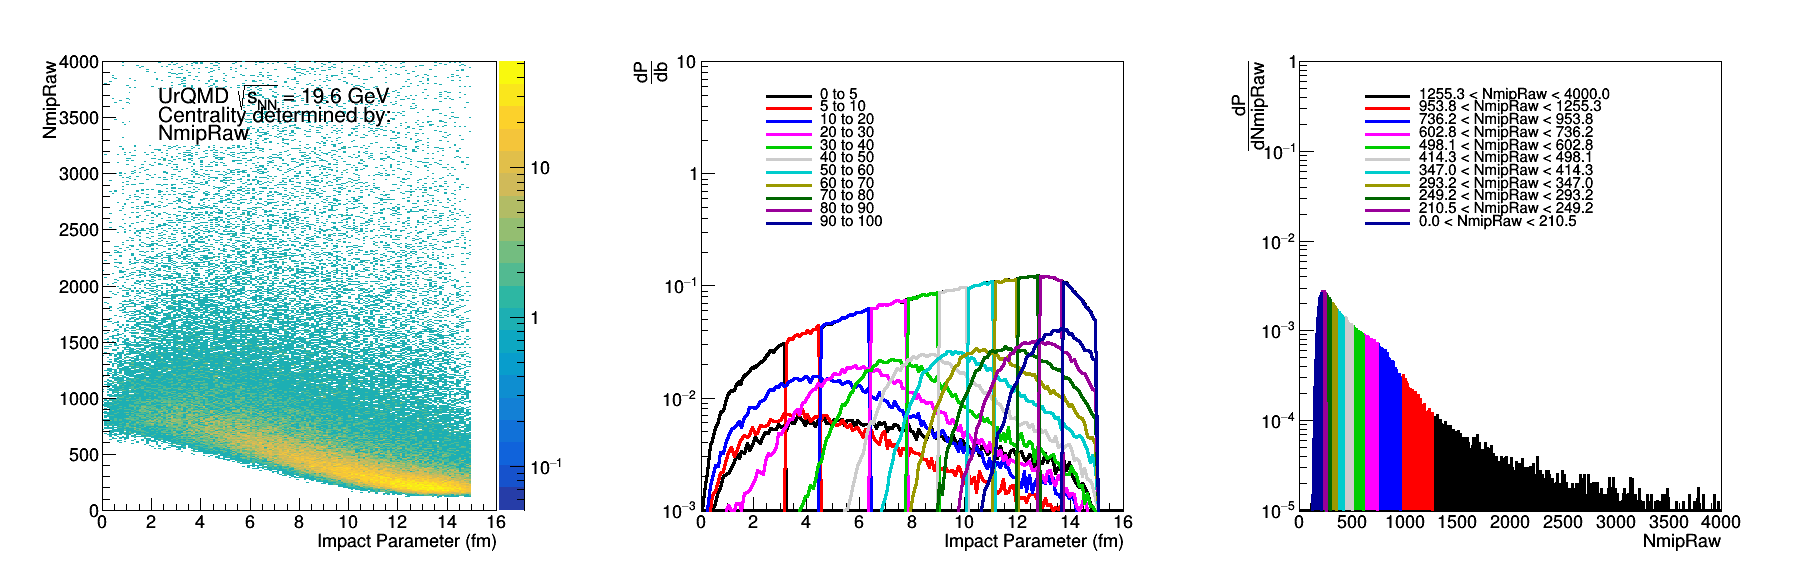
Figure 11: NmipRaw - Same as Fig 2. This was done using the Fast Simulator written by Mike (drupal.star.bnl.gov/STAR/blog/lisa/epd-fast-simulator ). We see that we lose correlation due to the Landua fluctuations.
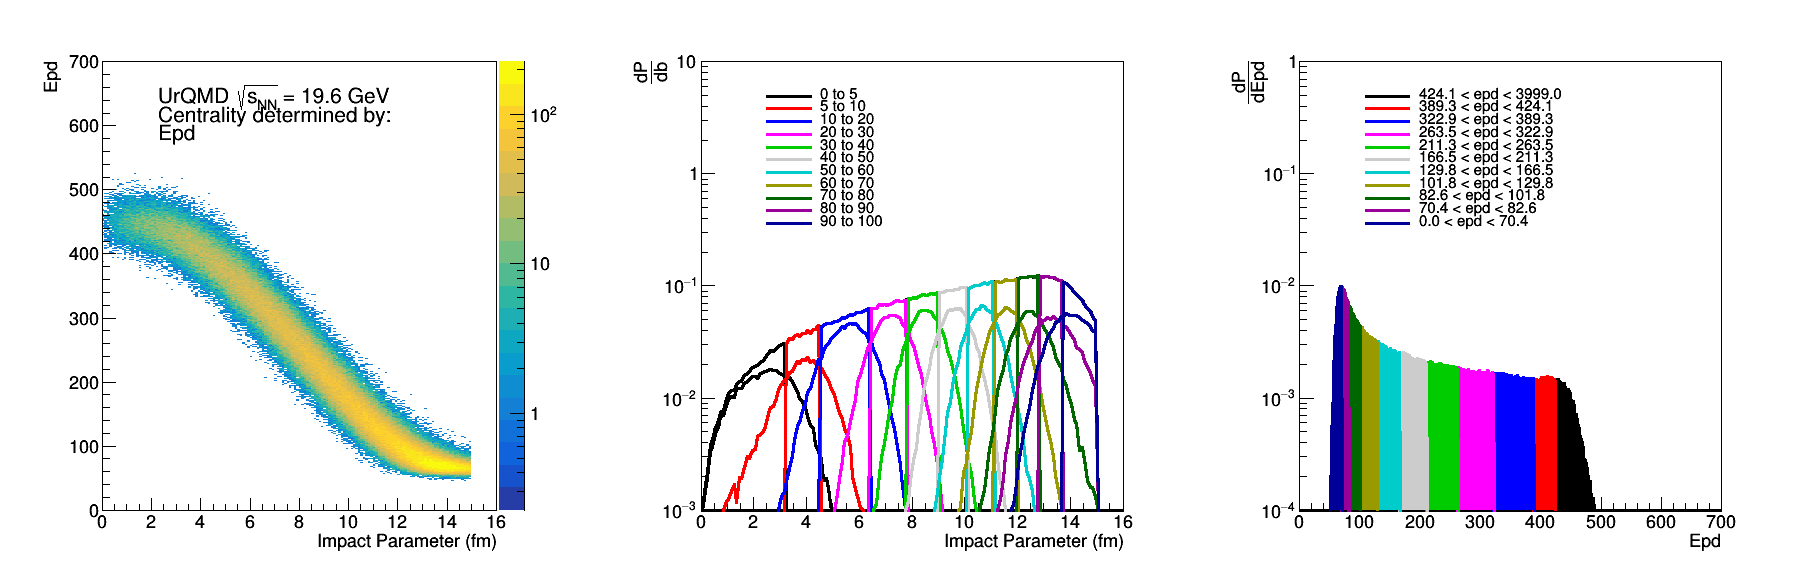
Figure 12: Epd Nmip sum, where 0.2 < Nmip < 2, if Nmip> 2 then Nmip=2. Otherwise same as Fig 2.
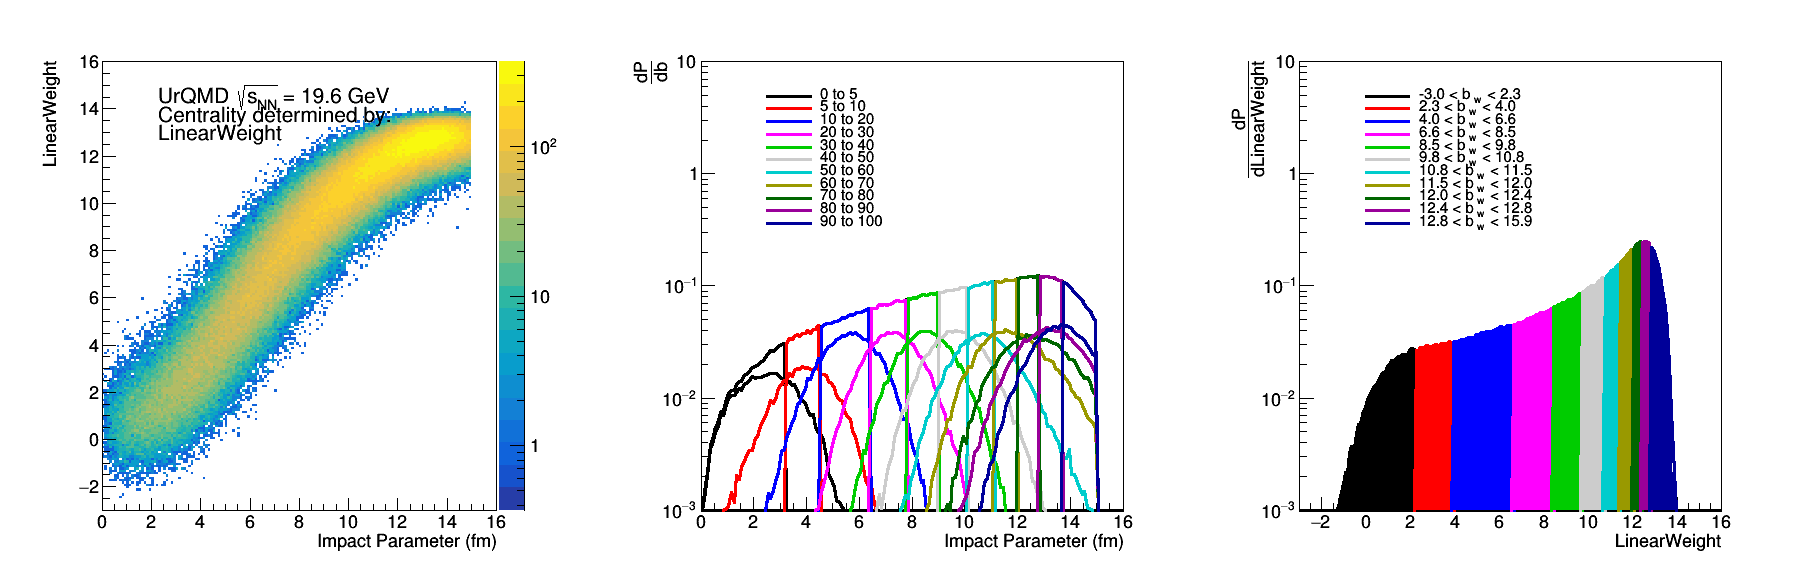
Figure 13: Linear weighted sum of the EPD rings - Same as Fig 2.

Figure 14: Linear weighted sum of the particle count within the EPD rings
Comparing these all by plotting sigma_x^2/sigma_b^2 where x is the observable under question, we find:
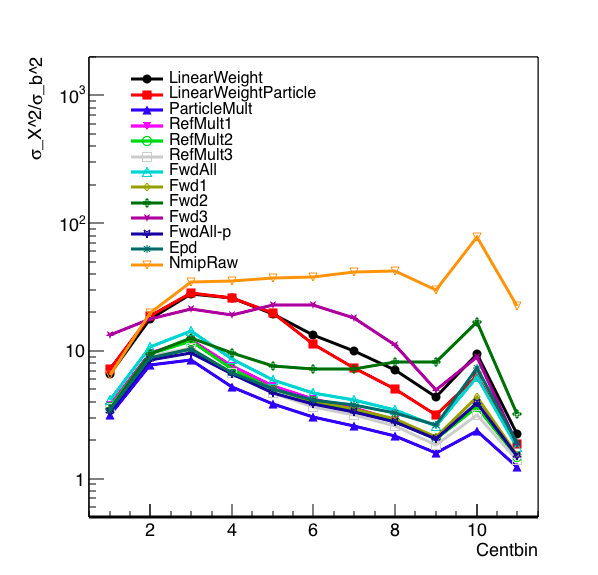
Figure 15: sigma_x^2/sigma_b^2. The centrality bins are the same selection as above, with the right being the central-most points and the left being in the peripheral.
A few things, I note that NmipRaw does a terrible job of correlating with the impact parameter, which is what we expected. Forward All - p does the best - but this is technically unfeasible with the detectors at STAR. All but fwd2,fw3, the linear weights, and the NmipRaw do a reasonable job.
What is surprising here is that the linear weights, both for the particle distributions and for the EPD ring weights do a worse job than simply counting the distributions. The particle linear weight did slightly better than the EPD Nmip linear weight for central events, which makes sense in that we'd expect to do better just counting particles.
- rjreed's blog
- Login or register to post comments