FTPC
Welcome to the  FTPC Homepage
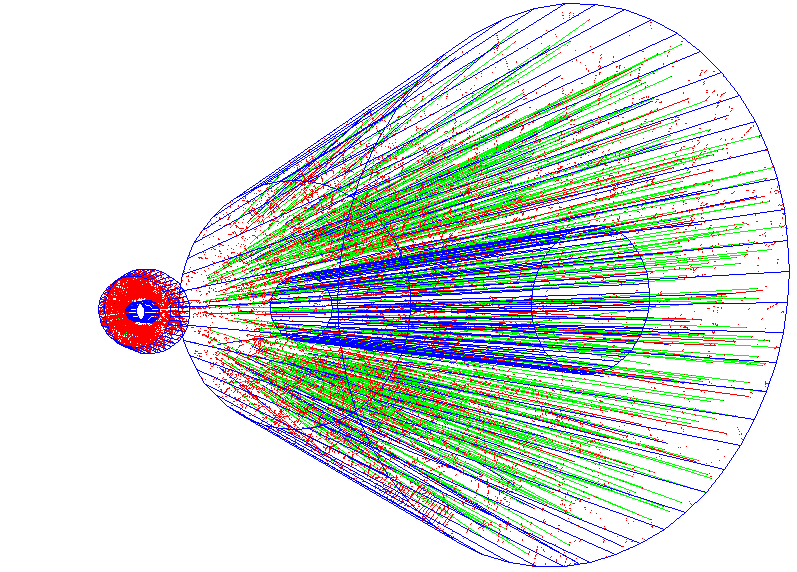
First FTPC Event
Detector Operation - all information necessary to operate FTPCs
Data Quality Assurance
Pad Monitor
Calibrations
Documentation
Software
Hardware
DAQ
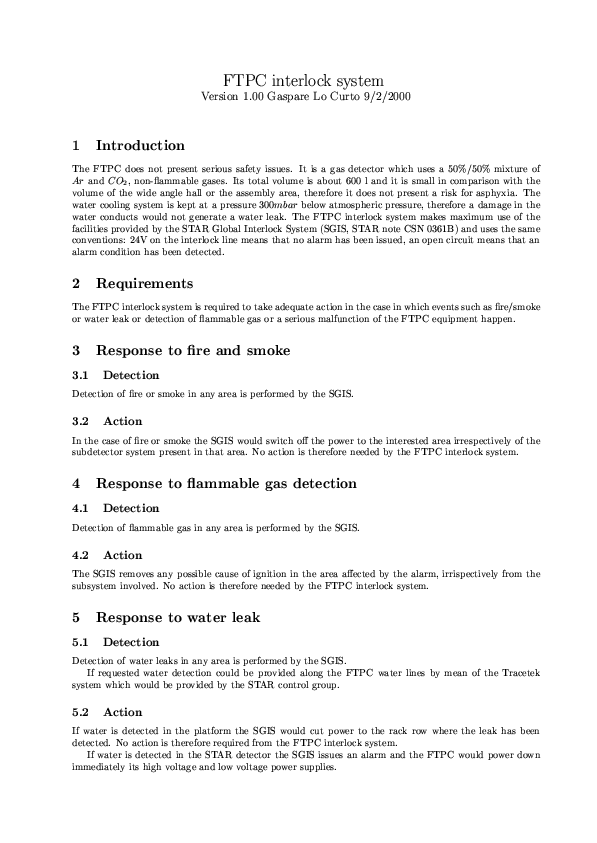
InterlockSystem
SlowControl
Calibrations
FTPC Calibration Home Page
 |
Overview of calibration tasks (v2.2)
FTPC Calibration Run-VIII(dAu)-Procedure
Studies of Embedding in the FTPC for 2008 p+p Runs
Software
Databases
Laser system
Electronics
Coordinate systems
Temperature pressure corrections
Rotation
Simulations
Drift maps
Cathode displacement
protected
FTPC Home Page
DAQ
FTPC DAQ
The FTPC data aquisition system is tied in with the main STAR DAQ. From the receivers onward, all hardware components are identical. The software for the electronics channel mapping is committed to the STAR cvs repository $CVSROOT/online/ftpc/MapFtpcElectronicsToDaq
The signals from the FTPC electronics are sent to DAQ where each
readout board,mezzanine card,asic is mapped to an FTPC sector,daqrow,daqpad.

HARDWARE:

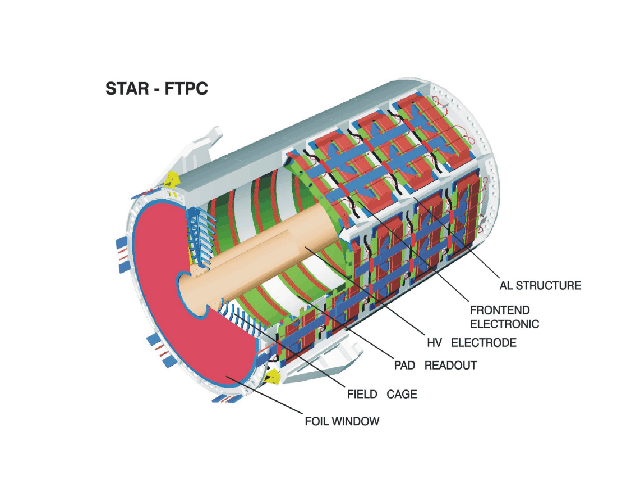
       2 identical FTPCs - Ftpc West = 1, Ftpc East = 2
       5 rings/FTPC
       2 padrows/ring
      10 padrows/FTPC
       6 sectors/padrow
     6 sectors/padrow x 10 padrows/FTPC = 60 hardware sectors/FTPC
     160 pads/sector
    9600 pads/padrow
  = 19200 electronics channels for both FTPCs

ELECTRONICS:
      20 readout boards (RDOs)
      10 RDOs/FTPC
       3 mezzanine cards/RDO
  =   3 mezzaanine cards/RDO x 10 RDOs/FTPC = 30 electronic sectors/FTPC

DAQ:
    The signals from the FTPC electronics are mapped to the hardware with the FTPC_PADKEY.h file.

   DAQ notation:
             30 daqsectors/FTPC (Ftpc West 1-30, FtpcEast 31-60)
              2 daqrows/daqsector
            320 daqpads/daqsector = 2 x 160 daqpads/daqrow

     Ftpc  Ring   Padrow  Sector   daqrow  daqpads
      1      1      1,2    1,7       1,2    1-160
                           2,8       1,2  161-320
                           3,9       1,2  321-480
                           4,10      1,2  481-640
                           5,11      1,2  641-800
                           6,12      1,2  801-960
             2      3,4   13,19      1,2    1-160
                          14,20      1,2  161-320
                          15,21      1,2  321-480
                          16,22      1,2  481-640
                          17,23      1,2  641-800
                          18,24      1,2  801-960
             3      5,6   25,31      1,2    1-160
                          26,32      1,2  161-320
                          27,33      1,2  321-480
                          28,34      1,2  481-640
                          29,35      1,2  641-800
                          30,36      1,2  801-960
             4      7,8   37,43      1,2    1-160
                          38,44      1,2  161-320
                          39,45      1,2  321-480
                          40,46      1,2  481-640
                          41,47      1,2  641-800
                          42,48      1,2  801-960
             5      9,10  49,55      1,2    1-160
                          50,56      1,2  161-320
                          51,57      1,2  321-480
                          52,58      1,2  481-640
                          53,59      1,2  641-800
                          54,60      1,2  801-960
      2      1      1,2    6,12      1,2    1-160
                           5,11      1,2  161-320
                           4,10      1,2  321-480
                           3,9       1,2  481-640
                           2,8       1,2  641-800
                           1,7       1,2  801-960
             2      3,4   18,24      1,2    1-160
                          17,23      1,2  161-320
                          16,22      1,2  321-480
                          15,21      1,2  481-640
                          14,20      1,2  641-800
                          13,19      1,2  801-960
             3      5,6   30,36      1,2    1-160
                          29,35      1,2  161-320
                          28,34      1,2  321-480
                          27,33      1,2  481-640
                          26,32      1,2  641-800
                          35,31      1,2  801-960
             4      7,8   42,48      1,2    1-160
                          41,47      1,2  161-320
                          40,46      1,2  321-480
                          39,45      1,2  481-640
                          38,44      1,2  641-800
                          37,43      1,2  801-960
             5      9,10  54,60      1,2    1-160
                          53,59      1,2  161-320
                          52,58      1,2  321-480
                          51,57      1,2  481-640
                          50,56      1,2  641-800
                          49,55      1,2  801-960
Data Quality Assurance
FTPC Data Quality Assurance and Quality Control
FTPC Data Quality Assurance and Quality Control
During data taking it is very important to monitor the quality of the data being taken. This should be done at least once a day and whenever the FTPC has been turned back on.
- Online histograms - "Panitkin Plots"
- FTPC Fast Offline QA histograms
- FTPC temperature readings - check if the FTPC temperature readings are in the Slow Control Archive. There should be readings for both Ftpc body (West 6 readings, East 6 readings) and Ftpc extra (West 6 readings, East 7 readings) temperatures. It is especially important to check these after the FEEs have been turned off; there is a non-negligible possibility that the body temperature readings for FTPC East do not come up again. If this is the case, call an expert.
Fast Offline QA Histograms
FTPC Fast Offline Histograms
- Use the Offline Automated QA Browser to fetch the latest set of Fast Offline or DST production jobs.
- Compare the "General Hists" and the "Multiplicity Class Hists" to the appropriate set of FTPC reference histograms:
Online histograms - "Panitkin Plots"
During a run, online histograms are collected for each sub-system. The online histograms give the first indication of detector hardware problems. Therefore it is extremely important to check these histograms in the control room on evp.starp.bnl.gov at the end of each run. They should also be saved so that they are available for future viewing via the RunLog Browser.
A histogram description has 9 arguments:
1 for 1-D, 2 for 2-D histo
histogram name
histogram title
number of bins x-axis
lower bound x-axis
upper bound x-axis
0 for 1-D histos, number of bins y-axis for 2-D histos
0 for 1-D histos, lower bound y-axis for 2-D histos
0 for 1-D histos, upper bound y-axis for 2-D histos
The following histograms are collected for the FTPC (they are on pages 25-27 up until January 3, 2008 when BEMC histograms were added. The FTPC histograms moved to pages 30-32 starting with run 9003070):
Please inform the FTPC group if you observe large scale changes in any of the FTPC histograms.
The plots on page numbers 26 and 27/ pages 31 and 32 starting with run 9003070 are the most important. They must be checked for every run.
Currently the sample histograms shown below are for the dAu 2007 Run 8340066 - page 6: FTPC event size on a log10 scale
Contains the event size histograms for TPC, BEMC, FTPC, L3, SVT and TOF
Args: 1,h11_ftp_evsize,log of FTPC Buffer Size,50,0.,10.,0,0,0
- page 7: FTPC fraction of total event in %
Contains the event size fraction histograms for TPC, BEMC, FTPC, L3, SVT and TOF
Args: 1,h105_ftp_frac,FTP Event Size Fraction (%),50,0.,100.,0,0,0
- page 8: FTPC event size on a log10 scale for the last 2 minutes
Contains the event size vs time histograms for the TPC and FTPC
Args: 2,h337_ftp_time_size_2min,FTPC Event Size vs time(sec),600,0.,600.,80,0.,8.
- page 25/page 30:
% of FTPC occupied channels
Args: 1,h49_ftp,FTPC Occupancy (in %),100,0.,100.,0,0,0
FTPC event size on a log10 scale
Args: 1,h11_ftp_evsize,log of FTPC Buffer Size,50,0.,10.,0,0,0
% of FTPC occupied channels for laser runs
Args: 1,h51_ftp_OccLaser,FTPC Occupancy (in %) Lasers,100,0.,100.,0,0,0
Total charge in FTPC on log10 scale
Args: 1,h48_ftp,log of Total FTPC Charge,30,0.,6.,0,0,0
% of FTPC occupied channels for pulser runs
Args: 1,h50_ftp_OccPulser,FTPC Occupancy (in %) Pulsers,100,0.,100.,0,0,0 - page 26/page 31: FTPC chargestep histograms
Args: 1,h109_ftp_west_time,FTPC West timebins,256,-0.5,255.5,0,0,0
Args: 1,h110_ftp_east_time,FTPC East timebins,256,-0.5,255.5,0,0,0
The chargestep corresponds to the maximum drift time in the FTPC (clusters from inner radius
electrode) and is located near 170 timebins. This position will change slightly with atmospheric
pressure. The other features of these plots are due to electronic noise and pile-up background.
If there is no step visible near 170, something is wrong. Please contact an FTPC expert.
- page 27/page 32:
Args: 2,h338_ftp_west,FTPC West pad charge: pad vs row,10,0.,10.,960,0.,960.
Args: 2,h339_ftp_east,FTPC East pad charge: pad vs row,10,0.,10.,960,0.,960.
Red areas = hot FTPC electronics
White areas = dead FTPC electronics
Always check these 2 plots in the first run after an FTPC trip. If new red or white areas show up,
first check the FTPC anode voltages. If the anode voltage readings are correct, please contact
an FTPC expert.
On December 17, 2007, Alexei masked out RDO 10 East. On page 27/32 RDO 10 East is now a white area.
Contains the event size histograms for TPC, BEMC, FTPC, L3, SVT and TOF
Args: 1,h11_ftp_evsize,log of FTPC Buffer Size,50,0.,10.,0,0,0
Contains the event size fraction histograms for TPC, BEMC, FTPC, L3, SVT and TOF
Args: 1,h105_ftp_frac,FTP Event Size Fraction (%),50,0.,100.,0,0,0
Contains the event size vs time histograms for the TPC and FTPC
Args: 2,h337_ftp_time_size_2min,FTPC Event Size vs time(sec),600,0.,600.,80,0.,8.
% of FTPC occupied channels
Args: 1,h49_ftp,FTPC Occupancy (in %),100,0.,100.,0,0,0
FTPC event size on a log10 scale
Args: 1,h11_ftp_evsize,log of FTPC Buffer Size,50,0.,10.,0,0,0
% of FTPC occupied channels for laser runs
Args: 1,h51_ftp_OccLaser,FTPC Occupancy (in %) Lasers,100,0.,100.,0,0,0
Total charge in FTPC on log10 scale
Args: 1,h48_ftp,log of Total FTPC Charge,30,0.,6.,0,0,0
% of FTPC occupied channels for pulser runs
Args: 1,h50_ftp_OccPulser,FTPC Occupancy (in %) Pulsers,100,0.,100.,0,0,0
Args: 1,h109_ftp_west_time,FTPC West timebins,256,-0.5,255.5,0,0,0
Args: 1,h110_ftp_east_time,FTPC East timebins,256,-0.5,255.5,0,0,0
The chargestep corresponds to the maximum drift time in the FTPC (clusters from inner radius
electrode) and is located near 170 timebins. This position will change slightly with atmospheric
pressure. The other features of these plots are due to electronic noise and pile-up background.
If there is no step visible near 170, something is wrong. Please contact an FTPC expert.
Args: 2,h338_ftp_west,FTPC West pad charge: pad vs row,10,0.,10.,960,0.,960.
Args: 2,h339_ftp_east,FTPC East pad charge: pad vs row,10,0.,10.,960,0.,960.
Red areas = hot FTPC electronics
White areas = dead FTPC electronics
Always check these 2 plots in the first run after an FTPC trip. If new red or white areas show up,
first check the FTPC anode voltages. If the anode voltage readings are correct, please contact
an FTPC expert.
On December 17, 2007, Alexei masked out RDO 10 East. On page 27/32 RDO 10 East is now a white area.
Slow Control Archive
FTPC Slow Control Archives
Archive for Run 2001-2002
Archive for Run 2003
Archives for Run 2004:
2004-01-01 -> 2004-01-24 Always use this for TPC readings:Pressure,Temperature,Dew Point,Humidity
2004-01-27 -> Present the archives were ONLY split for FTPC
Archive for Run 2005-2007
Detector Operation
FTPC expert(s) currently on call:
Alexei Lebedev alebedev@bnl.gov Phone: 3101 Cell phone: 631 255 4977
TO ALL DETECTOR OPERATORS:
Please remember to place the FTPC into "Physics" mode and verify anode voltages (1800 W, 1800 E) after taking pedestals.
In case of an FTPC alarm,please check the "Temperature-Pressure" window - if ALL readings in FTPC East and/or West = 0, call Alexei.
In case of an anode trip, please enter the time the trip occurred and which FTPC and sector tripped into the FTPC log book.
Y2004 Standard set points
- Detector always ON
Change configuration to operate in different modes or to set the detector to rest waiting for beam
Set the system in ``Magnet ramp'' configuration ONLY when the magnet is ramping
ALWAYS!!!!!! verify Anode Voltages = voltages for selected run mode !!!
| Voltage Settings | |
| Cathode voltage (2 channels) | -10kV±5V |
| Anode voltage (2x6 channels), Physics | +1800V ±2V West, +1800V ±2V East |
| Anode voltage (2x6 channels), laser | +1200V±2V West, +1200V±2V East |
| Anode voltage (2x6 channels), pedestals | +1000V±2V West, +1000V±2V East |
| Anode voltage (2x6 channels), stand by | 0V West/East, (+~15V are displayed) |
| Gating grid (2x4 channels) | -76V±2V open, -76V±115V closed |
| Y2007/2008 Standard Values | |
| Water pressure in (West/East) | -400mbar -> -100mbar |
| Water temperature (West/East) | <31 C |
| O2(ppm) (West/East) | <10ppm |
| H2O (dp C) Westt/East) | <-50 C dp |
| Ar flow = CO2 flow (West/East) | 72l/h->78l/h; West=East |
| Cathode current | 0.14mA |
| Anode current | -15nA < I < 15nA |
For more information, please consult:
 FTPC Operations Manual
 FTPC Shift Checklist
 FTPC Run School
Documentation
FTPC Documentation
Hardware
FTPC Hardware
InterlockSystem
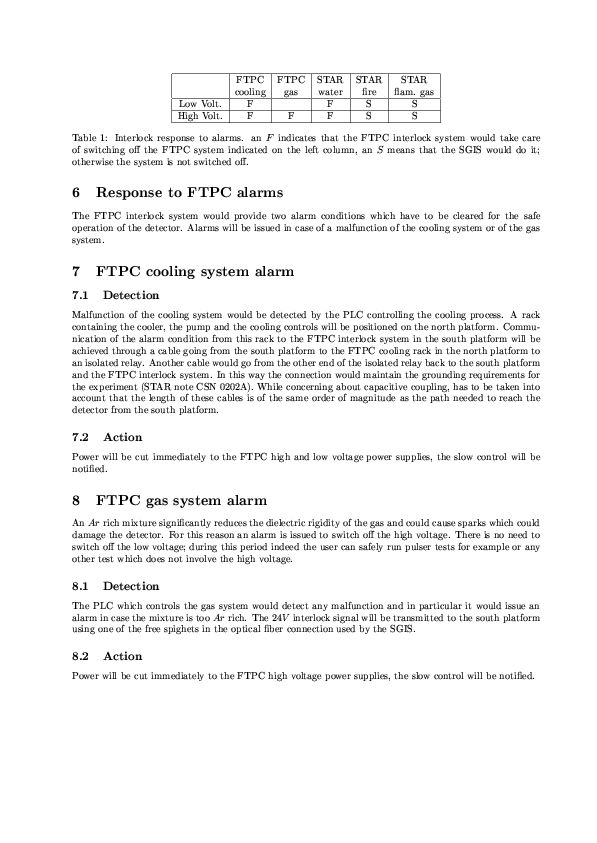
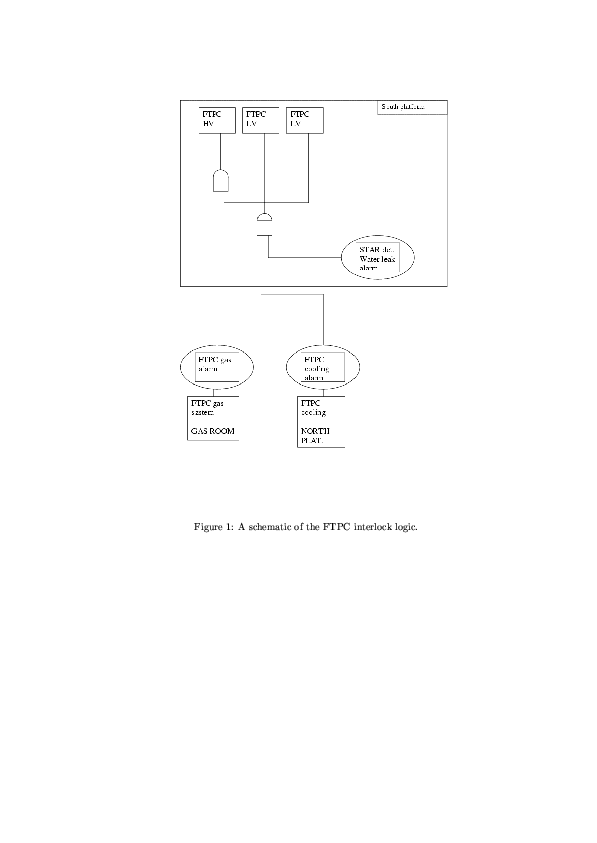
Pad Monitor
FTPC Pad Monitor
The pad monitor we use was developed by Andreas Schuettauf. It is referred to as the Munich Pad Monitor. (The FTPC pad monitor development was started by Jennifer Klay in Davis. Her documentation contains alot of useful information. Unfortunately, Jennifer left STAR before she finished the pad monitor.)
- How to run the Munich Pad Monitor
- sample Munich Pad Monitor screen
- hardware sector notation (receiver boards)
- hardware sector notation (lasers)
documentation
FTPC PadMonitor Project
Welcome! You have found the webpage dedicated to providing information and documentation on the FTPC PadMonitor. The FTPCs (Forward Time Projection Chamber) are a key sub-system of the STAR Experiment at RHIC. The PadMonitor is a software program designed to allow for monitoring of FTPC performance. The program can be separated into two basic parts: the GUI (Graphical User Interface) and the data I/O interface. The GUI has been designed using Java with the data I/O interface provided by the Java Native Interface to C and C++ code. This choice of languages reflects the desire to marry cross-platform transportability with legacy code already written for STAR DAQ data. In addition, we hope to be able to run the PadMonitor as a Servlet or Javascript from the Web, allowing collaborators access to view detector performance or issue trigger commands from a distance.
Raw Data Format
STAR DAQ Links
STAR DAQ Home Page This is the local working home page for the DAQ Group. Specific links of interest on this site include:
FTPC Raw Data Format
Main TPC
24 Sectors-each one handled by a single VME crate
Each VME crate contains 6 receiver boards and one "Sector Broker" (to handle global sector characteristics and communication)
Each receiver board contains 3 mezzanine boards which buffer the data and host the STAR Cluster Finding ASICs (pedestal subtraction,gain correction, 10bit->8bit data conversion, 2D cluster finding)
To reconstruct a single sector's data, one must gather:
From each of six receiver boards, the contributions from all three mezzanine boards
384 pads per sector
45 padrows per sector
Number of pads per padrow variable (due to wedge-shape of sectors)
512 timebins per pad
Forward TPCs
2 Chambers-each one handled by a single VME Crate
Each crate contains 10 receiver boards and one "Chamber Broker" (performs the same functions as the Sector Broker but for a single FTPC Chamber)
Each receiver board handles three FTPC Sectors (30 sectors per chamber)
Each receiver board has 3 mezzanine boards. The simplest sector->mezzanine mapping is 1:1, but may not necessarily be so. In order to be general, the pointer structure is set up such that from the receiver board, one points to a sector and from the sector one points to the mezzanine board.
To reconstruct a single sector's data, one must gather:
From one receiver board, the sector via contribution from one mezzanine board
30 sectors per chamber
320 pads per sector
2 padrows per sector
160 pads per padrow
512 timebins per pad
Ideally, one would like to hide this heirarchy behind a simpler user interface. This has been done by making the FTPC Format Reader very similar to the main TPC. Users request data from a specific sector, numbered 1 to 60 (1-30 for West FTPC, 31-60 for East FTPC). The user numbering scheme follows the FTPC Cabling design drawings. The mapping to correct receiver board and mezzanine contributions for a given sector is provided by a header file included with the Format Reader.
FTPC Raw Data Format Document (postscript)
DAQ/Data Schematics
View some schematic pictures of the DAQ design and the current Raw Data Format:
The following is a diagramatical sketch of the information path explained in the DAQ Raw Data Format Document.
SlowControl
FTPC Slow Control
- FTPC Slow Control documentation FTPC related slow control and interlock documentation
- FTPC slow control schematics
- FTPC slow control screens
- FTPC Slow Control Monitor List and/or plot the FTPC hardware readings from the slow control archives
Software
FTPC Software
Calibration Software
- StRoot/StFtpcDriftMapMaker
- StRoot/StFtpcCalibMaker - includes the Ftpc offline database macros
- Online
- Offline
Simulation and Reconstruction Software
- Simulation
- Reconstruction
- Association Maker
- SEE Obsolete FTPC Makers and PAMs for outdated FTPC software
- SEE FTPC in ITTF for information on Maria Mora's integration of the FTPC into ITTF
How to
List
|
Group |
Task Description/Problems |
Location of Source Code |
Contact |
|
DAQ |
|
|
|
|
|
Map FTPC electonics to DAQ |
$CVSROOT/online/ftpc/MapFtpcElectronicsToDaq |
Janet |
|
|
FTPC "gain table" for DAQ |
|
Frank |
|
Online |
|
|
|
|
|
FTPC Detector Control |
/afs/rhic.bnl.gov/star/doc_public/www/ftpc/Operations |
Terry |
|
|
Slow Control |
|
Terry |
|
|
FTPC Slow Control Monitoring Facility |
|
Terry |
|
|
Pad Monitor |
$CVSROOT/online/ftpc/FtpcPadMonitor |
Janet |
|
|
Online Tools: |
|
Terry Janet |
|
|
Online histograms ("Panitkin plots") |
|
Janet |
|
Drift Velocity Monitor |
OBSOLETE |
|
|
|
|
LabView program running on bond.starp |
|
|
|
|
bond.starp -> virgo.starp samba connection |
|
|
|
|
virgo.starp cron job - copies files from /DV2/Today to /DV2/Store |
|
|
|
|
Conversion of DVM data files to root format |
|
|
|
|
StFtpcDVMMaker - DVM data analysis programs |
$CVSROOT/offline/StFtpcDVMMaker |
|
|
Calibration |
|
|
|
|
|
Noise Finder: |
|
Terry |
|
|
Drift Maps:
Magboltz2 |
$CVSROOT/StRoot/StFtpcDriftMapMaker $CVSROOT/online/ftpc/Magboltz2 |
Janet |
|
|
Laser Analysis: |
|
Terry |
|
Databases |
|
|
|
|
|
Slow Control -> Online database -> Offline database |
|
Terry |
|
|
Offline database: |
|
Terry |
|
|
StDb/idl - idl definition files for FTPC database tables |
$CVSROOT/StDb/idl |
Janet |
|
Simulation/ Reconstruction |
|
|
|
|
|
StFtpcSlowSimMaker |
$CVSROOT/StRoot/StFtpcSlowSimMaker |
Frank |
|
|
StFtpcClusterMaker |
$CVSROOT/StRoot/StFtpcClusterMaker |
Joern |
|
|
StFtpcTrackMaker |
$CVSROOT/StRoot/StFtpcTrackMaker |
Markus |
|
|
pams/ftpc/idl |
$CVSROOT/pams/ftpc/idl |
Janet |
|
QA |
|
|
|
|
|
St_QA_Maker |
$CVSROOT/StRoot/St_QA_Maker |
Gene Janet |
|
Embedding |
|
|
|
|
|
StFtpcMixerMaker |
$CVSROOT/StRoot/StFtpcMixerMaker |
Frank |
|
Analysis |
|
|
|
|
|
StFtpcMcAnalysisMaker |
|
Frank |
|
ITTF |
|
|
|
|
|
StiFtpc |
$CVSROOT/StRoot/StiFtpc |
Maria Mora-Corall |
|
Documentation |
|
|
|
|
|
Web pages |
/afs/rhic.bnl.gov/star/doc_public/www/ftpc /afs/rhic.bnl.gov/star/doc_private/www/ftpc |
Janet |
This page was written by Janet Seyboth on Febuary 10, 2004
Online
FTPC "Online" Calibration Software
The FTPC "online" calibration software is a collection of programs and macros which run on the FTPC
online machines (virgo-run09.starp,cassini-run09.starp) processing either data directly from the event pool or from
a *.daq file.
All the FTPC calibration software is committed to the online/ftpc branch of the STAR CVS reposititory.
Each committed module contains a README file and a doc subdirectory which contain all the pertinent
information regarding the purpose and use of the program and/or macros contained in the module.
The FTPC "online" calibration program library is located on virgo-run09.starp in /data/FtpcOnlineLibrary
and can be used from the ftpccrew account on virgo-run09.starp.
Attention: The FTPC 3-D display software does not run with ROOT_LEVEL 4.04.02
Programs in the FtpcOnlineLibrary
Calib_Tool:
calib_tool creates a graphical user interface which allows the user to interactively analyze
the *.root files produced when the daq files from an FTPC laser run are processed
with the FTPC "private chain". The FTPC "private chain" produces a special output
file when DEBUGFILE is defined in StFtpcClusterMaker and StFtpcTrackMaker.
CardFinder:
The CardFinder utilities,PadAnalysisCreate and PadAnalysisWrite, analyze the pads, locate
the bad and/or noisy chips and produce lists of the bad electronics.
EvpPoolReader:
Reads, processes and displays event(s) from the event pool: /evp/a, /evp/b or
the "live" stream (the event which is currently being input into the event pool).
Due to firewall restrictions you can only access the event pool and the live stream from the starp sub-net .
Click here for running instructions.
FtpcPadMonitor:
padmon is a software program designed for monitoring the FTPC hardware performance.
NoiseFinder:
NoiseFinder contains the programs and macros which produce the FTPC online and offline
gain tables.
Run the NoiseFinder programs GetGain and FindNoise from the FtpcOnlineLibrary
on virgo.starp.bnl.gov to create a gain table. The gain table flags out dead
and/or noisy pads. The NoiseFinder utility, WriteAmpSlope_cc.so, converts the
gain table into an ftpcAmpSlope.C file which is added to the offline data base
in the Calibrations_ftpc/ftpcAmpSlope table.
Online_Tool:
Online_Tool contains the shell script ftpc_display and the L3 display
macros. The ftpc_display shell script provides an interface to FTPC online
event processing. An event from the event pool or from a daq file is read in
and the cluster finding and tracking results are displayed with the 3-D viewer.
Click here for running instructions.
calib_tool
FTPC Calib_Tool
calib_tool creates a graphical user interface which allows the user to interactively analyze
the *.root files produced when the daq files from an FTPC laser run are processed with
the FTPC "private chain"
"ftpc db globT detDb tpcDb dbutil in dst event"
The FTPC "private chain" produces a special output file when DEBUGFILE is defined in
StFtpcClusterMaker and StFtpcTrackMaker.
For information on calib_tool, type
calib_tool -h
Which will print the following
Usage: calib_tool [-l] [-b] [-n] [-q] [dir] [file1.root]
Options:
-b : run in batch mode without graphics
-n : do not execute logon and logoff macros as specified in .rootrc
-q : exit after processing command line macro files
-l : do not show splash screen
dir : if dir is a valid directory cd to it before executing
? : print usage
-h : print usage
--help : print usage
-config : print ./configure options
Choose [dir] and [file] via panel. There is a sample *.root file in the examples
sub-directory.
This page was created by Janet Seyboth on March 7, 2006
Reconstruction
FTPC Reconstruction
Hit Finding
StFtpcClusterMaker Documentation
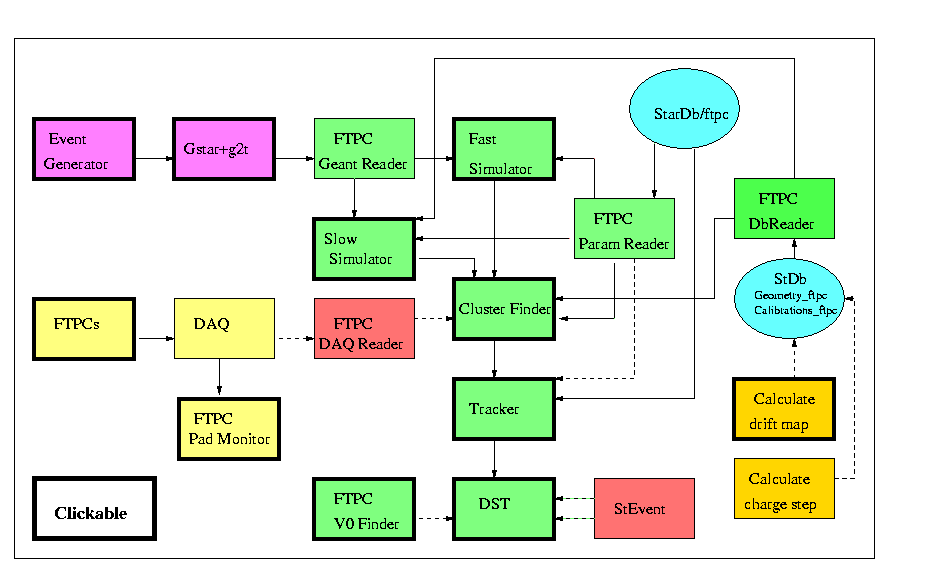
If raw data already exists, either produced by the FTPC slow simulator (StFtpcSlowSimMaker) or from a daq data import, StFtpcClusterMaker will immediately invoke the cluster finder StFtpcClusterFinder . Otherwise, the FTPC fast simulator StFtpcFastSimu will be invoked to generate hits from geant data.
Tracking
StFtpcTrackMaker - FTPC Conformal Mapping Tracker
The StFtpcTrackMaker replaces St_fpt_Maker in the FTPC reconstruction chain.
StFtpcTrackMaker uses the clusters from StFtpcClusterMaker to reconstruct the tracks in the FTPC using conformal mapping. A list of all the "found" hits along with the number actually found and the maximum number of hits possible are saved for each track.
Then these "found" hits are fit using a 2x2-D track fitter. The impact parameter at the pre-vertex is calculated. All tracks with an impact parameter less than max_Dca are flagged as primary track candidates whose vertex is the pre-vertex. The momentum fit results for the unconstrained fit are saved in the track table.
14553 Geant hits (about 1000 tracks per Ftpc) after being tracked with the new Conformal Mapping Algorithm.![]()
![]()
![]()
Markus Oldenburg
Last modified: Apr 20 2005
Simulation
FTPC geometry
- ftpcgeo - FTPC geant geometry definitions
Momentum Resolution
- HF Momentum Resolution Study Simulations about the performance of the FTPCs in a 0.25T magnetic field
Mock Data challenges
FTPC Fast Simulator
FTPC Slow Simulator
- TUNING
- Sim vs. Real Data - AuAu (behaviour of number of hits-on-track with event multiplicity)
- Sim vs. Real Data - dAu (behaviour of number of hits-on-track and residuals)
- StRoot/StFtpcSlowSimMaker pdf ps
- ftpcsim - Wen Gong's original stand-alone version
- pams/ftpc/fss -> StRoot/St_fss_Maker: now obsolete
HF Momentum Resolution Study
FTPC Half Field Momentum Resolution Study
This page shows results of some tests done in Munich to estimate the effect running at half the normal magnetic field strength would have on the FTPCs' momentum resolution.
The tests were done comparing the momentum resolution of two venus runs produced for mock data challenge 2. MDC 2 data is not very suitable for FTPC testing as it was calculated at extremely high geant resolution, so that each track caused several hits in each padrow. However, all the available data at half field is from MDC 2.
One event of each run was processed through the fast simulation chain, assuming that the quality of ExB corrections will not change with the field strength. Fast simulation makes it possible to compare reconstructed tracks to geant tracks by simply comparing the constituent points.
The plots show the reconstructed momentum divided by the geant momentum and are in good agreement with earlier studies done with realistic simulation parameters and the measured magnet field. (Earlier simulations done by Michael Konrad assuming a perfectly uniform field looked somewhat better.) Only perfectly reconstructed tracks with 10 hits that actually belonged to the same geant track are used in the plot.
The first plot shows the resolution at full magnetic field, the second at half field. Both peaks are nicely centered around one, showing essentially correct momentum resolution, but the RMS of the distribution increases from 15 to 20 percent when going to half the magnetic field. This is in contradiction with the obvious assumption of a linear increase of the errors, which, however, is not really to be expected at closer inspection. Also, the number of properly reconstructed tracks is smaller in the second plot, but it is yet unclear if this is due to a larger range of delta spirals in the smaller field, to some other effect or just statistics.
Full field: 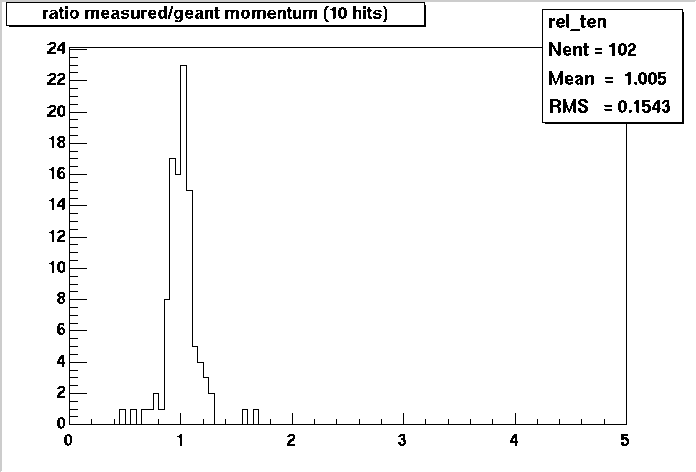
Half field: 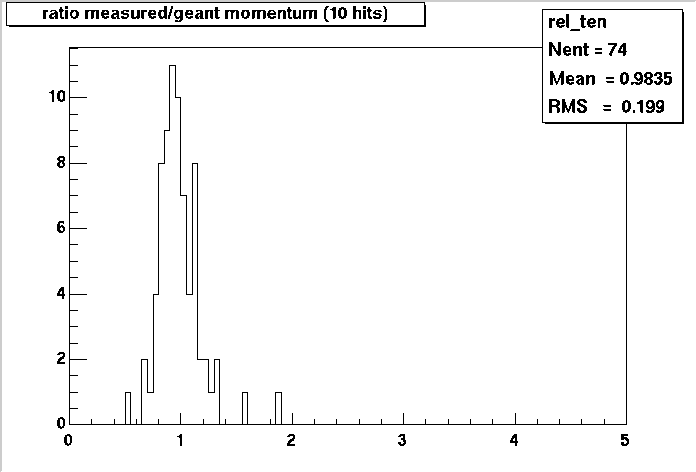
MDC1
FTPC and MDC1
The FTPC slow simulator chain:
- fss --- The FTPC Slow Simulator
- fcl --- The FTPC CLuster finder
- fpt --- The FTPC tracker
- fte - track evaluator
was included in the bfc.kumac for MDC1. NO dst information was written out.
Results:
We were able to find and correct programming errors which caused NaN's.
This page was written by Janet Seyboth on February 6, 1999
MDC2
FTPC and MDC2
In MDC2, the GEANT step size in the FTPC acceptance was reduced, so that every passing particle left a series of geant hits in every padrow. This became a serious challenge for the FTPC software and, even after optimization, increased the calculation time significantly. To get high-statistics for strangeness studies in the TPC, the planned schedule was changed in favor of more TPC fast simulator runs. Therefore, only a small number of events was run through the FTPC chain in MDC2, both with and without the slow simulator.
The complete FTPC slow simulator chain was run in the ROOT chain macro (bfc.C):
- St_fss_Maker --- The FTPC Slow Simulator
- St_fcl_Maker --- The FTPC CLuster finder
In runs when no raw_data from the FTPC slow simulator exists, St_fcl_Maker ran the FTPC fast simulator module ffs. - St_fpt_Maker --- ran the following FTPC modules:
fpt - track finder
fte - track evaluator
fde - dE/dx calculator
The FTPC track, point and dE/dx information was written out to the dst by St_glb_Maker.
This page was written by Janet Seyboth on February 6, 1999
MDC4
FTPC and MDC4
BNL, April 26 - May 10, 2001
Status History for FTPC in MDC4
Reconstruction
Purpose - MDC4 gave us the opportunity to test the performance and stability of our reconstruction chain with a large amount of simulated data before real data taking begins. It was the first large scale test of our slow simulator and cluster finder.
MDC4 Datasets - Dataset A (20,000 Au+Au MEVSIM events), DataSet B (100,000 pp PYTHIA events) and Dataset C (Au+Au peripheral STARLIGHT events) were processed in MDC4
BFC Chains - The FTPC ran only in the Au+Au BFC chain since our simulators can not handle pile-up
starnew new->SL00d
ROOT 3.00.06
bfc.C(#events,"MDC4","input dataset")
Identified Reconstruction Tasks
Implement StAssociationMaker
Pileup - we have to add pileup to our simulators in order to process pp simulation data (Contact: Akio,Jan)
Chisq - determine the correct values for the $STAR/StarDb/ftpc/ftpcClusterPars.C parameters
                   timeDiffusionErrors[1]
                   timeDiffusionErrors[2]
Reconstructed Datasets on FTPC BNL Cluster
There are 80 MEVSIM events in /cassini/data1/MDC4/Gstar/rcf0181_01_80evts.fzd
A complete set of output *.root files for these 80 events is available in /cassini/data1/MDC4
Analysis
Status - The analysis half of MDC4 was held for Friday, May 4 - Thursday, May 10
PWGs Expectations - The analysis focused on the new detectors and their physics capabilities
Spectra PWG - larger acceptance with FTPC
EbyE PWG - flow with FTPC
Strangeness PWG - first attempts to find v0's in FTPC
MDC4 Status Meetings
There was a telephone conference each Tuesday and Thursday at 3pm EST in the White Pit in Bldg. 118 (dial in x8261)
MDC4 Wrap-up Meeting
On Thursday, May 10 starting around 1:30pm EST there was a wrap-up meeting. Each sub-system was requested to summarize their experiences gained in MDC4 regarding efficiencies,problems encountered, etc. This summary should also contain a short summary on the new physics capabilities
JPWG Meeting
A PWG Workshop was held for Thursday, May 10 - Monday, May 14
This page was written by Janet Seyboth on April 27, 2001
Sim vs. Real Data - dAu
Comparison Slow Simulator and Real data dAu Min Bias
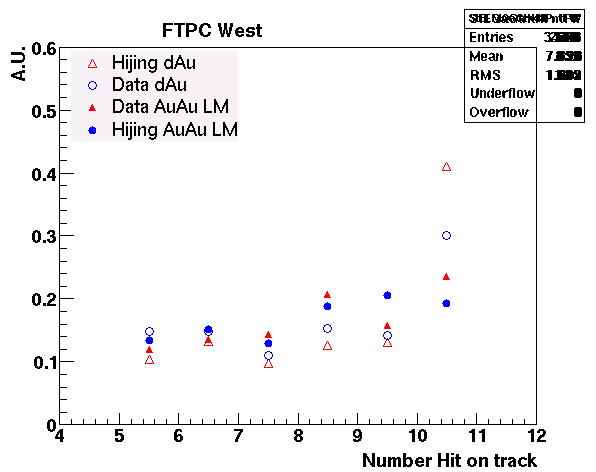
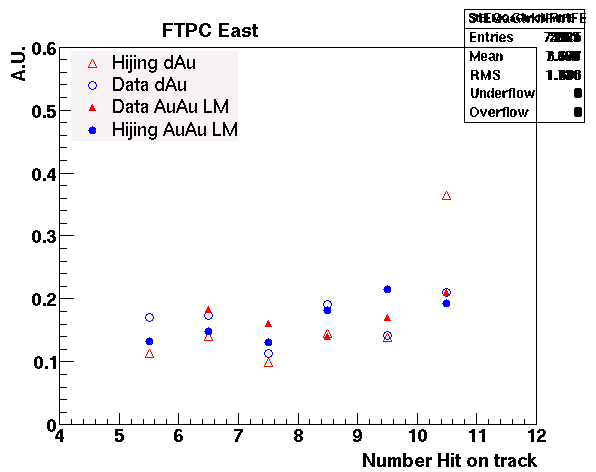
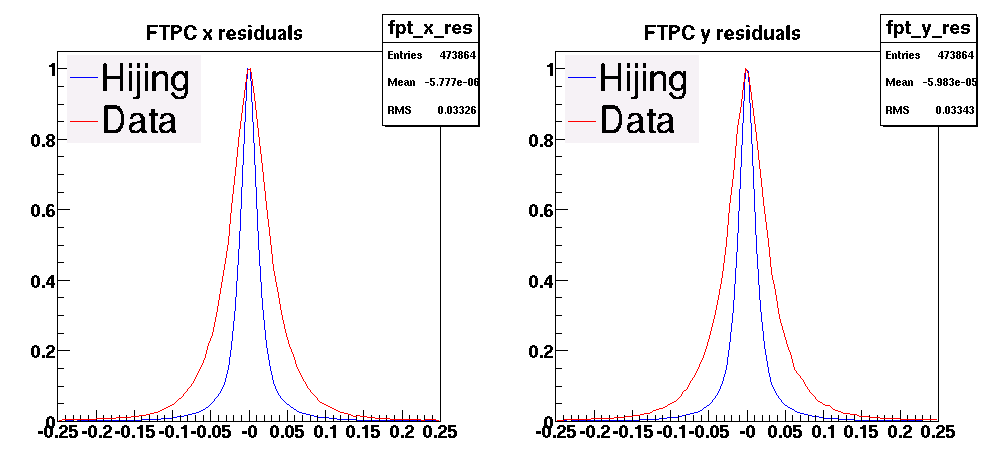
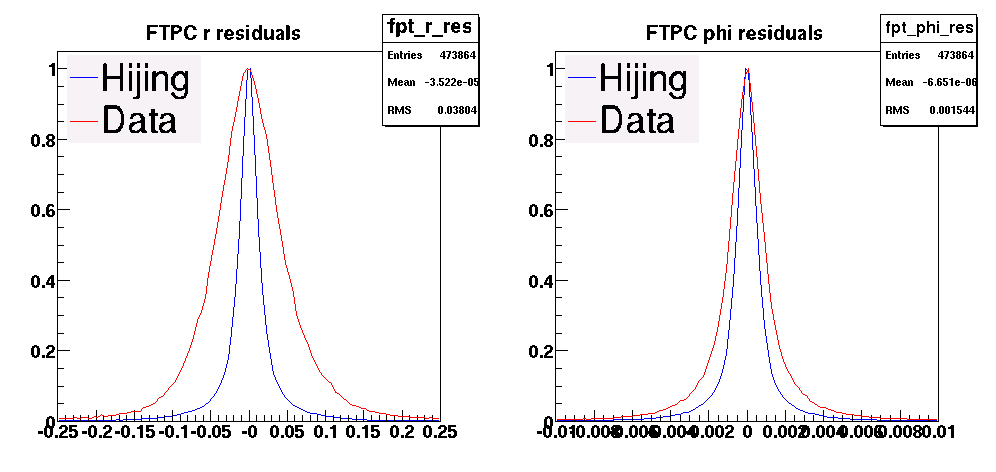
The Distribution of the number of hits-on-global-track is NOT the same for Real Data and Simulation with Hijing through the Slow Simulator (?) What happens with all this 10-hit-on-track ? The used Gain Table is not good enough to reproduce the holes?
 |  |
| FTPC West | FTPC East |
| AuAu minbias with low multiplicity in comparison with dAu min bias REAL DATA and SIMULATION | AuAu minbias with low multiplicity in comparison with dAu min bias REAL DATA and SIMULATION |
 |  |
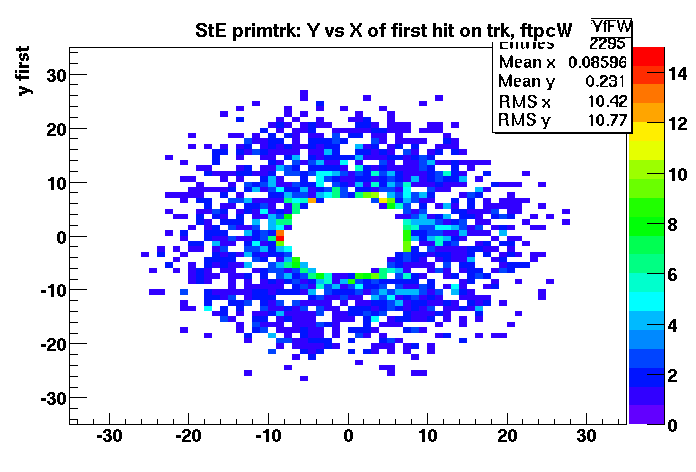 | 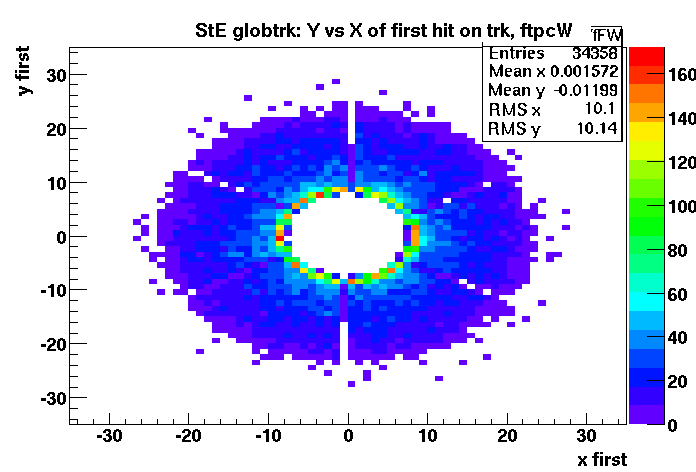 |
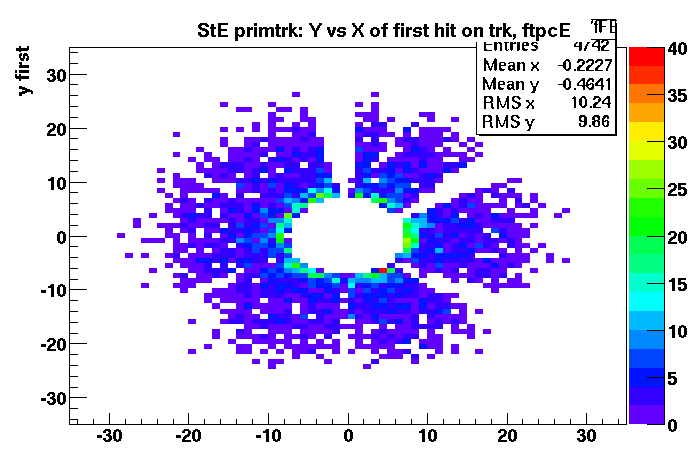
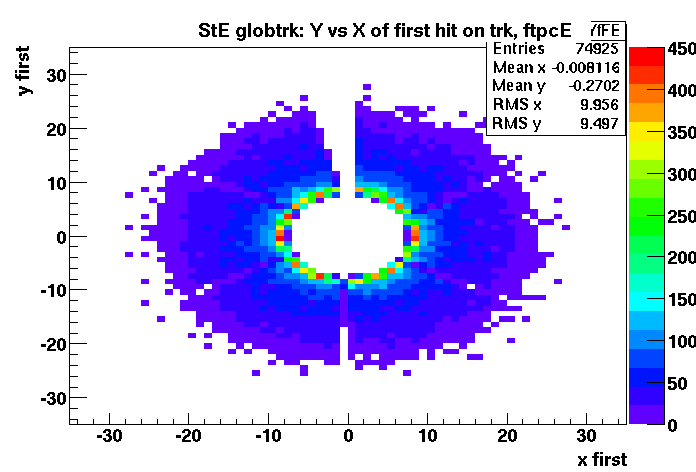
| REAL DATA | SIMULATION |
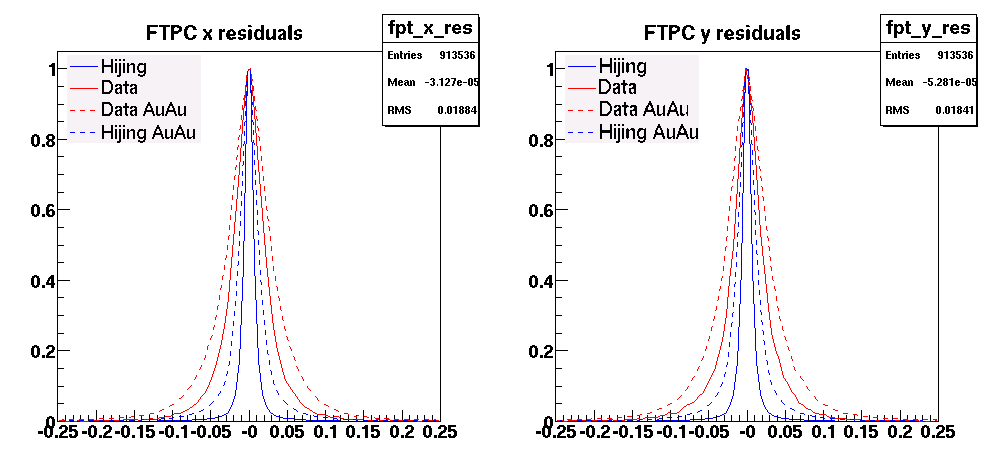
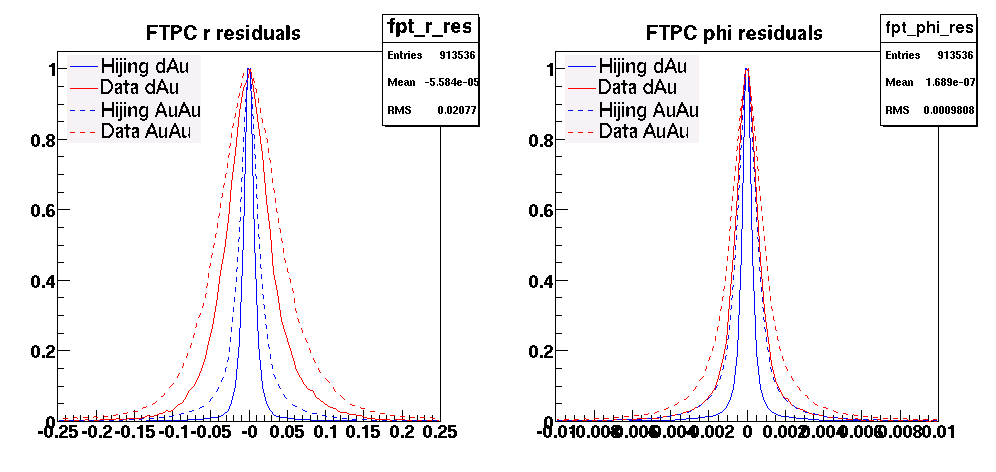
The residuals are much better for Simulation than for Real data. We still need to do something here )-:
Sim vs. Real Data - AuAu
Comparison Slow Simulator and Real data for AuAu minbias events
The trend with the variation of the number of hits on track with the multiplicity is the same for Real Data and Simulation with Hijing through the Slow Simulator
| FTPC East | 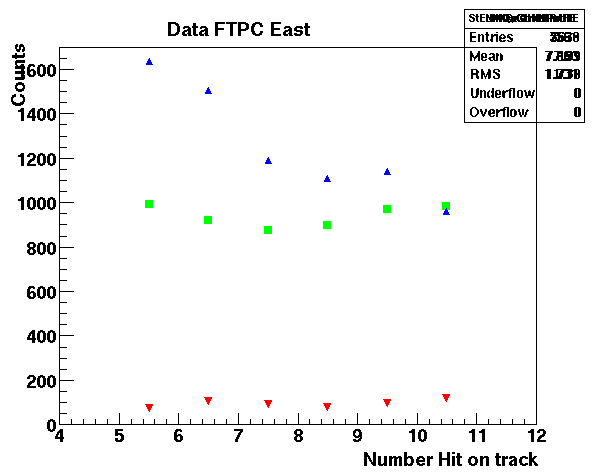 |
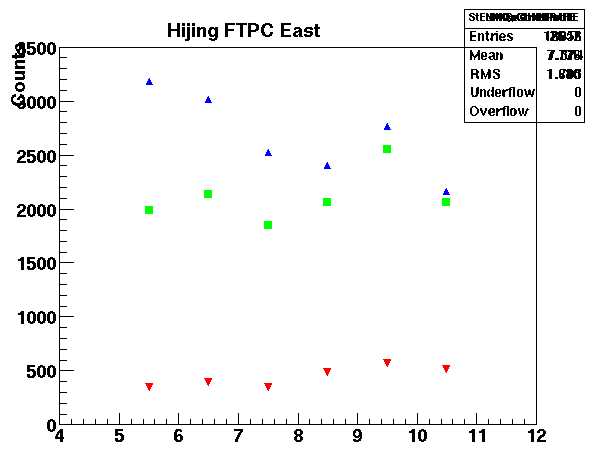 |
| AuAu minbias REAL DATA from Low Multiplicity (red) to High multiplicity (blue) | AuAu minbias SIMULATION from Low Multiplicity (red) to High multiplicity (blue) | |
| FTPC West | 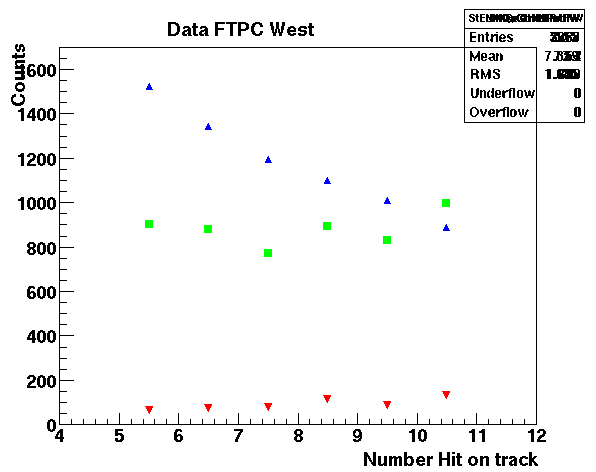 |
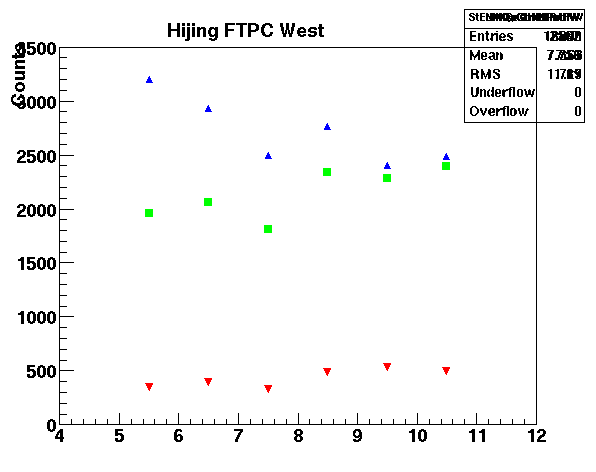 |
| AuAu minbias REAL DATA from Low Multiplicity (red) to High multiplicity (blue) | AuAu minbias SIMULATION from Low Multiplicity (red) to High multiplicity (blue) |
The residuals are much better for Simulation than for Real data. We still need to do something here )-:
StFtpcFastSimu
StFtpcFastSimu - FTPC Fast Simulator
The FTPC fast simulator is implemented in C++ (as a part of StFtpcClusterMaker).
It was converted from Fortran (pam/ffs) to C++ by Holm Hümmler and is supported by Janet Seyboth.
StFtpcFastSimu simply takes the hit points registered by geant and turns them into FTPC points. Some cuts are applied to remove points that are outside the sensitive volume of the FTPC sectors and to account for the loss of hits due to cluster merging. Some of the geant information is kept in the gepoint table to be used in efficiency studies.
ftpcgeo
ftpcgeo.g
ftpcgeo.g defines the geometry for the FTPC in geant simulations. It contains information about the main aluminum cylinder, its support structures, the fieldcage and a rather detailed description of the readout chambers, and it defines the sensitive volumes.
Other geometry files of interest for the FTPC simulation are pipegeo.g for the beampipe and svttgeo.g with a description of the SVT, its support cone, the beampipe support and the shield layers.
This page was updated by Holm Hümmler on September 16, 1999
