- Hard Probes
- Heavy Flavor
- Abstracts, Presentations and Proceedings
- HF PWG QM2011 analysis topics
- HF PWG Preliminary plots
- Heavy Quark Physics in Nucleus-Nucleus Collisions Workshop at UCLA
- NPE Analyses
- PicoDst production requests
- Upsilon Analysis
- Combinatorial background subtraction for e+e- signals
- Estimating Acceptance Uncertainty due to unknown Upsilon Polarization
- Estimating Drell-Yan contribution from NLO calculation.
- Response to PRD referee comments on Upsilon Paper
- Upsilon Analysis in d+Au 2008
- Upsilon Analysis in p+p 2009
- Upsilon Paper: pp, d+Au, Au+Au
- Using Pythia 8 to get b-bbar -> e+e-
- Varying the Continuum Contribution to the Dielectron Mass Spectrum
- WWW
- Jet-like correlations
- Other Groups
- Peripheral Collisions
- Spin
Invariant Mass fits
Updated on Fri, 2010-09-03 18:57. Originally created by rjreed on 2010-09-03 02:57.
Under:
In order to calculate the yield of the Upsilon (1S+2S+3S) state, we need to be able to subtract out the contribution from Drell Yan (DY) and the b-bbar continuum. This is difficult because the yields are not known precisely for this mass range in p+p, and in Au+Au the b-bbar continuum is hypothesized to experience some supression.
0-60% Centrality
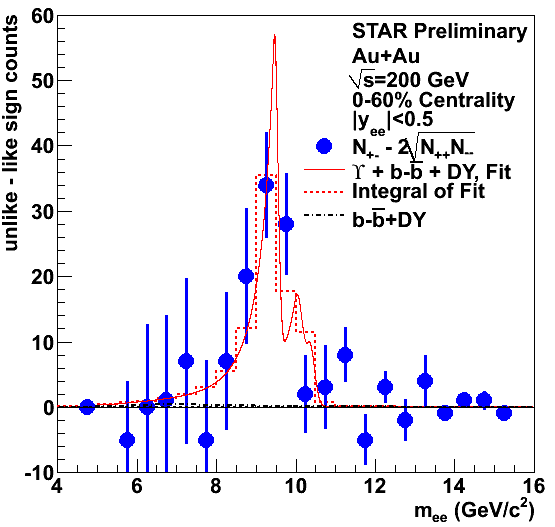
First, fit leaving the amplitude for the DY, b-bbar and total upsilon yield free. The ratio of the 1S, 2S and 3S states is kept the same as in p+p.

Figure 1: 0-60% centrality fit with 3 free parameter, the yield of DY, b-bbar and upislon. The chi^2/dof for this fit is 1.28. The number of b-bbar counts is 0, and the number of DY counts is 1.15 +/- 22.3. The upsilon yield in 5<m<16 from the fit is 88.2+/-17.7 and is 100.4+/-20.2 from a bin-by-bin counting.
Given our statistics and the very similar shape of the DY and b-bbar curve, the fit in Figure 1 convinced me that it is best to fit with only 1 parameter that is the sum of the DY and b-bbar background.
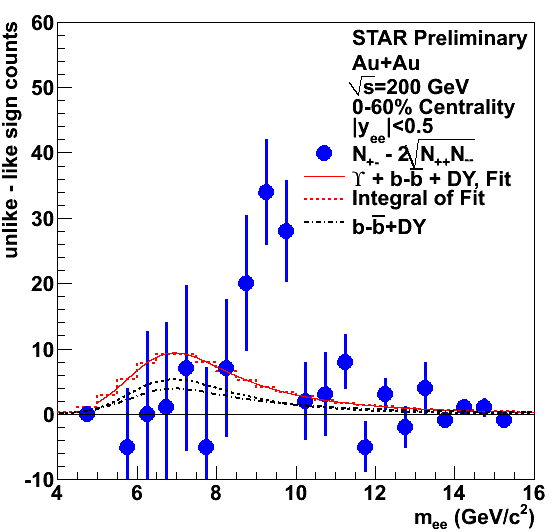
Next, the question must be asked, do we see any evidence for upsilons in this region? Or can we explain the entire unlike sign subtracted yield by the combination of Drell-Yan and b-bbar background?

Figure 2: 0-60% Centrality fit with only the DY and b-bbar background. It is obvious that this fit can not explain the peak, which indicates that we do observe Upsilons in Au+Au collisions. The chi^2/dof was 2.56. The yield of b-bbar was 12.7 +/- 25.3 and the DY yield was 11.2 +/- 24.4. The total counts in the region 8<m<11 is 94, which is much larger than the yield from the fit.

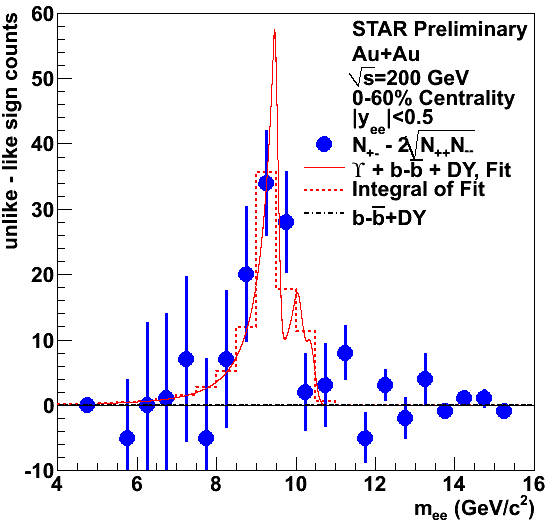
Figure 3: Fit to data assuming that there is no Drell-Yan or b-bbar background. This fit will give the largest yield of upsilons and will be used for the systematic uncertainty. The chi^2/dof is 1.14. The upsilon yield in 5<m<16 is 88.9+/- 16.3 by fit and 101.6 +/- 18.7 by a bin by bin counting method.
If we assume no suppression of a particular physics process, we are assuming RAA = 1. Rearranging this equation gives us:

In our p+p paper, we quote a combined yield of (sigma DY + sigma b-bbar )||y|<0.5, 8<m<11 GeV/c^2 = 38 ± 24 pb.
For 0-60% NmbAA = 1.14e9 and Nbin = 395. Sigma_pp is 42 mb at sqrt(s)=200 GeV. This means the number of expected DY and b-bbar counts in the 8<m<11 GeV mass range is (1.14e9)x395x38e-12/42e-3 = 407 +/- 257 if Nbin scaling were true.
If we assume the efficiency for the DY and b-bbar->e+e- is the same as the upsilon within this range, we can use the calculated upsilon efficiency of 4.4%. This means we'd expect to observe 18+/- 11 DY and b-bbar counts in 8<m<11.
The cross section for Upsilon(1S+2S+3S) was reported as 114 +/- 38(stat) pb, over all ranges. Doing the same calculation, we'd expect 1222 +/- 407 counts if Nbin scaling were true. With the calculated efficiency, this number becomes: 54 +/- 18 counts.
»
- Printer-friendly version
- Login or register to post comments
