Varying the Continuum Contribution to the Dielectron Mass Spectrum
Initial Normalization
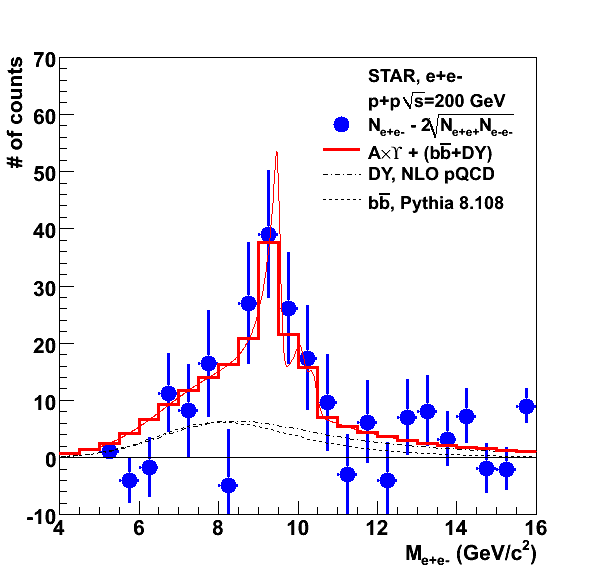
The normalization to the Drell-Yan and b-bbar cross sections are given by the calculation from Ramona in the Drell-Yan case and by Pythia in the b-bbar case. There is an uncertainty in the overall normalization of the contribution from these two sources to the dielectron continuum under the Upsilon peak. We can do a fit to obtain the Upsilon yield with the normalization fixed. This is shown below.
Fig. 1: Fit to the invariant mass spectrum. The data points are in blue. The Drell-Yan curve is the dot-dashed line and the b-bbar is the dashed line. The Red line is the sum of the Upsilon line shape (obtained from embedding for the 1S+2S+3S keeping their ratios according to the PDG values) plus the continuum contribution from DY+b-bbar. The red histogram is the integral of the red line, which is what is used to compare to the data in the fit (we fit using the "i" option to use the integral of the function in each bin).

With the above fit, we obtain 64.3 counts after integrating the upsilon part (the yield of DY is 32.3 and the yield of b-bbar is 26.8, both are held fixed for the fit). This gives a cross section of 63.4/(1*0.054*9.6 pb-1) = 124 pb. The efficiency estimate of 5.4% for the overall efficiency is still being checked though, given the E/p shape not being gaussian due to the trigger bias near the L0 threshold, so this can still change.
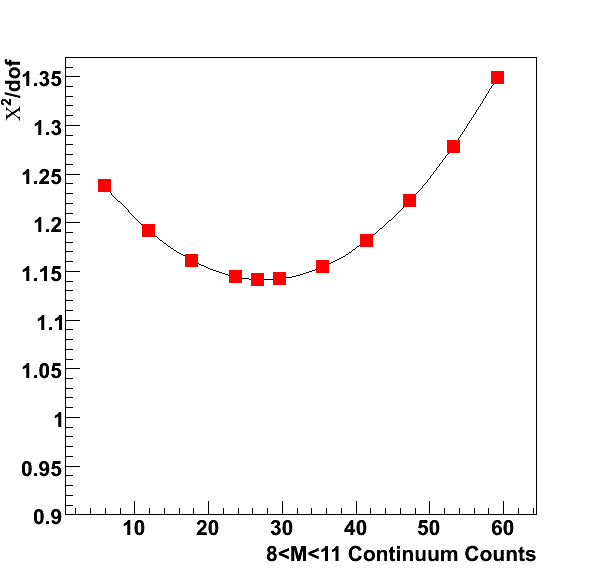
It is also possible to let the yield of the continuum vary and study if the chisquare/dof of the fit improves. That way, we can not just assume a continuum yield, but actually measure it. Since the yields of the DY and the b-bbar are very similar and given our statistics we can't really discriminate one from the other, we are mainly sensitive to the sum. One way to study this is to keep their ratios fixed as in the plot above, but vary the overall yield of both of them This adds one extra parameter to the fit to account for the total sum of the continuum yield. We perform the fit in the region 5< m < 16 GeV/c2.
One issue is that the Crystal-Ball fit is a user defined function, and we use the integral of the function to fit, which seems to push ROOT to its limit in an interactive session with a macro interpreted on the fly. This is alleviated somewhat by cleaning up the code to do the one-parameter fit in a compiled macro. However, trying out the two-parameter fit directly seems to be too much for ROOT even in compiled mode and the code runs out of memory and seg-faults. A (rather inelegant) way around this is to scale the continuum yield by hand, compile the macro each time and do the one-parameter fit. For each of those fits, one can obtain the chisquare/deg. of freedom. This is shown in the plot below:
Fig. 2. Chisquare per degree of freedom as a function of the continuum yield (Drell-Yan + b-bbar).

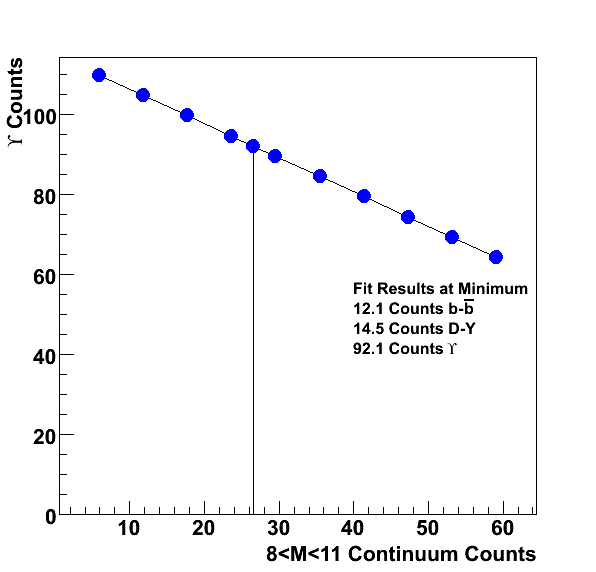
We find a clear minimum, indicating that our data do have some sensitivity to the continuum yield. The Rightmost point with 59.1 counts is the yield obtained directly from Pythia 8.108 and from Ramona's calculation. Our data indicate that the yield is likely smaller by about a factor of 2, we obtain at the minimum a yield of 26.6 counts. Since the yield of Upsilons is obtained from the same fit, our fitted Upsilon yield will increase with decreasing counts from the continuum. This is shown below.
Fig. 3: Fitted yield of Upsilons for a given continuum yield. The minimum found above is illustrated by the vertical line.

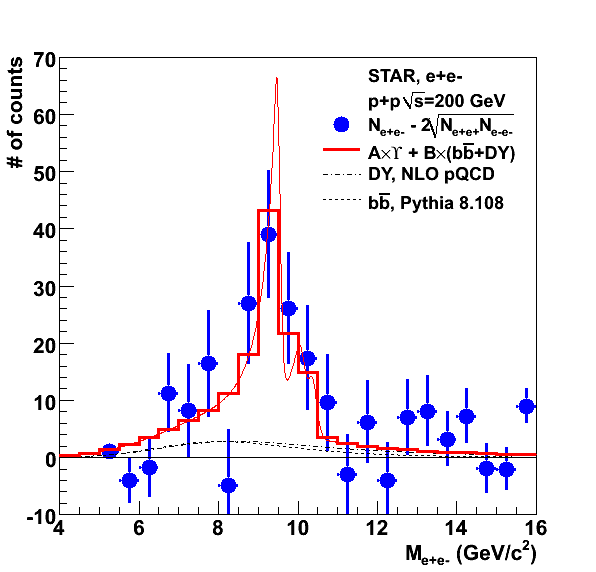
The corresponding plot with the fit at the minimum is shown below.
Fig. 4: Dielectron data with the curves for the DY and b-bbar at the yield which minimizes the chi-square. In other words, the result of a (poor man's) two-parameter fit to find both the Upsilon yield and the Continuum yield.

The results of this fit give 14.5 counts for DY and 12.1 counts for b-bbar, i.e a factor 0.45 lower than the 32.3 counts for DY and the 26.8 counts for b-bbar is 26.8 obtained before. Ramona's calculation for dsigma/dm |y|<1 gave 5.25 nb and the Pythia cross section b-bbar cross section times the BR into e+e- gives 6.5 nb, so our data indicate that we can decrease these by a factor 0.45 (or decrease one by essentially 100% and leave the other one unchanged). The Upsilon yield in this case increases to 92.1 counts, which gives a cross section of 92.1/(1*0.054*9.6) = 178 pb. So this has a large effect on the yield (92.1-64.338)/92.1 = 0.3, i.e. a 30% change in the yield (and hence in the cross section). Note also that 178 pb is quite larger than our first estimate for the cross section. This highlights the importance of getting the efficiency estimates right.
- Printer-friendly version
- Login or register to post comments
