Run 4 BTOW Calibration
Introduction:
The recalibration of the BEMC towers for Run 4 includes the following improvements:
- recovery of 158 swapped towers
- identification and removal of 38 towers with possible light leakage / electronics problems
- identification and removal of 24 towers with bad p/E distributions
- MIP calibration restricted to low-multiplicity events from minimum-bias data
- isolation requirement imposed on MIP candidates


Notes:
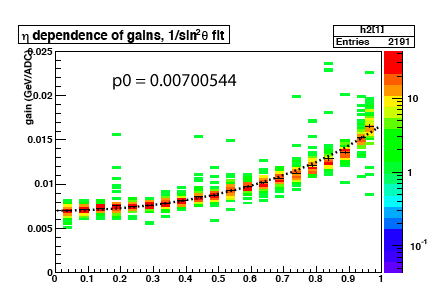
- p0 * 4066 = 28.5 GeV full-scale at zero rapidity (assuming pedestal~30).
- 2191/2400 = 91.3% of the towers have nonzero gains.
- Despite the differences in the cuts used, the final gains are similar to the ones currently found in the DB; a histogram of (newgain-dbgain)/newgain for the towers present in both calibrations yields a mean of 0.019 and an rms of 0.03896.
Procedure:
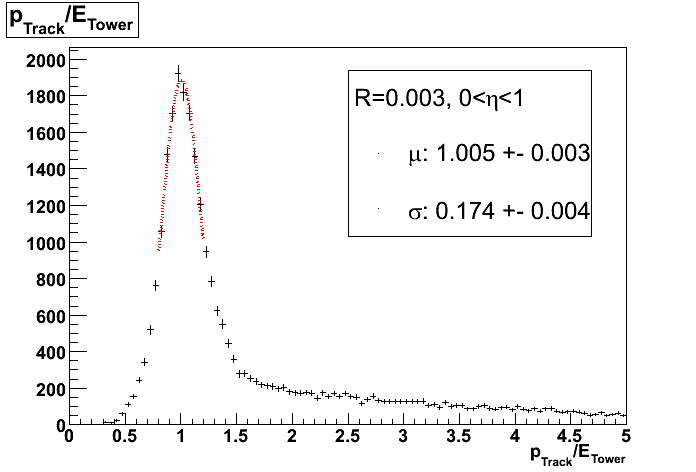
The offline calibration of the BEMC towers for Run 4 is accomplished in three steps. In the first step, MIPs are collected for each tower and their pedestal-subtracted ADC spectra are plotted. The MPV of the distribution for each tower is translated into a gain using an equation originally established by test-beam data (SN 0433). In the second step, electrons are collected for each eta-ring and the ratio of their momentum and energy (with the energy calculated using the MIP gains from step 1) is plotted as a function of the distance between the track and the center of the tower. The calculated curve is fit to a GEANT simulation curve, allowing extraction of scale factors for the MIP gains in each eta ring. Finally, all electrons in all eta-rings are grouped together and the ratio of their energy and momentum (E/p) is plotted, with the energy calculated from the rescaled gains in the second step. The distribution is fit with a Gaussian and a scale factor is applied so that this Gaussian is centered exactly on 1.000.
Catalog query:
<inputURL="catalog:star.bnl.gov?production=P05ia||P05ib||P05ic,sanity=1,tpc=1,emc=1, trgsetupname=ProductionMinBias||productionLow||productionMid||productionHigh,filename~physics, filetype=daq_reco_mudst,magscale~FullField,storage!~HPSS,runnumber>=5028057" nFiles="all" />
Working directories:
/star/u/kocolosk/emc/offline_tower_calibration/2004/jan25_2004mip/
/star/u/kocolosk/emc/offline_tower_calibration/2004/jan30_2004electron/
MIP Cuts:
- track momentum > 1
- track enters, exits same tower
- 1 track / tower
- (ADC - ped) > 2*pedRMS
- trigger == 15007 (mb data)
- abs(z-vertex) < 30
- reference multiplicity < 57 (60-100% centrality)
- isolation cut (all neighboring towers satisfy (ADC-ped) < 2*pedRMS)
Electron Cuts:
- 1.5 < track momentum < 20
- track enters, exits same tower
- 1 track / tower
- # track points > 25
- 3.5 < dEdx < 4.5 keV/cm
- (ADC - ped) > 2*pedRMS
- trigger != 15203 (excludes most ht-triggered electrons; should have been trigger == 15007 to get mb-only data)
Adam Kocoloski, 14 Feb 2006
- Printer-friendly version
- Login or register to post comments
