BeamLine Constraint
Future suggestion: determine beamline width via impact parameter correlations
Beamline Calibration How-To
This is a step-by-step outline of how to perform the beamline calibrations. Results from each year of running can be found in the child page links below.
- Decide upon usable triggers.
- Preferrably minbias triggers, though some special triggers are fine too. The point is that the trigger should not have a bias on the reconstructed primary vertex positions (an event-wise bias is acceptable, as long as the average over many events yields no overall bias). A trigger that selectively prefers events at, for example, positive z versus negative z, is not a bias which concerns us. Meanwhile, a trigger which selects triggers using tracks from only one patch in phi in the TPC may indeed bias the vertex-finding because of track energy loss, or SpaceCharge, or other distortions.
Deciding upon these triggers may involve making a few calibration passes on a subset of the data with enough statistics to see different biases. So if there is any uncertainty about the triggers to use, there may be some iteration of the following steps.
There is also a triggers webpage which provides helpul information about the various triggers (NOTE: its URL changes for each year, so try similar URLs or parent directories for different years). - Decide upon filetype to use.
- If there are files already available with all the other calibrations (TPC alignment, T0, drift velocity, twist, etc.) in place, then one can process data faster by using either event.root (fast) or MuDst.root (really fast) files. As of this writing, one can process either of these using the FindVtxSeeds.C macro:
   void FindVtxSeeds(const Int_t   mode=0,
           const Int_t   nevents=10,
           const Char_t  *path="/star/data13/reco/dev/2001/10/",
           const Char_t  *file="st_physics_2304060_raw_0303.event.root",
           const Char_t* outDir="./");
where mode is unused, and the other parameters are self-explanatory. In this case, output files go to the outDir. The output files will be discussed later.If no available DST files will suffice, then the DAQ files will need to be processed using BFC options including "VtxSeedCalG", plus the year's geometry, a tracker, a vertex finder, and possibly other correction options. For example, in 2008 we used "VtxSeedCalG,B2008,ITTF,VFMinuit,OSpaceZ2,OGridLeak3D". The output files will, by default, go into either the local directory, or ./StarDb/Calibrations/rhic/ if it exists.
- Choosing the actual files to use.
- Now it is time to query the database for the files to use. My approach has been to link several DB tables which provide a lot of information about fill numbers, triggers, numbers of events, etc, in an effort to somewhat randomly choose files such approximately 10,000 useful triggers are processed from each fill. To do this, I passed queryNevtsPerRun.txt to mysql via the command:
cat query.txt | mysql -h onldb.starp.bnl.gov --port=3501 -C RunLog > output.txt
where the query file must be customized to select the unbiased triggers, triggersetups, and runs/fills. The query has been modified and improved in recent years to avoid joining several very large tables together and running out of memory for the query - see for example this query. This now looks much more complicated than it really is. Several simple cuts are placed on trigger setups, trigger ids (by name), run sanity (status and non-zero magnetic field), inclusion of the TPC, file streams (filenames), and lastly the number of events in the files and some very rough math to select some number of events per run by using some fraction of the file sequences.This should return something like 10,000 events per run accepted by the query. The macro StRoot/macros/calib/TrimBeamLineFiles.C can be used to pare this down to a reasonable number of events per fill (see the macro for more detailed instructions on its use). This macro's output list of files then can be processed using the chain or macro as described above.
- The output of the first pass.
- The output of the VtxSeedCal chain or FindVtxSeeds.C macro consists of anywhere from zero to two files. The first, and most likely, file will be something like: vertexseedhist.20050525.075625.ROOT (I give the output filename a capital suffix .ROOT to avoid it being grabbed by the DB maker code when many jobs used the same input directory, and it should be renamed/copied/linked such that its name has a lower case suffix .root for subsequent work). This file will appear if at least one usable vertex was found, and it contains an ntuple of information about the usable vertices. The timedate stamp will be that of the first event in the file, minus a few seconds to insure its validity for the first event in the file. The second possible file will be of the form vertexSeed.20050524.211007.C and contains the results of the beamline fit, which is performed only if at least 100 usable vertices are found. These table files are only useful as a form of quick QA, but are not needed for the next steps.
- Decide on cuts to remove biases and/or pile-up
- Use the ntuple files to look at vertex positions versus various quantities to see if cuts are necessary to remove biases and/or pile-up. Documentation on what can be found in the ntuples is available in the StVertexSeedMaker documentation. For example, one may open several ntuple files together in a TChain and then plot something like:
resNtuple.Draw("x:mult>>histo(10,4.5,54.5)","abs(z)<10");...to see if there is a low-multiplicity contribution from pile-up collisions (note that the above is but one example of many possible crosschecks which can be made to look for pile-up). Any cuts determined here can be used in the next step. - The second (aggregation) pass.
- All the desired ntuple files from the first pass should be placed in one directory. It is then a simple chore of running the macro (which is in the STAR code library and will atomatically be found):
root4star -b -q 'AggregateVtxSeed.C(...)'

Int_t AggregateVtxSeed(char* dir=0, const char* cuts="");
where dir is the name of the directory with the ntuple files, and cuts is any selection criteria string (determined in the previous step) formatted as it would be when using TTree::Draw(). The output of this pass will be just like that of the first pass, but will reduce to one file per fill. Again, no ntuple file without at least one usable vertex, and no table file without at least 100 usable vertices. Timedate stamps will now represent the start time of fills. These output table files are what go into the DB after they have been QA'ed. - QA the tables.
- I like to look at the table values as a function of time graphically to do QA. I used to do this with shell scripts, but now the aggregation pass should output a file called BLpars.root which summarizes the calibration results. The data in that file can easily be plotted by running the another macro, which is also in the STAR code library and will automatically be found):
root 'PlotVtxSeed.C(...)'

BLpars->Draw("x0:zdc");
The intercepts and slopes will be plotted on one graph (see the 2006 calibration for some nice examples of the plots), and a TTree of the results will be available for further studies using the pointer BLpars. You might also be interested to know that this macro can work on a directory of vertexseedhist.*.root files as the BLpars ntuples are stored in them as well (alongside the resNtuple ntuples of individual vertices, but only if a vertexSeed.*.C file was written [i.e. if BeamLine parameters were found]) and can be combined in a TChain, which the macro does for you.
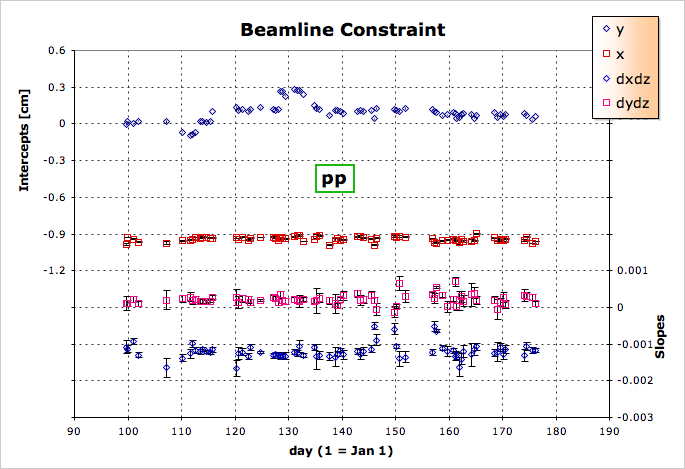
- Here are some example slopes and intercepts from my first look at QA on 2005 data (note that these plots were made from older scripts, not PlotVtxSeed.C):
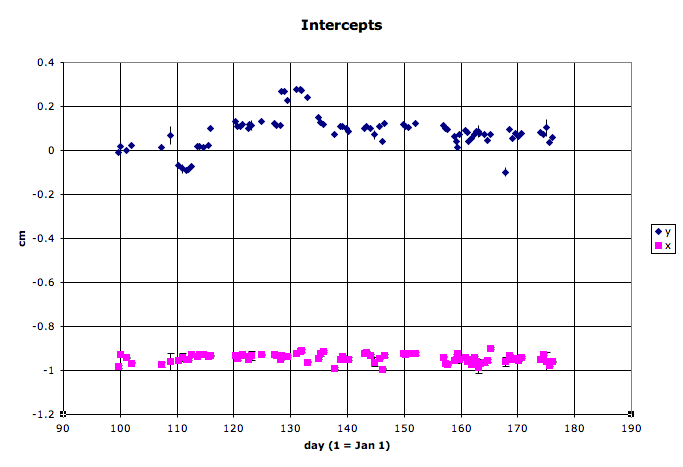
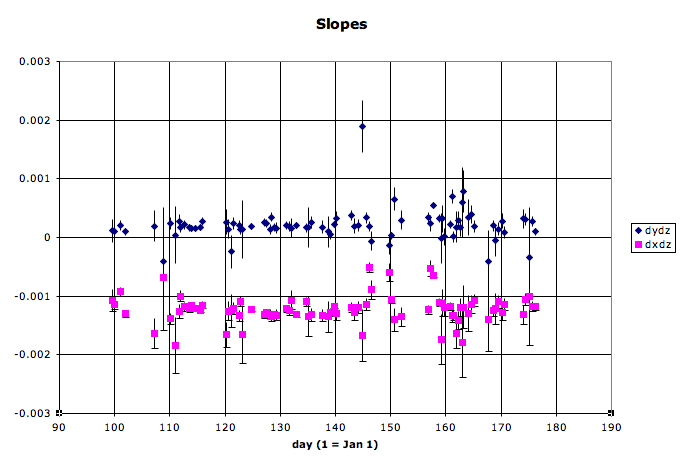
One can see several outliers in the data in addition to the normal trends of machine operations. Many of these outliers are due to limited statistics for a fill. Care must be used in deciding what to do:- If the statistics are great for that fill, this may be a real one-fill alteration of beam operations by RHIC, and the datapoint should be kept.
- If there is a long gap in data before that point, then it may be wise to keep the datapoint.
- If statistics are poor (usually the case with about 1000 or fewer usable vertices from a fill), and the data on either side of the point appears stable, it is probably a good idea to remove the datapoint.
- It may be possible to run some additional files from that fill to increase the statistics to the level where the datapoint is more significant.
- Enter the tables into the DB.
- You will need to have write permission to the Calibrations_rhic/vertexSeed table. If you do not, please see the STAR Calibrations Coordinator to arrange this with the STAR Database Administrator (see the Organization page). The DB admin can also give you examples on how to upload tables. But I will include here an example using a macro of mine which is obtainable via CVS from offline/users/genevb/WriteDbTable.C. Place all the table files into one directory from which you will upload them to the DB. I use ~/public/vertexSeed as that directory in the example below:
setenv DB_ACCESS_MODE write
root4star -b 'WriteDbTable.C("~/public/vertexSeed","vertexSeed","vertexSeed","Calibrations_rhic")'
The number of successfully (and unsuccessfully) loaded tables should be listed. - ...and you are done.
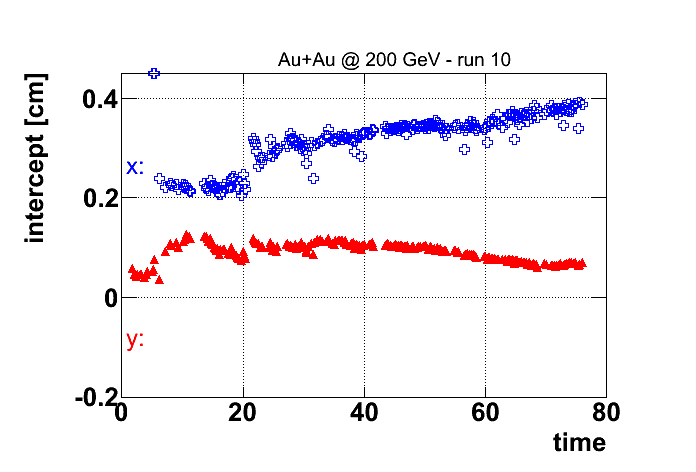
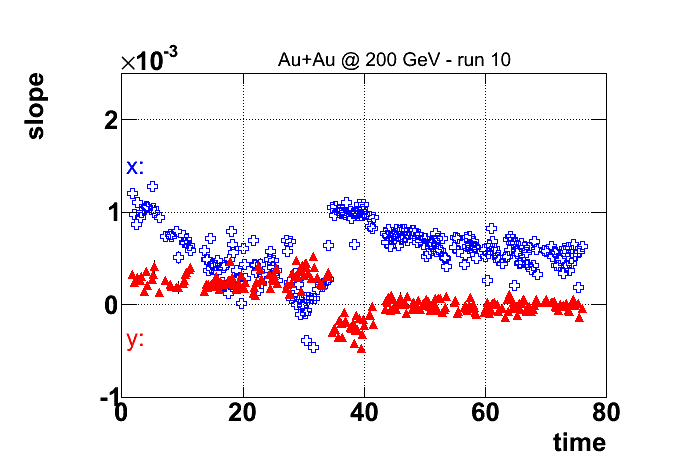
Run 10, Au+Au 200 GeV
Below the beamline parameters for Au+Au @ 200 GeV, run 10.
Run 10, Au+Au 39 GeV
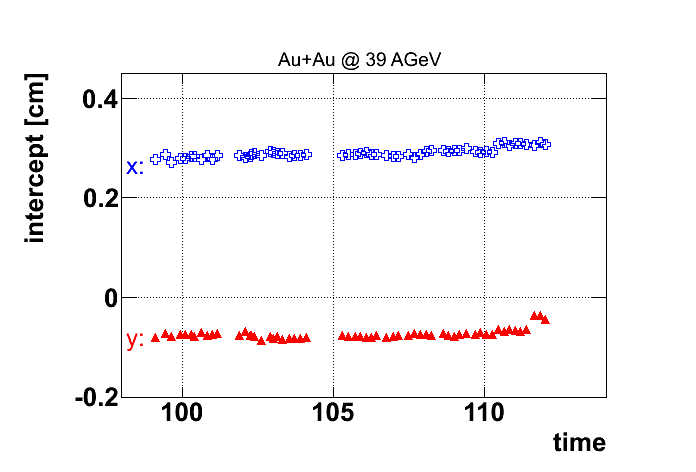
Below the intercepts and slopes of the beamline parameters for Au+Au @ 39 GeV. The standard 2D method was used.
.gif)
Run 11
pp500
Initial values considering luminosity dependence
Updated values use TPC Twist ntuples
Final calibration
AuAu19.6
(set to 0,0 for initialization)
AuAu200
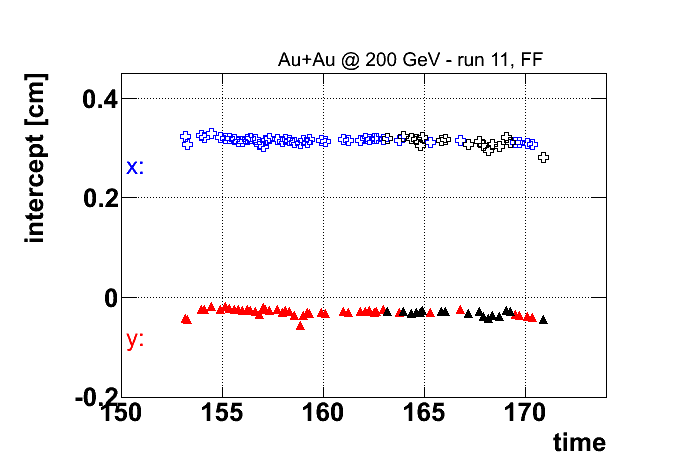
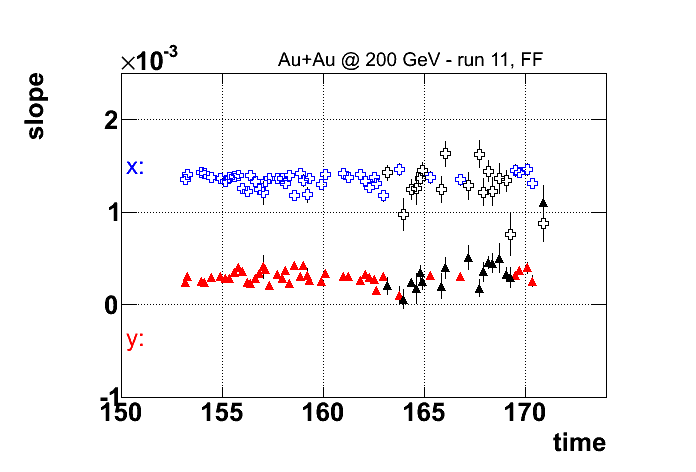
Run 11, Au+Au 200 GeV, Full Field (FF)
Below the beamline parameters for Au+Au @ 200 GeV FF. The entries with black markers were removed before upload because of low statistics.
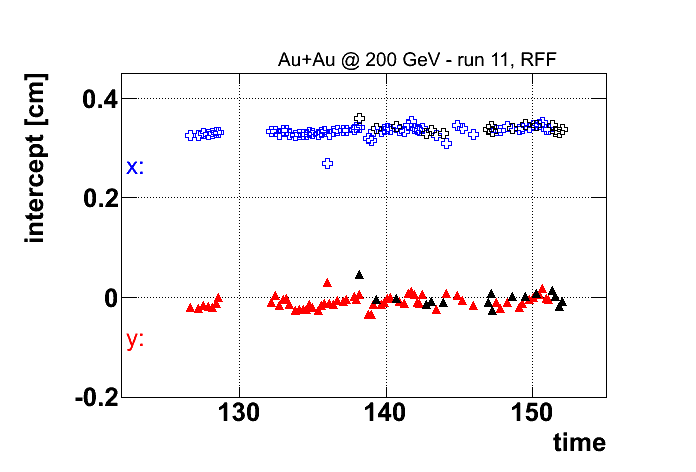
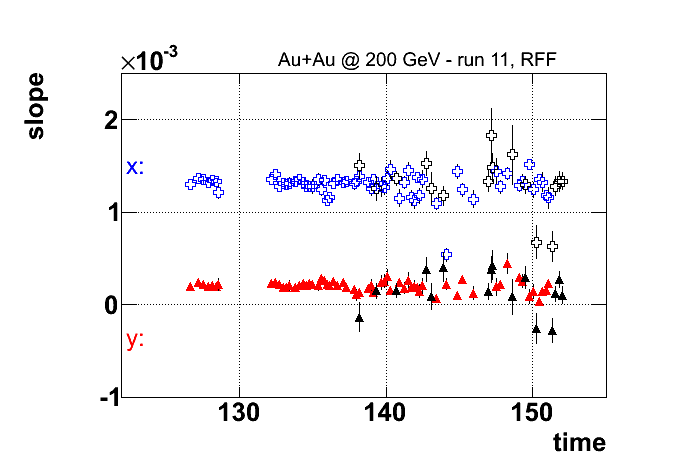
Run 11, Au+Au 200 GeV, Reverse Full Field (RFF)
Below the beamline parameters for Au+Au @ 200 GeV RFF. The entries with black markers were removed before upload because of low statistics.
Run 11, pp500
Below the intercepts and slopes of the beamlime parameters for pp500, run11.
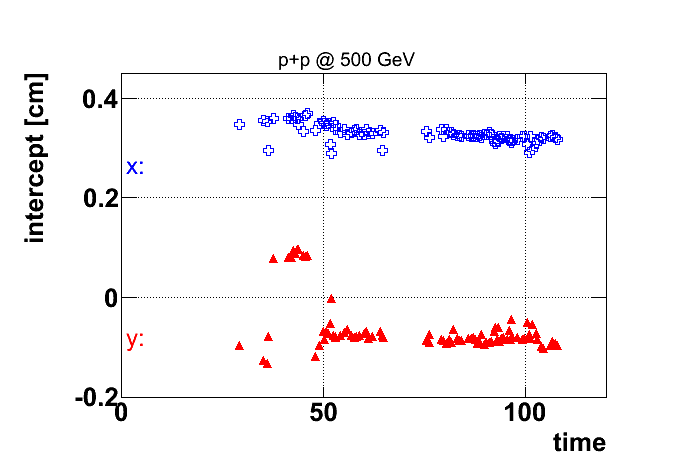
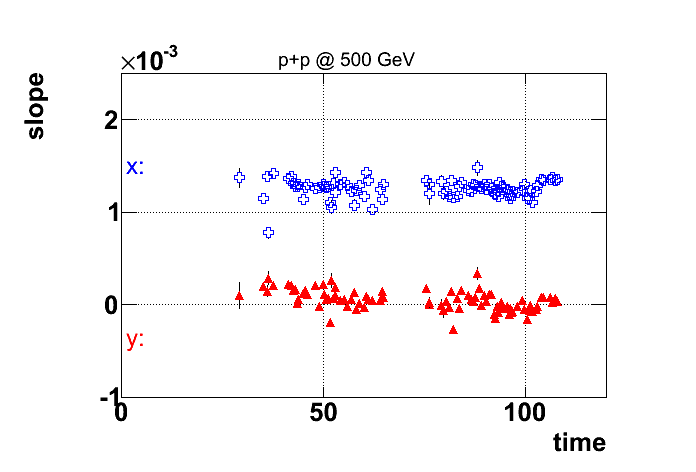
Run 12
pp200:
Preliminary values using TPC Twist ntuples
..to come...
pp500:
...to come...
UU193:
Problems observed in the P12ic preview production
Beam Angle Scan
During the RHIC low luminosity fill on March 5, 2012, the angle of the beams was changed (direction and particular beam not indicated to me). I was told that this occurred during Run 13065043, and according the Electronic ShiftLog, this was a 200 μrad angle change. At these small angles, using radians for the angle θ = sinθ = tanθ = slope. I used run 13065041 as a comparison for before the angle was changed and found the following:
Cuts: events with offline trigger ID=11, primary vertex has at least one daughter with a matching BEMC hit, |vZ|<100 cm, r=√(x2+y2)<4 cm.
Results (errors are statistical only; statistics are number of vertices passing the cuts; units are [cm] or unitless):
| run | statistics | x0 | dx/dz | y0 | dy/dz |
|---|---|---|---|---|---|
| 13065041 | 49971 | 0.06417 ± 0.00051 | 0.001385 ± 0.000016 | 0.06132 ± 0.00077 | 0.000057 ± 0.000015 |
| 13065043 | 101085 | 0.06400 ± 0.00050 | 0.001381 ± 0.000013 | 0.06098 ± 0.00057 | 0.000030 ± 0.000014 |
| Differences | 0.00016 ± 0.00071 | 0.000004 ± 0.000021 | 0.00034 ± 0.00096 | 0.000026 ± 0.000021 |
So while looking for a change in slope on the order of 200 μrad = 0.0002 in slope, I see no significant change in slope in the horizontal (dx/dz) plane to with an error which is an order of magnitude better precision than that angle (~0.000021, or ~21 μrad), and a change in the vertical plane which is only slightly over 1σ from zero (no change).
-Gene
Other details:
Processing details: I used the following BFC chain:
"VtxSeedCalG B2012 ITTF ppOpt l3onl emcDY2 fpd ftpc ZDCvtx NosvtIT NossdIT trgd hitfilt VFMinuit3 BEmcChkStat Corr4"
And I processed all events from these files:
/star/data03/daq/2012/065/13065043/st_physics_13065043_raw_4010001.daq
/star/data03/daq/2012/065/13065043/st_physics_13065043_raw_5010001.daq
/star/data03/daq/2012/065/13065041/st_physics_13065041_raw_3010001.daq
/star/data03/daq/2012/065/13065041/st_physics_13065041_raw_4010001.daq
/star/data03/daq/2012/065/13065041/st_physics_13065041_raw_5010001.daq
The choice of offline trigger ID=11 excludes laser events in run 13065041, which had offline trigger ID=1, though only a single laser event passed the other cuts on BEMC matches and |vZ|.
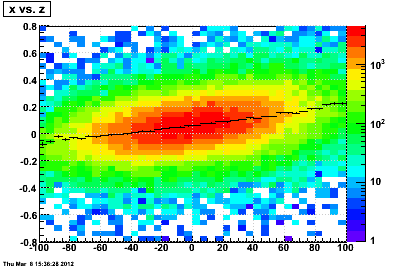
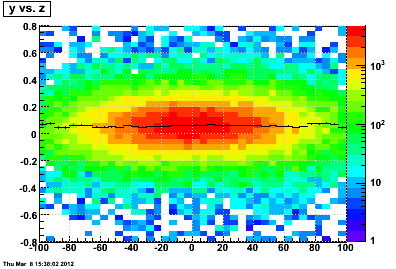
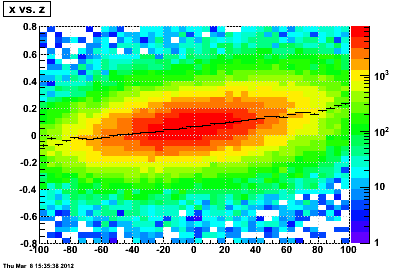
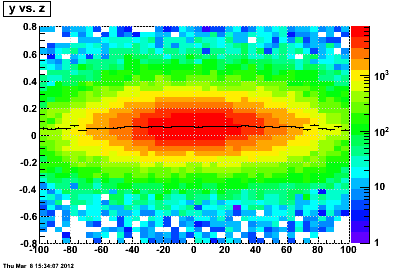
The choice of requiring a single BEMC match was motivated by these plots of BEMC matches vs. vertex rank (run 13065041 in the first plot, then run 13065043 in the second plot), showing that vertices without any BEMC matches are characteristically different (note: the plots saturate such that greater than 7 BEMC matches is set equal to 7). I saw no reason for otherwise excluding low-ranked, or low-multiplicity vertices. Low-quality events are anyhow considered by using the vertex-finer-assigned errors on reconstructed position εx,y when fitting for the BeamLine.
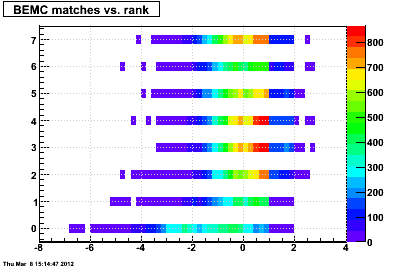
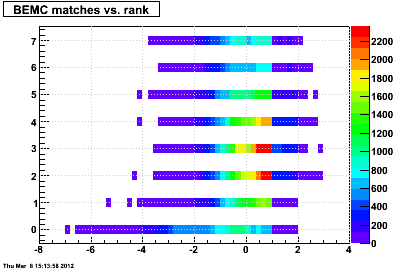
Here are plots of x and y vs. z (note the logarithmic color scale, units are [cm]), weighted by 1/εx and 1/εy respectively, and the histogram profile (including errors-on-the-mean) overlaid in black (note that there is a cut on r=√(x2+y2)<4 cm, which is used in the profile determination; i.e. the profiles are not made from the drawn 2D plots which would inherently restrict restriction to |x,y|<0.8 cm).
Run 13065041:
Run 13065043:
UU193
Cuts used:
- st_centralpro files where available (all but the first 4 fills)
- rank > -3.8
- highest ranked vertex in the event (index==0)
- # of daughters > 1000 (mult>1000)
Here are the results for 61 fills:
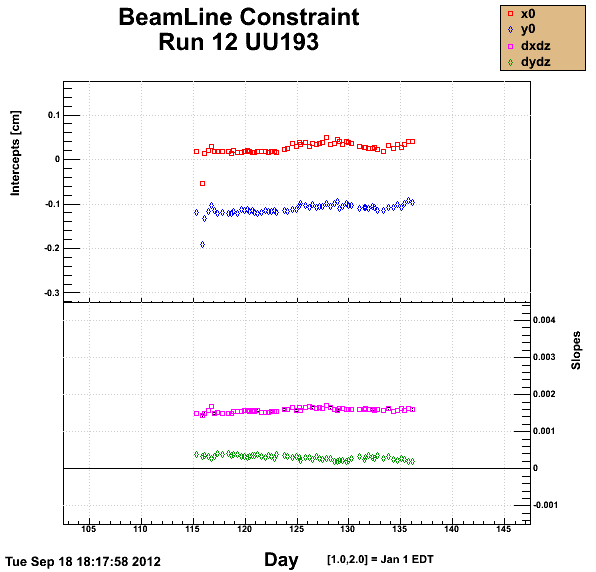
I was a little concerned about the notably different intercepts for the second fill (16779), but this was a very low luminosity fill with 12x12 bunches and looking at the individual vertices I found the half mm shift to be consistent across all z, independent of luminosity or multiplicity, so I left this point in. I don't think there's any UPC data until the fourth fill (16780) anyhow.
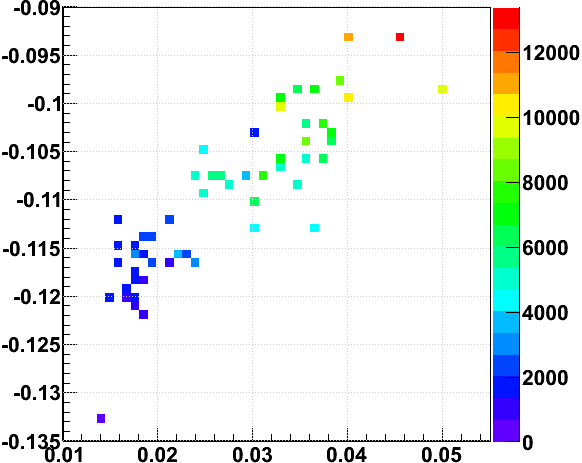
It should be noted that some luminosity depedence is still believed to exist in this data, most likely from remaining uncorrected luminosity-dependent distortions in the TPC. This has been documented elsewhere, but the below plot shows the intercepts from the above data color-coded by luminosity to demonstrate that a correlation remains at the level of ~0.05 cm (half a mm). NB: available for luminosity in the ntuples was the average of the ZDC coincidence rates from events used, though some of the ZDC-based rates are also known to have issues, and were not used in the TPC luminosity-dependent distortion corrections.
-Gene
Run 13
pp510
Preliminary look (high luminosity)
Preliminary look at low luminosity
A relevant look at Run 13 Beam Position Monitor (BPM) data
_____________
Periods of relevance for calibrations:
1) days 74-101
2) days 102-128
3) days 129-161
Results for period 2
Presentation on results for periods 1 and 2
Run 15 pAu200
Preliminary calibration (no tilt, from HFT):- Xin Dong determined the position of the beam spot at z=0 in global coordinates (see the last result on this page: VPDMB purity check and vertex position check for pAu 200 GeV)
Run 15 pAu200 preliminary 2
Final calibration?
Run 15 pAu200 preliminary 2
The first preliminary calibration, using HFT only, found (x0,y0) = (0.096 ± 0.009, -0.272 ± 0.009), using a production of data from run 16125048. The HFT cannot, however, determine a beam tilt. Using the same data, with TPC-found primary vertices, I find similar (x0,y0) = (0.105 ± 0.007, -0.278 ± 0.007), which essentially agrees within errors.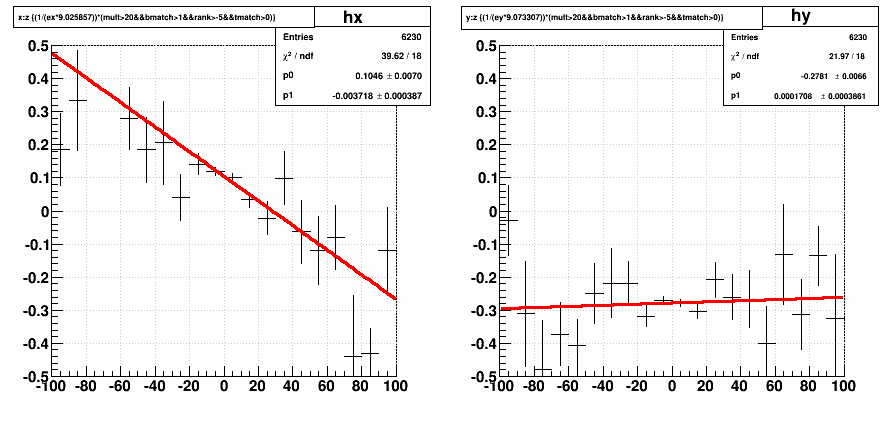
The agreement gave me some confidence in the cuts I was using to remove pile-up:
- multiplicity > 20
- BEMC matches > 1
- TOF matches > 0
- rank > -5
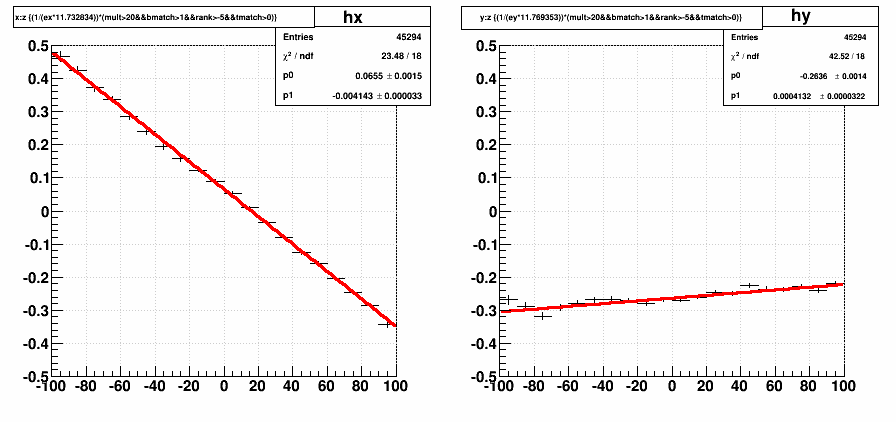
Given the higher confidence in HFT results due to the absence of systematics from the TPC (e.g. pile-up, distortions), I will enter in the database the (x0,y0) from the HFT-based calibration, but the slopes from the TPC-based calibration: dx/dz = -0.00414 ± 0.00003, dy/dz = 0.00041 ± 0.00003.
-Gene
Run 15 pp200
Preliminary calibration (no tilt, from HFT):- Xin Dong determined the position of the beam spot at z=0 with respect to the center of the PXL (see the "all triggers" result of this page: Run15 pp 200 GeV beam position check)
- Transforming this to global coordinates results in (x0,y0) = (0.01,-0.24)
Run 15 pp200 preliminary 2
Final calibration?
Run 15 pp200 preliminary 2
The first preliminary calibration, using HFT only, found (x0,y0) = (0.01, -0.24), using a production of data from run 16048027. The HFT cannot, however, determine a beam tilt. Using the same data, with TPC-found primary vertices, I find similar (x0,y0) = (0.002 ± 0.003, -0.259 ± 0.003), which is only different by ~1/5th of a mm. I find slopes of dx/dz = -0.00040 ± 0.00007, and dy/dz = 0.00045 ± 0.00007. As I did for the pAu preliminary calibration, I will use the HFT-found intercepts, and the TPC-found slopes.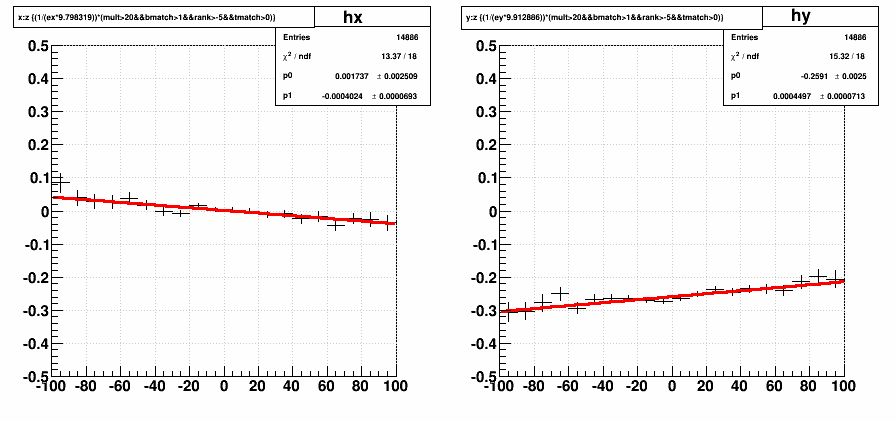
-Gene
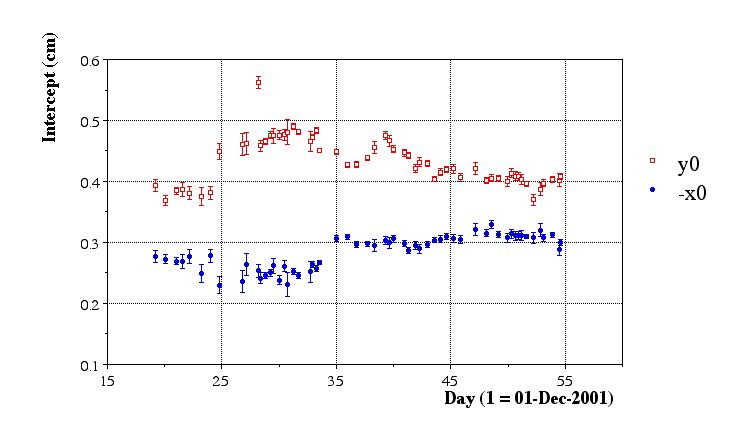
Run 2 (200 GeV pp)
Finding primary vertex seeds
What is done to find the seeds
Pass 1
In this pass, the seed finding was done on a per-run basis. Only one file sequence per run was chosen. Here are the results of the preliminiary aggregate fits:
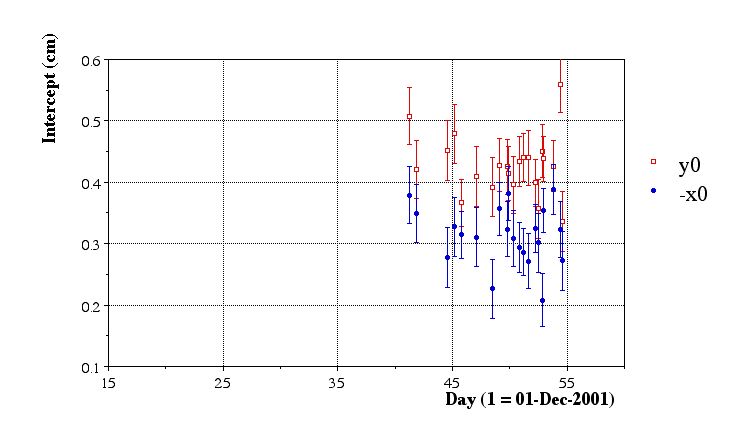
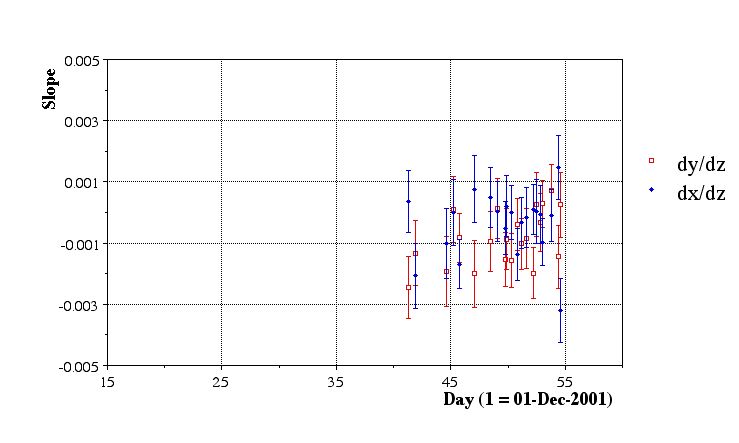
Issues:
- Statistics are insufficient
- Variations are large, but likely due to poor statistics
Pass 2
For the second pass, it was clear that the main issue was to improve statistics. In order to achieve this, several file sequences per run must be done. To take this even further, one calibration per fill of the accelerator would allow for the aggregation of many file sequences with the minimal segmentation of calibration periods. So a method was developed to perform this aggregation on a per-fill basis.
- Preliminary pass
- Here are the results of the preliminiary aggregate fits:
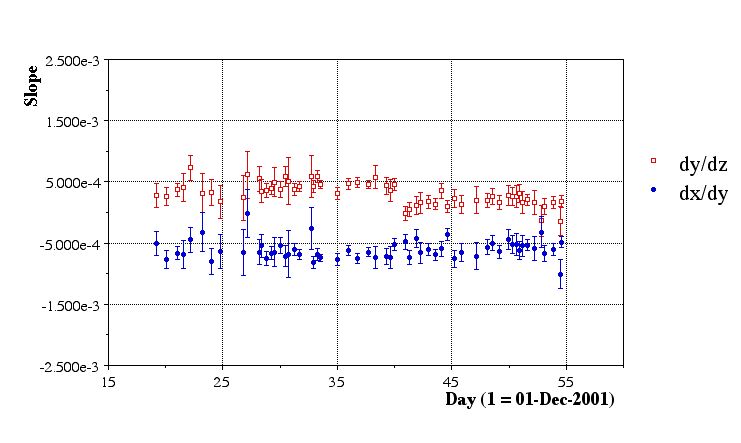
Issues:
- Fill 2075 (20011224.051426) has only one run (2358013), which in turn has only 18 files. All file sequences from this run need to be done to get a good calibration.
- Fill 1982 (2001??) and Fill 1997 consisted of very short runs (2350028, 2350036, and 2352018) which were BBC triggers anyhow. Best ignored.
- Fill ? (20020105.194730) had several bad runs (few reconstructed vertices in runs 3005020, 3005021, 3005022), but the runlog says that the inner field cage was off. Run 3005023 looked OK, but this fill is best ignored.
Final Pass
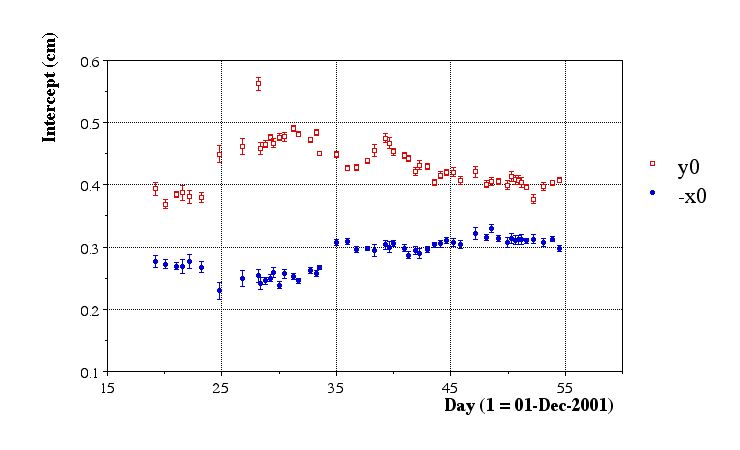
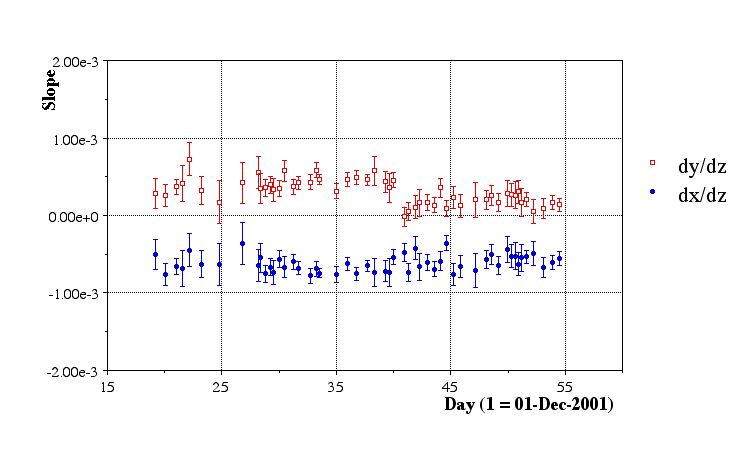
- Here are the results of the final aggregate fits:
Issues:
- Fill 2102 (20011228.085448, runs 236062-2362078) appears to be legitimately offset in y. Stastistics are high, errors are reasonable, and chisq/dof is close to 1.
- There are some clear systematics of the beam line moving around. We should compare to what information the RHIC people have.
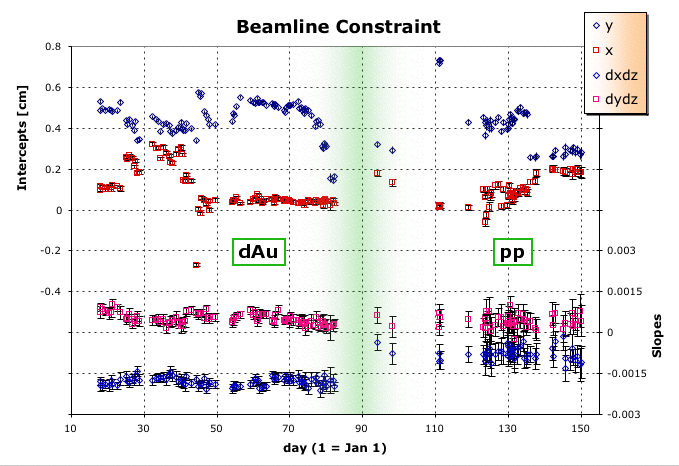
Run 3 (200 GeV dAu and pp)
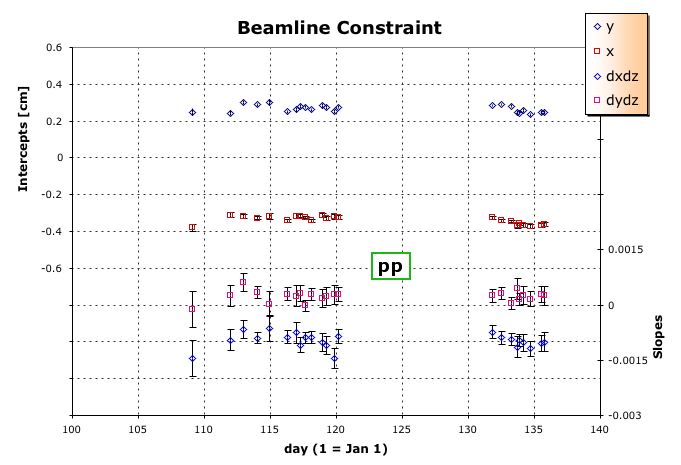
Run 4 (pp)
Run 5
2005 Beamline Calibration
Information about how this calibration is done, and links to other years, can be found BeamLine Constraint.
With the large number of special triggers in the 2005 pp data, I need to be judiscious about running the calibration pass. I want to be sure that the triggers I use do not bias the position of the reconstructed vertex in the transverse plane for a given z. As the DAQ files come and go quickly from disk, I also wanted to be able to do this study from the event.root and/or MuDst.root files on disk.
Using event.root and MuDst.root files
It would be nice to use the already-produced event.root files from FastOffline to do the beamline calibration. The first question to ask is, was the chain used for FastOffline sufficient for doing this?
FastOffline has been running with the following chain:
P2005 ppOpt svt_daq svtD EST pmdRaw Xi2 V02 Kink2 CMuDst OShortR
This causes StMagUtilities to run with the following options:
StMagUtilities::ReadField Version 2D Mag Field Distortions + Padrow 13 + Twist + Clock + IFCShift + ShortedRing
I believe these are indeed the distortion corrections we want turned on (no SpaceCharge or GridLeak, whose distortions should smear, but not bias the vertex positions).
Our old BFC chain for doing this calibration was:
ppOpt,ry2001,in,tpc_daq,tpc,global,-Tree,Physics,-PreVtx,FindVtxSeed,NoEvent,Corr2
The old chain uses Corr2, but we're now using Corr3. The only difference between these is OBmap2D now, versus OBmap then, which is a good thing. Also, we now have the svt turned on, but it isn't used in the tracks used to find the primary vertex (global vs. estGlobal). So this is no different than tpc-only. I have not yet come to an understanding of whether PreVtx (which is ON for the FastOffline chain) would do anything negative. At this point, it seems acceptable to me.
In order to use the FastOffline files, I modified StVertexSeedMaker to be usable for StEvent (event.root files) in the form of StEvtVtxSeedMaker, and MuDst (MuDst.root files) in StMuDstVtxSeedMaker. The latter may be an issue in that it introduces a dependency upon loading MuDst libs when loading the StPass0CalibMaker lib (add "MuDST" option to chain).
Testing trigger biases
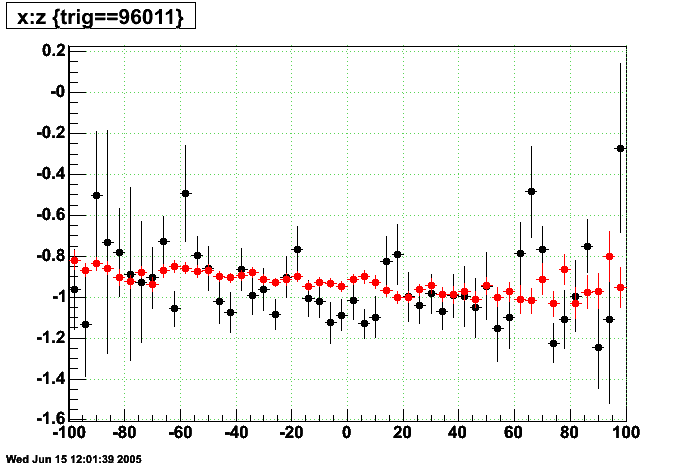
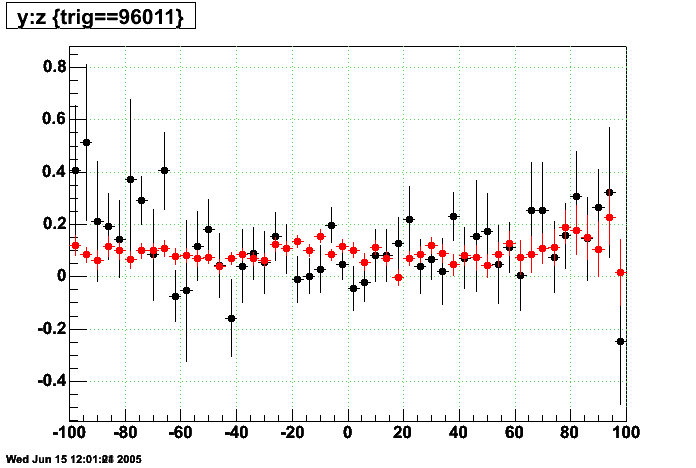
Using the FastOffline files, I wanted to see which triggers would be usable. There is the obvious choice of the ppMinBias trigger. But these are not heavily recorded: there may be perhaps 1000 per run. So fills with just a few runs may have insufficient stats to get a good measure of the beamline. Essentially, ALL ppMinBias triggers would need to be examined, which means ALL pp files with these triggers! While performing the pass on the data files does not take long, getting every file off HPSS and providing disk space would be an issue. Discussions with pp analysis folks gave me an indication that several other triggers may lead to preferential z locations of collision vertices (towards one end or the other), but no transverse biases. This is acceptable, but I wanted to be sure it was true. I spent some time looking at the FastOffline files to compare the different triggers, but kept running into the problem of insufficient statistics from the ppMinBias triggers (the prime reason for using the special triggers!). Here's an example of a comparison between the triggers:
X vs. Z, and Y vs. Z:
(black points are profiles of vertices from ppMinBias triggers 96011, red are special triggers 962xx, where xx=[11,21,33,51,61,72,82])
First Calibrations pass
Using minbias+special triggers from about 1000 MuDst files available on disk, here's what we get:
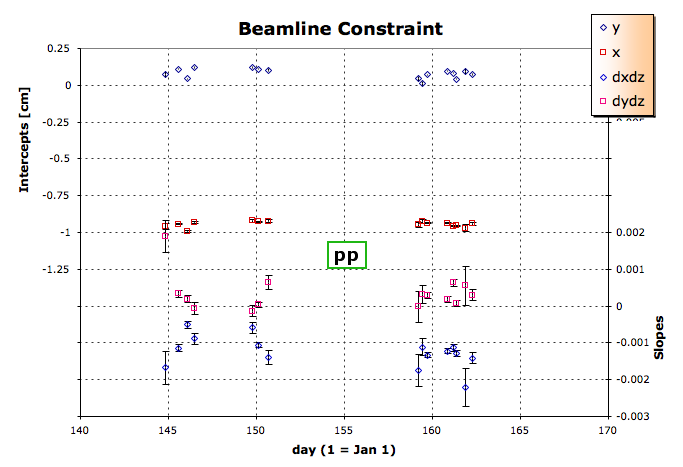
This can be compared to similar plots for Run 4 (pp), Run 3 (200 GeV dAu and pp), and Run 2 (200 GeV pp).
The trigger IDs I used were:
96201  :     bemc-ht1-mb
96211  :     bemc-ht2-mb
96221  :     bemc-jp1-mb
96233  :     bemc-jp2-mb
96251  :     eemc-ht1-mb
96261  :     eemc-ht2-mb
96272  :     eemc-jp1-mb-a
96282  :     eemc-jp2-mb-a
96011  :     ppMinBias
20     :     Jpsi
22     :     upsilon
Calibrating the current pp data for 2005 will mean processing about 5000 files, daq or MuDst.
Full Calibrations pass
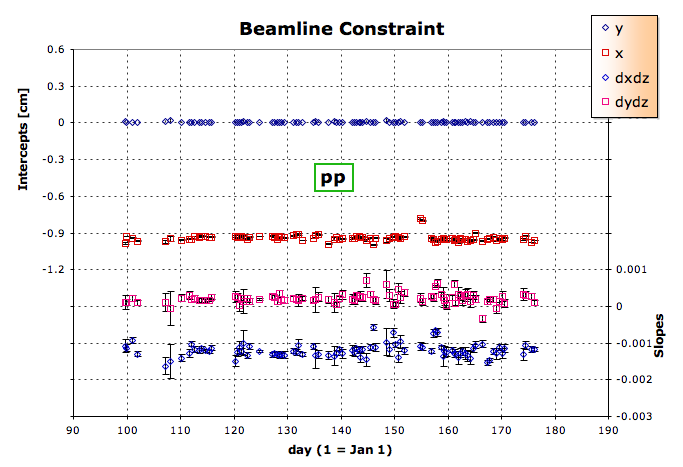
To make sure we had all the final calibrations in place (TPC drift velocity in particular), we ran the calibration pass over the DAQ files. This produced the following intercepts and slopes from the full pass and aggregation:


I removed a few outliers and came up with this set, which went into the DB:

Jerome reminds me that we are still missing the high energy pp run, sqrt(s)=410 GeV. Lidia reminds me we are missing the ppTrans data. So, I did those two and added a few statistics to fills we had already done. The result is this:
mktxt2005.txt
#!/bin/csh

set sdir = ./StarDb/Calibrations/rhic
set tdir = ./txt
set files = `ls -1 $sdir/*.C`
set vs = (x0 err_x0 y0 err_y0 dxdz err_dxdz dydz err_dydz stats)
set len = 0
set ofile = ""
set dummy = "aa bb"

# Necessary instantiation to make each element of oline a string with spaces
set oline = ( \
  "aa bb" "aa bb" "aa bb" "aa bb" "aa bb" "aa bb" "aa bb" "aa bb" "aa bb" "aa bb" \
  "aa bb" "aa bb" "aa bb" "aa bb" "aa bb" "aa bb" "aa bb" "aa bb" "aa bb" "aa bb" \
  "aa bb" "aa bb" "aa bb" "aa bb" "aa bb" "aa bb" "aa bb" "aa bb" "aa bb" "aa bb" \
  "aa bb" "aa bb" "aa bb" "aa bb" "aa bb" "aa bb" "aa bb" "aa bb" "aa bb" "aa bb" \
  "aa bb" "aa bb" "aa bb" "aa bb" "aa bb" "aa bb" "aa bb" "aa bb" "aa bb" "aa bb" \
  "aa bb" "aa bb" "aa bb" "aa bb" "aa bb" "aa bb" "aa bb" "aa bb" "aa bb" "aa bb" \
  "aa bb" "aa bb" "aa bb" "aa bb" "aa bb" "aa bb" "aa bb" "aa bb" "aa bb" "aa bb" \
  "aa bb" "aa bb" "aa bb" "aa bb" "aa bb" "aa bb" "aa bb" "aa bb" "aa bb" "aa bb" \
  "aa bb" "aa bb" "aa bb" "aa bb" "aa bb" "aa bb" "aa bb" "aa bb" "aa bb" "aa bb" \
  "aa bb" "aa bb" "aa bb" "aa bb" "aa bb" "aa bb" "aa bb" "aa bb" "aa bb" "aa bb" \
  )

set firstTime = 1
set newString = ""
foreach vv ($vs)
  set ofile = $tdir/${vv}.txt
  touch $ofile
  rm $ofile
  touch $ofile
  set va = "row.$vv"
  set fnum = 0
  foreach file ($files)
    @ fnum = $fnum + 1
    set vb = `cat $file | fgrep $va`
    set vc = $vb[3]
    @ len = `echo $vc | wc -c` - 1
    set vd = `echo $vc | colrm $len`
    echo $vd >> $ofile
    if ($firstTime) then
      set newString = "$vd"
    else
      set newString = "${oline[${fnum}]} $vd"
    endif
    set oline[$fnum] = "$newString"
  end
  set firstTime = 0
end


set ff = (date.time days)
set vf
foreach fff ($ff)
  set vg = $tdir/${fff}.txt
  set vf = ($vf $vg)
  touch $vg
  rm $vg
  touch $vg
end

set ofile = ${tdir}/full.txt
touch $ofile
rm $ofile
touch $ofile

set days = 0
set frac = 0
set fnum = 0
foreach file ($files)
  @ len = `echo $file | wc -c` - 18
  set dt = `echo $file | colrm 1 $len | colrm 16`
  set year = `echo $file | colrm 1 $len | colrm 5`
  @ len = $len + 4
  set month = `echo $file | colrm 1 $len | colrm 3`
  @ len = $len + 2
  set day = `echo $file | colrm 1 $len | colrm 3`
  @ len = $len + 3
  set hour = `echo $file | colrm 1 $len | colrm 3`
  @ len = $len + 2
  set min = `echo $file | colrm 1 $len | colrm 3`
  @ len = $len + 2
  set sec = `echo $file | colrm 1 $len | colrm 3`

  set modi = 0
  # Feb has 28 = 31-3 days (this is a leap year)
  if ($month > 2) @ modi += 2
  # Apr,Jun,Sep,Nov have 30 = 31-1 days
  if ($month > 4) @ modi += 1
  if ($month > 6) @ modi += 1
  if ($month > 9) @ modi += 1
  if ($month > 11) @ modi += 1
  echo $modi

# convert to seconds since 01-Jan-2005 EST (5 hours behind GMT)
  @ year = $year - 2005
  @ month = ($month + ($year * 12)) - 1
  @ day = $day + ($month * 31) - $modi
  @ hour = ($hour + ($day * 24)) - 5
  @ min = $min + ($hour * 60)
  @ sec = $sec + ($min * 60)

# convert to days since 01-Jan-2005 EST (5 hours behind GMT)
  @ days = $sec / 86400
  @ sec = $sec - ($days * 86400)
  @ frac = ($sec * 10000) / 864
  set fra = "$frac"
  set len = `echo $fra | wc -c`
  @ len = 7 - $len
  while ($len > 0)
    set fra = "0${fra}"
    @ len = $len - 1
  end

  echo $dt >> $vf[1]
  echo ${days}.$fra >> $vf[2]

  @ fnum = $fnum + 1
  echo "${days}.$fra ${oline[${fnum}]} $dt" >> $ofile
end
queryNevtsPerRun.txt
-- N evts per run, where N is the numerator at the end of the last line

select floor(bi.blueFillNumber) as fill,
sum(ts.numberOfEvents/ds.numberOfFiles) as gdEvtPerFile,
ds.numberOfFiles,
sum(dt.numberOfEvents*ts.numberOfEvents/ds.numberOfEvents) as gdInFile,
dt.file, rd.glbSetupName
--
--
from daqFileTag as dt
left join l0TriggerSet as ts on ts.runNumber=dt.run
left join runDescriptor as rd on rd.runNumber=dt.run
left join daqSummary as ds on ds.runNumber=dt.run
left join beamInfo as bi on bi.runNumber=dt.run
left join detectorSet as de on de.runNumber=dt.run
left join runStatus as rs on rs.runNumber=dt.run
left join magField as mf on mf.runNumber=dt.run
--
--
-- where (bi.blueFillNumber=3458 or bi.blueFillNumber=3459)
where rd.runNumber>6083000
and ds.numberOfFiles>1
and de.detectorID=0
and mf.scaleFactor!=0
-- USING pp-minbias triggers to identify nevents/file
and (ts.name='ppMinBias' or
     ts.name='bemc-ht1-mb' or ts.name='bemc-ht2-mb' or
     ts.name='bemc-jp1-mb' or ts.name='bemc-jp2-mb' or
     ts.name='eemc-ht1-mb' or ts.name='eemc-ht2-mb' or
     ts.name='eemc-jp1-mb-a' or ts.name='eemc-jp2-mb-a' or
     ts.name='upsilon' or ts.name='Jpsi')
-- and rs.shiftLeaderStatus=0
and rs.shiftLeaderStatus<=0
and bi.entryTag=0
-- USE DAQ100 filestreams
and ((dt.fileStream between 101 and 104) or (dt.fileStream between 201 and 204))
-- and dt.file like 'st_physics_6%'
-- USE these trigger setups
and (rd.glbSetupName='ppProduction' or rd.glbSetupName='ppProductionMinBias')
--
--
group by dt.file
having (@t4:=sum(dt.numberOfEvents*ts.numberOfEvents/ds.numberOfEvents))>60
and (@t3:=mod(avg(dt.filesequence+(10*dt.fileStream)),(@t2:=floor(sum(ts.numberOfEvents)/10000.0)+1)))=0
;
Run 6 (pp)
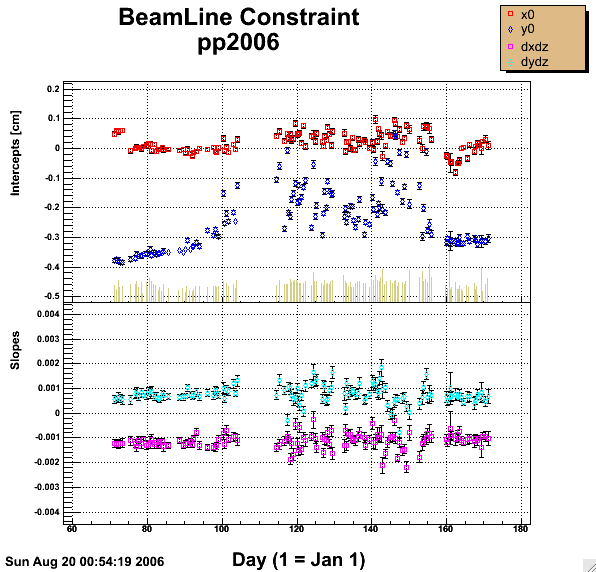

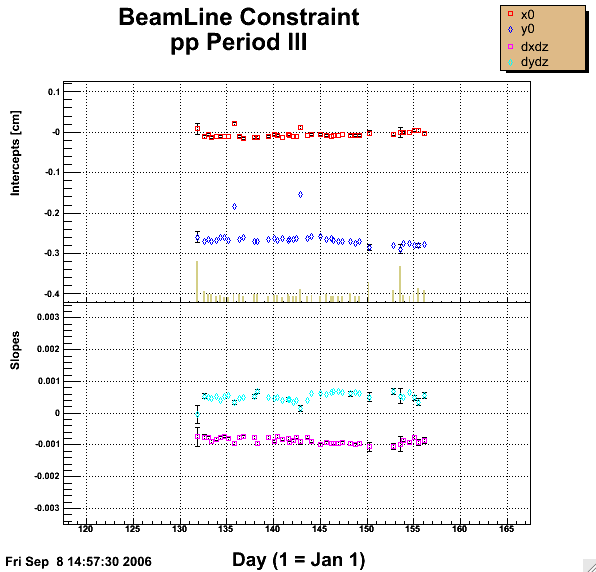
Run 6: Issues with 2006 BeamLine calibration
In order to get the zdc information, I averaged all zdc values of each run to use a a single value for each run. I plot here the average for each day just for demonstration.
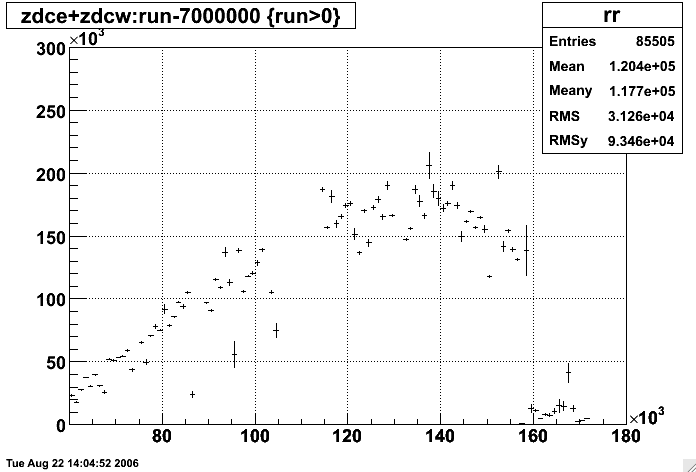
I will focus only on the 200 GeV running for now (periods I-III, up to day 157).
The first thing I looked at was my calibrated y-intercept of the beamline constraint vs. zdc and zdc vs. fill number (which is pretty similar to the above plot), where zdc is averaged by Sum{zdc[run] * N_verts[run]} / N_verts[all]. In these plots, the color represents the run period: blue=I, red=II, black=III:
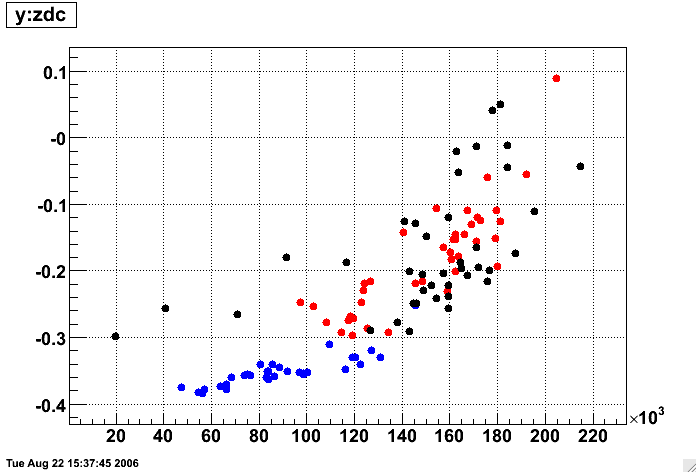
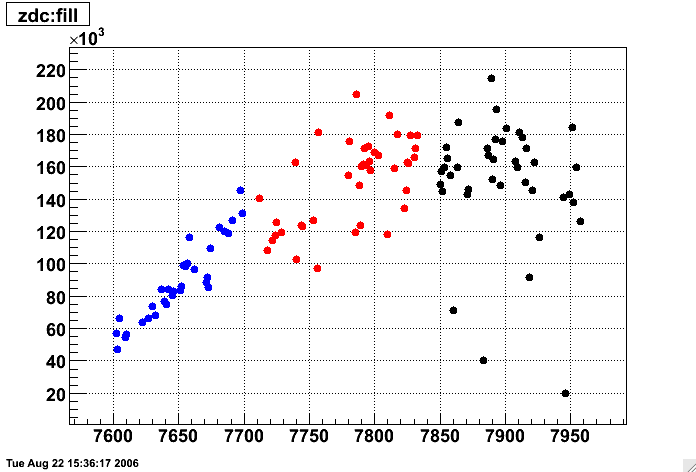
It is clear from these plots that there IS some correlation between y and zdc rate for all three periods. The first period also shows a strong correlation between zdc rate and fill (the RHIC luminosity was increasing as time progressed, and the luminosity plateaued for subsequent running). This information by itself is not enough to say whether there is a distortion in the TPC; it could simply mean that there is a correlation between how much luminosity the collider delivers and the vertical position of the beam, which is not all that unlikely.
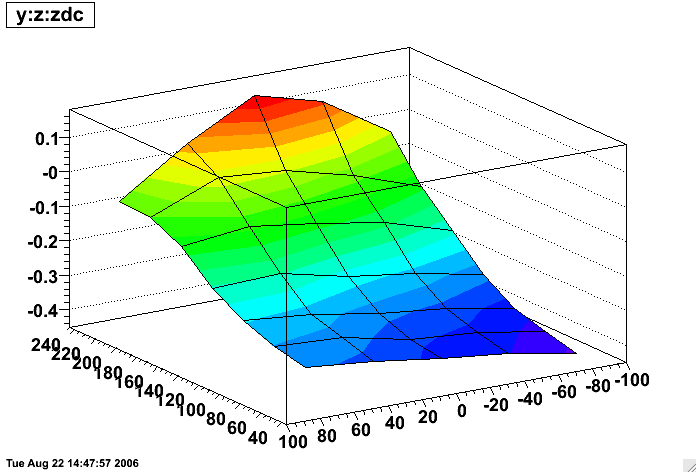
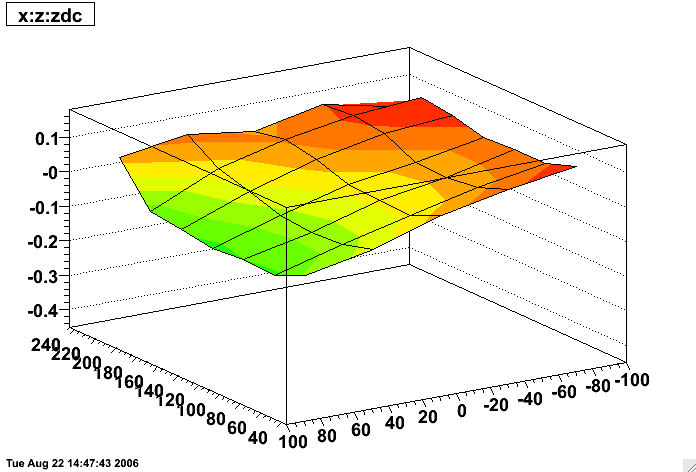
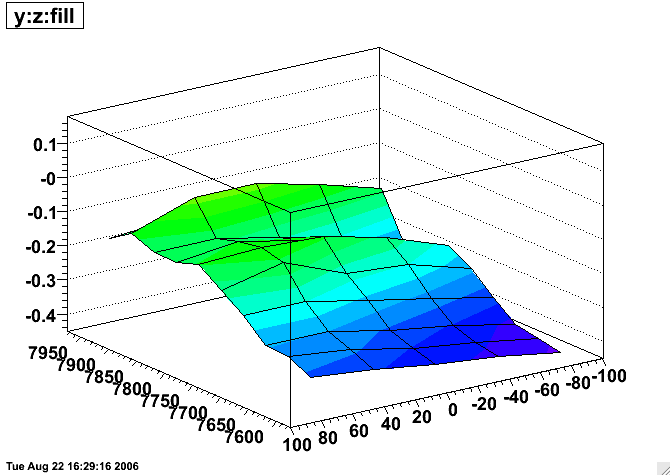
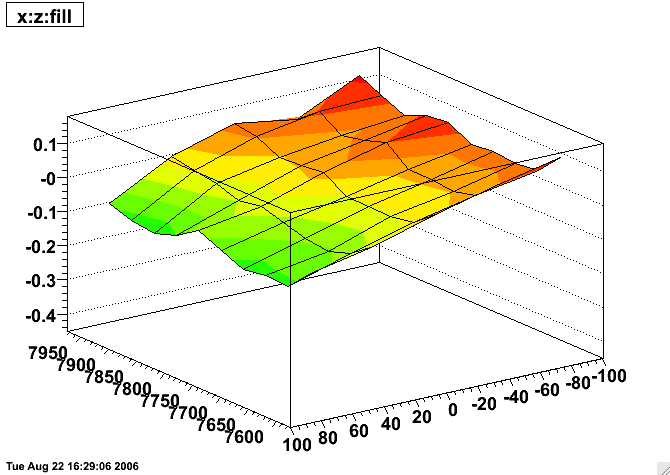
To investigate further, I created an ntuple with all the vertices used in the beamline calibrations and stored the fill number and zdc rate for each reconstructed vertex. Normally, the beamline is found by simply projecting the vertex positions onto plots of y vs. z, and x vs. z and fitting straight lines. But now I can plot differentially vs. zdc or fill, as I have done in the next 4 plots. In each plot, a single slice in zdc is a profile of y vs. z or x vs. z. The plots have z of the reconstructed vertices on the lower right horizontal axis, zdc rate divided by 1000 (or fill number ) on the lower left horizontal axis, and the profile of y for the vertical axis, and the scales are held identical for all four plots.
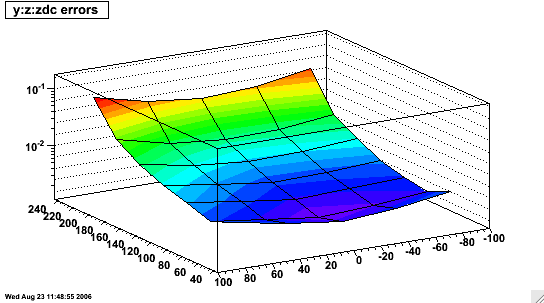
For some idea of the errors on these data, here is the error plot for the y:z:zdc plot (the x:z:zdc errors are nearly identical):
Here is another plot of the the y vs. z data and its profile for low and high zdc rates where one can gain some perspective on the true spread of the data and the scale of the profile relative to it.
These plots show several points:
- x vs. z has essentially no dependence on fill, and has perhaps a small correlation with zdc
- y vs. z looks nicely linear at the lowest luminosities (which also correspond to the earliest fills)
- y vs. z shows a mild increase with early fill numbers, but not as clear a correlation with later fills
- y vs. z shows a dramatic increase with zdc rate
- y vs. z shows a modification from linearity with zdc rate, appearing to bulge at z values near the center of the TPC
These plots possibly suffer to some degree from overlapping different run periods where different beam tunes were actually quite likely (the trade off is that they get improved statistics). So the next set of plots show y and x vs. zdc by period (arranged as periods I, II, III from top to bottom):
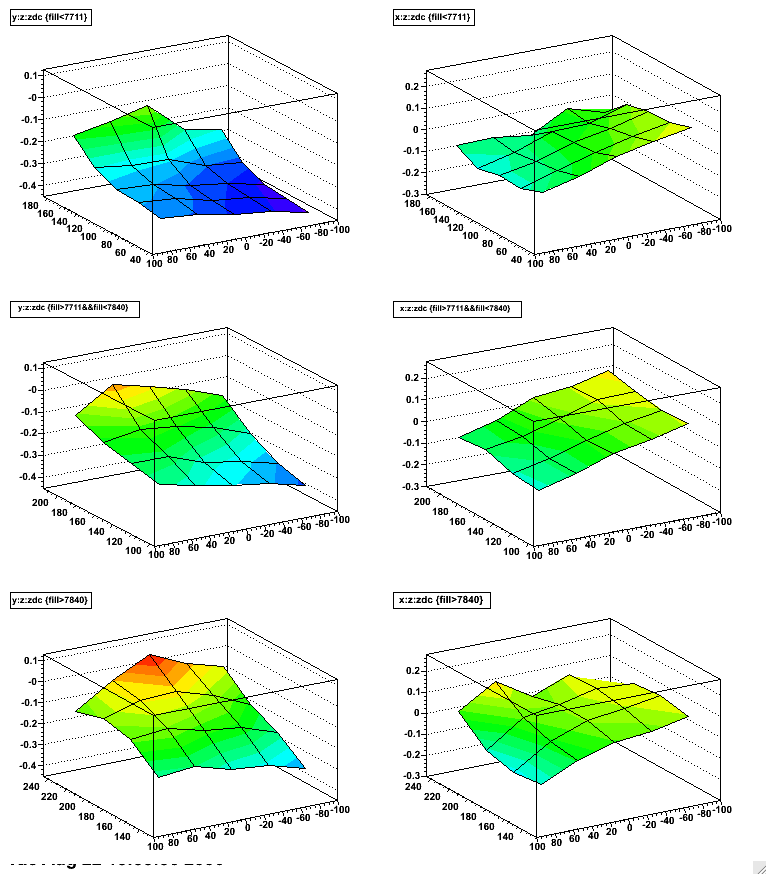
The above plots make it more clear that all three periods appear to have a z dependence to their y vs. z profiles at the highest luminosities recorded during those periods (NOTE: luminosities may actually extend both higher and lower than the plot axes, but have insufficient statistics to add appreciable information to the plots and have been cropped).
DISCUSSION:
The z dependence of the reconstructed vertices at high luminosity is a red flag that this is likely to be a distortion issue in the TPC (e.g. SpaceCharge whose distortion is largest for tracks near the central membrane). A hypothesis is that this is the old issue of particles going through just one side of the TPC from some kind of beam background. An interesting question is where the background must be to produce this effect. Azimuthally symmetric SpaceCharge (in full field data, not reveresed full field) causes tracks at positive x to want a vertex which is higher vertically, while tracks at negative x want a lower vertex; the effects should cancel. In order to raise the vertical position of the primary vertex, there would either need to be more of the standard SpaceCharge distribution at positive x (3 o'clock in the TPC), or a buildup of ionization only at either low radius (near the IFC) or large radius (near the OFC) at negative x (9 o'clock in the TPC). The former would mean simply an increased rotation of tracks at positive x due to the standard SpaceCharge distribution. The latter would actually be a decrease in the rotation of tracks at negative x, thereby failing to fully counter the effects of SpaceCharge at positive x. There could also be any combination of these three:
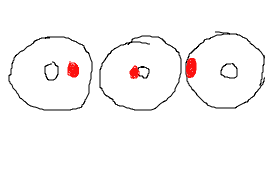
The third possibility may be the most intriguing as it may most closely match the backgrounds which have been documented in the past. It should also be stated clearly that reality could be a combination of a distortion and real shifts in the beam position as delivered by the collider. We want to correct for any of the former, and measure/calibrate any of the latter.
_________
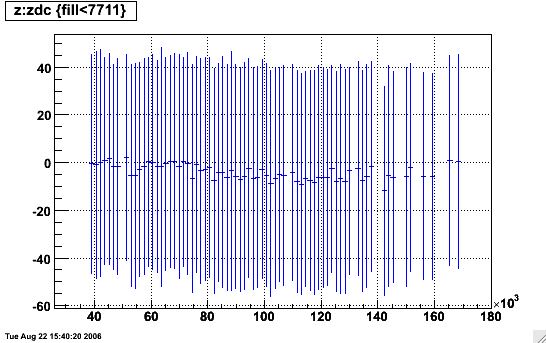
As supplementary information, here are the z distributions ("profs" - spread profile) of vertices as a function of zdc in periods I, II, and III, showing that althought the mean position changes somewhat with run period, the distribution is rather stable as a function of zdc.
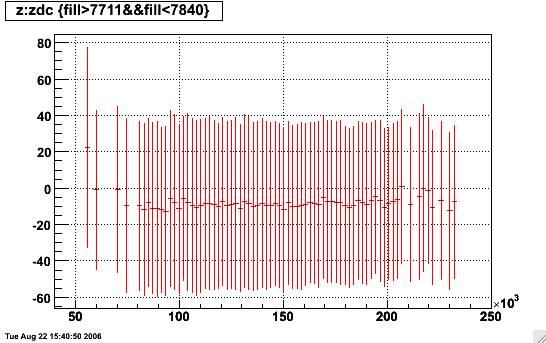
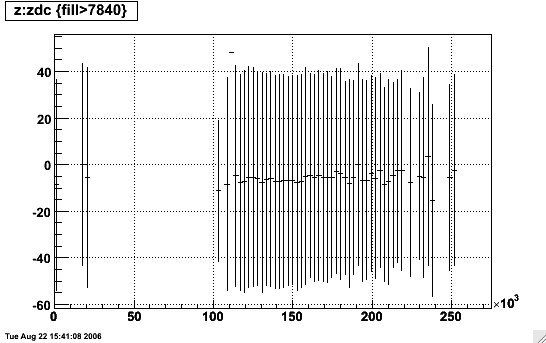
Update on 2006 issues
FINDINGS:
BeamLine position does move with SpaceCharge(+GridLeak) correction. Here I plot the BeamLine constraint as a function of turning on the SpaceCharge correction 10% at a time:
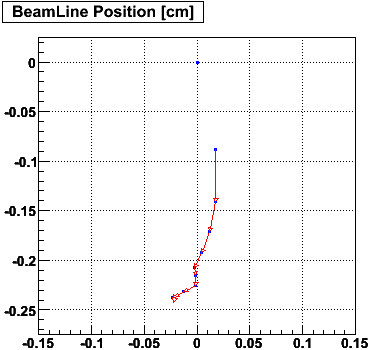
The cause appears to be the Minuit Vertex Finder exhibiting something like a (x,y) = (0,0) bias which gets worse when the distortion corrections are not proper. To demonstrate this, I plot the beamline position as reconstructed using SpaceCharge,GridLeak,ShortedRing-corrected data (left) and uncorrected data (right). The center point in each plot is the "as-is" reconstructed beamline x and y intercepts. I shift all the hits in the TPC by +/-0,1,2 mm in x and y and re-calibrated the BeamLine for each shift. The blue dots represent those shifts given to the TPC hits, while the arrowheads point at the value that comes from the calibration for the respective shifts. Some bias appears to remain even with the calibrations in place, but the bias is clearly stronger for uncorrected data.
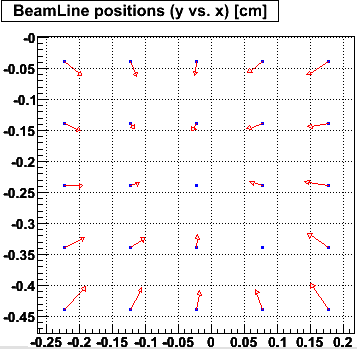
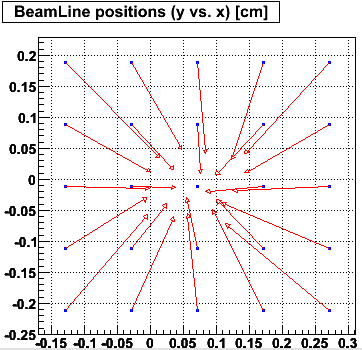
In this case, the uncorrected data is actually using calibrations as they were in June when the BeamLine calibration was originally done: no SpaceCharge, and only a partial Shorted Ring correction.
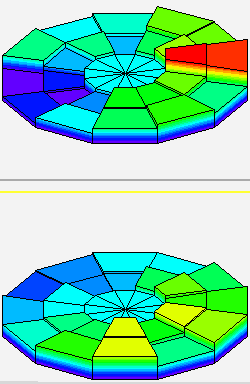
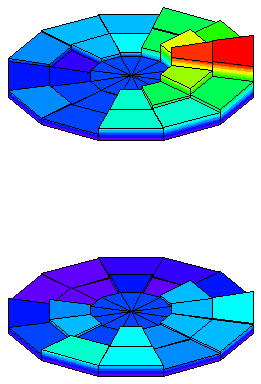
A few more things can be learned from the data by excluding sections of the TPC. In these plots, I show sector positions as they are in the TPC, divided into 12 supersectors with inner (padrows 1-12) and outer (padrows 14-45) subsectors. Each bin then represents the y-intercept of the beamline when I EXCLUDE the vertices which have any tracks passing through that part of the TPC. I include in text below the plot the y-intercepts for the minimum and maximum shown in the plots, and for the FULL TPC (not excluding any vertices). I can exclude some sectors simultaneously too. EAST IS ON TOP, WEST IS ON BOTTOM (unless I tied east and west exclusion together, so I only show one plot). The disc in the center of each plot represents the FULL TPC position for comparison.
First, using the corrections as they were in June, one can clearly see the effect caused by uncorrected SpaceCharge:
| Uncorrected | July corrections | August corrections | 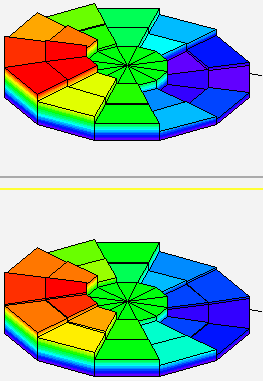 |
 |
 |
Full TPC y = -0.060040 +/- 0.009377 Minimum y = -0.179608 Maximum y = 0.056453 |
Full TPC y = -0.266030 +/- 0.004800 Minimum y = -0.276851 Maximum y = -0.245626 |
Full TPC y = -0.259742 +/- 0.002232 Minimum y = -0.263649 Maximum y = -0.241834 |
|---|
In FullField data like this, SpaceCharge makes tracks rotate clockwise when viewed along the positive axis. So SpaceCharge-distorted tracks at positive x tend to want a higher vertex position, while ones at negative x want a lower vertex position. Therefore, excluding vertices which use tracks at positive x from uncorrected data will effectively lower the average vertex position, and vice versa for negative x. The uncorrected data is dominated by SpaceCharge, so both halves of the TPC look pretty much the same.
With Shorted Ring and SpaceCharge corrections as they were in July (SpaceCharge calibration had been done without the final Shorted Ring corrections), one can see that we were probably slightly over-correcting for this data, but not by much as the minimum and maximum were both within ~300 microns of using the whole TPC.
With the SpaceCharge+GridLeak re-calibrated using the final Shorted Ring corrections in place, the fully corrected plot now appears as in the August-corrections column above. The max-min diff has gone from 310 microns to 220 microns! And the west tpc (bottom) looks essentially flat: there is no distortion apparent in the beamline from the west TPC! The east still shows some remnant distortion. This could be due to either more SpaceCharge in the east than west, or due to not-quite-complete corrections of the shorted ring in the east TPC. Either explanation is viable.
These graphs also demonstrate that there is unlikely to be much contribution from misalignment of TPC (sub)sectors.
We can remove azimuthally symmetric distortions like our standard SpaceCharge+GridLeak and the Shorted Ring by tying together (excluding at the same time) opposing (in phi) subsectors of the TPC:
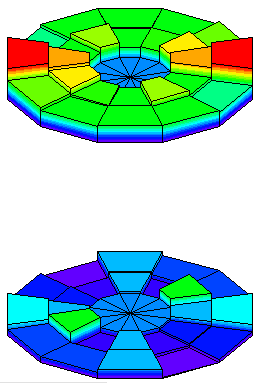
Full TPC y = -0.259742 +/- 0.002232
Minimum y = -0.263744
Maximum y = -0.243980
Here I think it is of interest to notice that the major cause for altered beamline in the east TPC is from the outer subsectors at 3 and 9 o'clock. Shorted ring distortions are primarily an inner sector effect and should not show up in this plot anyhow. This means that it is more likely to be due to additional ionization in the east TPC over the west.
We can also analyze the horizontal determination of the beamline.
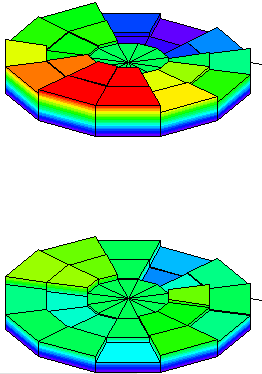
Full TPC x = -0.009712 +/- 0.002242
Minimum x = -0.018511
Maximum x = 0.000031
Again, more distortions in the east TPC. Overall max-min diff here is only 185 microns! It's curious that this is not symetric about 6 and 12 o'clock. Tying opposing subsectors shows something else:
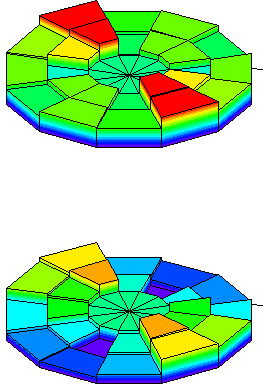
Full TPC x = -0.009712 +/- 0.002242
Minimum x = -0.015330
Maximum x = -0.002258
Both the east and west show something at 5 and/or 10 o'clock (and a bit at 4/10) contributing (minutely - were talking on the order of below 100 microns) to the horizontal position of the beam.
Run 7 (200GeV AuAu)
The interest of doing a beamline constraint for this data (200 GeV AuAu) has been expressed mainly for reconstructing UPC vertices. Perhaps there may be eventual interest in using it for very peripheral collisions as well (AuAu hadronic interactions with just a few participants).
Using minbias triggers from 206 fills starting with fill 8477 (day 95, April 5, 2007). The query used to find runs is attached.
- mb-vpd
- mb-zdc
Here are the results of the calibration pass:

I have studied dependencies on luminosity (none seen, I am using luminosity scaler-based corrections for SpaceCharge and GridLeak in the calibration passes), vertex ranking (none seen for ranking greater than -3), and multiplicity (none seen for multiplicities above 50). I also tested using the EbyE SpaceCharge+GridLeak correction method and there's no effect versus using the luminosity scaler-based method for this calibration.
There are some notable issues, particularly around days 143 (fills 8838-8845), 150 (fill 8878), and 156 (fill 8912). Fill 8912 in particular looks pretty bad, and I see particularly notable backgrounds in the BBC singles and ZDC east singles rates (which don't show up in the coincidence rates). Here's the log10 of BBC singles sum, with fill 8912 highlighted in red:

Another diagnostic for the quality of the data is to look at the spread of reconstructed vertices. So here are the mean (blue markers) and spread (red lines) of primary vertex x (top) and y (bottom) positions versus fill for vertices with abs(z) < 10cm (the black circles denote the locations of fills 8838-8845 and 8912, and the errors on the means are too small to be seen on these plots). Vertices have been weighted by sqrt(multiplicity).


There are a few with spreads of about 1mm or more, and I am still looking into these.
Dec. 8, 2007
The following fills have been dropped from use after studies:
8478 - large transverse spread in vertex reconstruction, using previous fill
8491 - large transverse spread in vertex reconstruction, using previous fill
8592 - odd slope, previous fill (8590) just as good
8761 - bogus fill number - using 8762
8838,8844,8845 - high backgrounds at start of RFF running, using next fill 8849
8878 - questionable backgrounds, using previous fill (8875)
8879 - large transverse spread in vertex reconstruction, using 8875 also
8890 - odd slope, previous fill (8889) just as good
8900,8901 - odd slope, previous fill (8897) just as good
8912 - high backgrounds, using previous fill
9024 - large transverse spread in vertex reconstruction, using previous fill
The remaining tables have been inserted into the DB, and the final plot of values is as follows:

Run 8 (200 GeV dAu and pp)
BeamLine for dAu
BeamLine for pp
This calibration work was discussed at two Software & Computing meetings (You do not have access to view this node,You do not have access to view this node). After resolving an issue with reading the triggers in early runs from before day 348 (December 14, 2007), the calibration was completed using the following "oval" cuts (the cut forms something like an oval curve in the mult vs. rank space) on the output ntuple from the StVertexSeedMaker code to avoid pileup vertex contributions:
"((rank+3)*(rank+3)/22.+(mult*mult/4900.))>1&&rank>-3&&zdc<5.5e5"
One additional note is that fill 9307 starting on November 30 looked like it might have some useful data, but I did not successfully get enough data to calibrate it. So I will use the next physics fill (9311) as the calibration for 9307 as well in case that data is used.
The result of the final calibration can be seen in this plot:
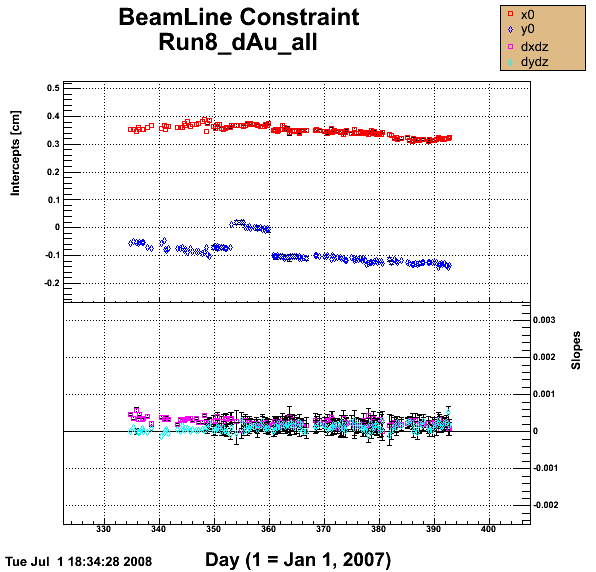
The query file to pick out runs is attached below.
The preliminary pp calibration was done using a simple rank and multiplicity cut:
"rank>-1&&zdc<2e5"
with results as seen here:
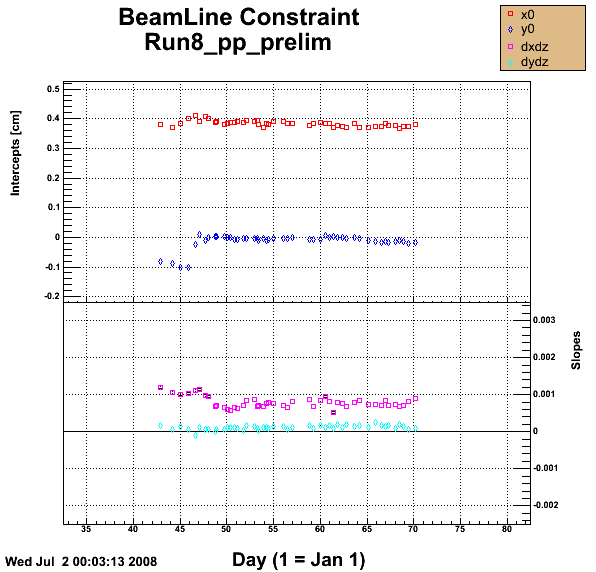
After studying the data from day 49 (February 18) and after, it did not appear that there were any significant changes to the actual beam tune. The most difficult obstacle was to overcome the significant amounts of pileup in the data, for which the ranking given by the Minuit vertex finder was of little help (as a reminder, PPV (the "pileup-proof vertex finder") does not work without a BeamLine constraint, and so cannot be used to calibrate the BeamLine).
Additional confusion resulted from whether trigger selections could be made which were truly helpful. For example, a minbias vertex should represent the least amount of biasing in vertex selections, but high-tower triggered events will have better discrimination power against pileup vertices. Because my studies showed that pileup tended to bring the value of x0 lower, and high-tower triggered events always gave a higher x0 than minbias or fmsslow events, I decided to go with the high-tower triggers and used a stringent set of cuts on all of the data from day 49 and after to find a single calibration set:
"zdc<2e5&&rank>0&&mult>40&&abs(z)<80&&trig>220400&&trig<220600"
Of further note, the width I attributed to the beam collision zone itself had some bearing on the resulting fit. In the end, I used 400 microns as this intrinsic width. So I believe the calibration for all pp data from February 18 through March 10 as a single set is rather well determined. Larger fluctuations in the operating conditions of the collider occurred in days prior to day 49, so it is not clear that improvements can be made in the calibration of that earlier pp data which would be worth their effort in terms of physics gains.
The final calibration set then appears as follows, with all data from days 49-70 represented by a single calibration set.
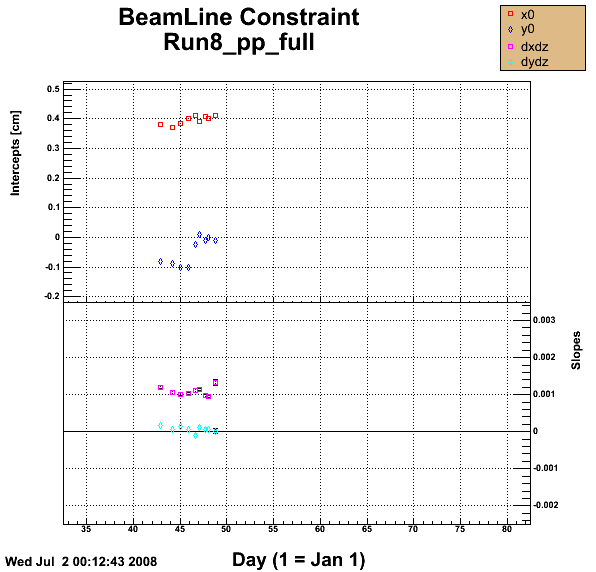
The query file to pick out runs is attached below.
G. Van Buren
Run 8 (9GeV AuAu)
The calibration production pass used the entire low energy AuAu dataset with the chain: "VtxSeedCalG,B2008,ITTF,VFMinuit,Corr4". Only 2 fills were found - apparently the collider folks did not update their fill numbers because judging from the BBC coincidence rate vs. time (shown here as seconds since Nov. 25, 2007 00:00:00) there were at least 14 fills during which we took runs (shown in red):

Despite having a cut at r^2 < 15 cm^2 for the vertices used, the beampipe is still clearly seen in low multiplicity collisions:

Here is log10(r^2) vs. log10(mult):

I proceeded with a cut at r^2 < 1.6 cm^2 and began to calibrate these 14 fills when I noticed that run 9071070 has a clearly different y distribution than run 9071067, despite the two appearing to me to be in the same fill from their BBC coincidence rate:

Here is a blowup of that fill's BBC rate where the following runs (last 2 digits of the run number only) are shown: 67 (red), 68 (green), 70 (blue), 72 (magenta):

The Electronic Shift Log includes a note for run 70: "Beam cogged at STAR." I decided to treat run 70 as it's own fill and got the following distribution for the beamline constraints of the 14 fills (14 original, plus the run 70 one, minus one which simply had far too few statistics):

Based upon the variations and time gaps seen in the above plot, I decided to group these into 4 "super-fills" as runs:
9071036-9071053
9071055-9071067
9071070-9071077
9071079-9071097
The result is shown here:

I have additionally tried to separate the calibration by trigger ID:
In the lowEnergy2008 setup, 1 = bbc-ctb, and 2 = bbc.
In the bbcvpd setup, 1 = bbc, and 2 = vpd.
In all cases, there were too few with id = 2 to make a solid calibration, but the distributions from both id values were consistent enough to say that no evidence of biases from the triggers can be identified.
Lastly, after subtracting off the z dependence, and weighting each vertex by the sqrt of the multiplicity, I find distributions which are well-described by Gaussians all giving sigmas of about 1.5mm in x and y. Shown are these distributions for the 4 fills in chronological order from top to bottom, x on the left, y on the right:


Run 9 (pp500 and pp200)
Run 9:
The old method was used for the following datasets:
- pp200 RFF low luminosity (day 118)
- pp2pp (FF, end of pp200, days 180-185)
A new 3D method was You do not have access to view this node and used for the following:
- pp500: New Beamline - Dec 8 2009, and preliminary results parts Beamline determination pp500 GeV W triggered events, Beamline determination pp500 GeV W triggered events pt 2, and Old Beamline Constraint Values (Generated Aug 15)
- pp200 RFF
- pp200 FF
The old method was Run 9: pp500 Low Luminosity Fill, but that fill was still at a relatively high luminosity for calibration work (too much pile-up) and the result was not kept, instead using the new method's results.
The results as uploaded to the database for Run 9 are plotted here. Major features are the discontinuity between pp500 and pp200 around day 103, the reversal of the magnetic field on day 147, and the switch to pp2pp running around day 180. Also visible are larger errors bars for calibrations using the old method as the new method took advantage of large data productions, improving statistical accuracy.
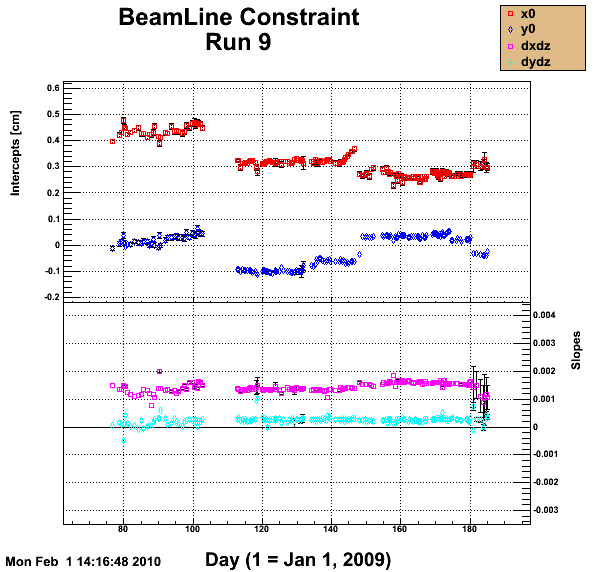
The query used to obtain files for the pp2pp data is attached.
Run 9: pp500 Low Luminosity Fill
The low luminosity fill was taken using runs 10083130, 133, 139, and 143, with BBC coincidence rates of ~50 kHz, using the BBCMB trigger. Offline QA plots showed evidence for pileup, so I looked for cuts to remove the pileup from the vertex position data (note also that there is some SpaceCharge in this data, which I have not corrected for this exercise, in hopes that any Update on 2006 issues are negligible at this point).
Triggered vertices are usually pretty well centered about z=0 (and the Offline QA plots confirmed that), so the best place to distinguish pileup vertices is at large z (though the vertex seed code stops at +/-100cm). In this particular data, I saw more evidence of pileup in the x positions of the vertices than the y positions. As usual, the Minuit vertex-finder (VFMinuit) was used for the calibration, and I believe its settings remain the same from Run 8.
Here is the mean x position (weighted by 1/errorx) vs. multiplicity (vertical) and rank (horizontal) for 60cm < z < 100cm:
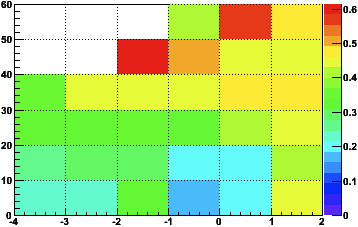
There appears to be a yellow plateau at high rank and multiplicity (with statistical fluctuations at the highest multiplicities), suggesting pileup effects at low rank and multiplicity. Further evidence can be seen by looking at the x positions vs. multiplicity for various z ranges (left: z>80, middle: -5<z<5, right: z<-80):

The pileup vertices do not extend as high in multiplicity as triggered vertices, and appear to go from small x (near 0) at large positive z, to x of about 0.8cm at large negative z. This can be seen more clearly in these x vs. z plots for low and high multiplicity (< or > 20, rank<1, histogram maxima are reduced to show low-level contours):

The following cut was chosen to remove the pileup vertices: (rank>1 || (rank>-2&&mult>30))
And the following beamline resulted:
row.x0 = 0.3927906; // cm : x intercept of x vs z line ;
row.dxdz = 0.0009458358; // : slope of x vs z line ;
row.y0 = 0.009295804; // cm : y intercept of y vs z line ;
row.dydz = -3.624923e-05; // : slope of y vs z line ;
row.err_x0 = 0.0003158423; // cm : error on x0 ;
row.err_dxdz = 1.025515e-05; // : error on dxdz ;
row.err_y0 = 0.0003118244; // cm : error on y0 ;
row.err_dydz = 1.011097e-05; // : error on dydz ;
row.chisq_dof = 4.451982; // chi square / dof of fit ;
This is now in the DB.
It may be of interest to note that the pileup vertices do show opposite slopes in both x and y vs. z than the non-pileup. In fact, without the described cut in place, the overall BeamLine fit obtains the opposite slope, obviating the necessity of the cut.
-Gene
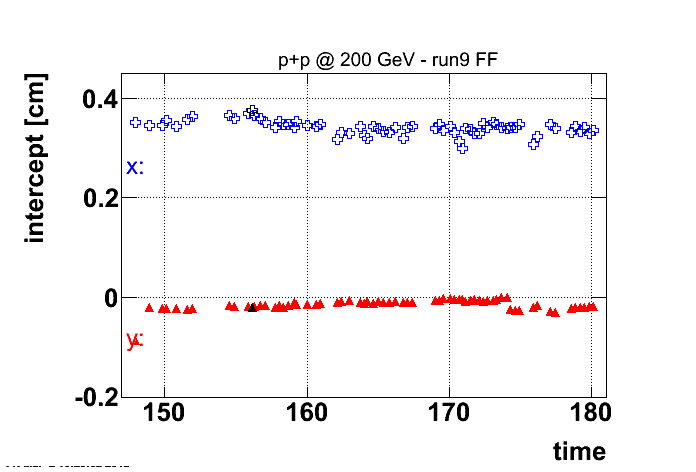
Run 9, pp200 GeV Full Field (FF) - new calibration (May 2012)
Below are the resulting beamline intercept parameters with the new calibration from 2012. The black markers were removed due to low
statistics.
The slope parameters:
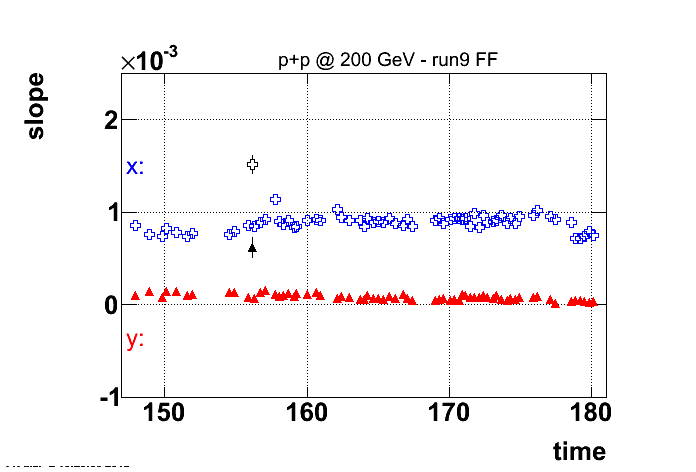
The direct comparison to the previously used 3D method shows some systematic differences. This could be either due to the new calibration parameters or due to systematics between the methods itself. We have compared the results from the 2D method for the new and old calibration parameters and could not find significant differences. Below are the values for old and new for one daq file (st_physics_10156091_raw_8030002.daq) and 5000 analyzed events. The pile up was always suppressed by requireing the highest ranked vertex.
| parameter | old | new |
| x | 0.3613 | 0.3651 |
| y | -0.004416 | -0.01654 |
| dxdz | 0.001005 | 0.001096 |
| dydz | 9.934157e-05 | 0.0001507 |
It was decided to use the 2D results for the parametrization of the beamline. All parameters were uploaded to the database with +1 second offset to the timestamp.
