GridLeak Distortion Maps
Using the code in StMagUtilities, these are maps of the GridLeak distortion.
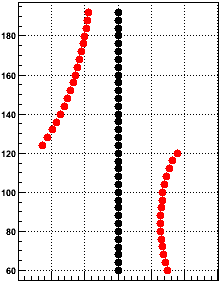
First, this is a basic plot of the distortion on a series of hits going straight up the middle of a sector (black: original hits; red: distorted hits). The vertical axis is distance from the center of the TPC (local Y) [cm], and the horizontal axis is distance from the line along the center of the sector (local X). Units are not shown on the horizontal axis because the magnitude of the distortion is dependence on the GridLeak ion charge density, which is variable.
The scale of the above plot is deceptive in not showing that there is some distortion in the radial direction as well as the r-phi direction. The next pair of plots show a map of the distortion [arb. units] in the direction orthogonal to padrows (left) and along the padrows (right) versus local Y and angle from the line going up the center of the sector (local φ) [degrees].
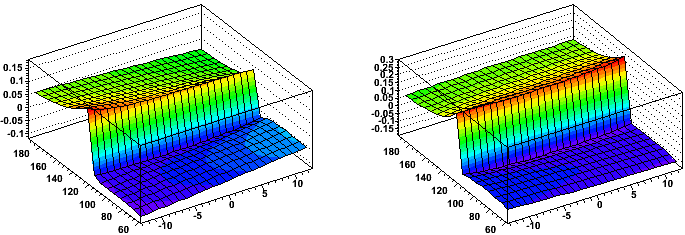
One can see that the distortion is on the order of x2 larger along the padrows than orthogonal to the padrows. Also, it is clear that there is a small variance in magnitude of the distortion across the face of the sectors.
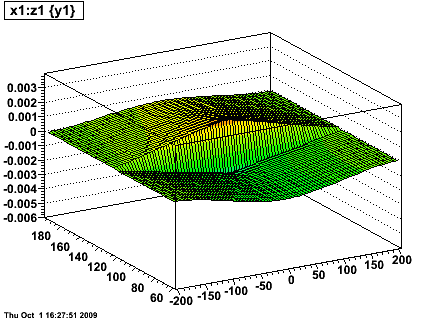
The next plot shows the magnitude of the distortion [arb. units] along the padrow at the middle of the sectors vs. local Y [cm] and global Z [cm]. The distortion is largest near the central membrane (Z=0) and goes to zero at the endcaps (|Z| ≅ 205 cm), with a linear Z dependence in between, which flattens off at the central membrane and endcap due to boundary conditions that the perturbative potentials are due to charge in the volume and are constrained to zero at these surfaces.
- Printer-friendly version
- Login or register to post comments