- My blog
- Post new blog entry
- Top bloggers
- Recent posts
Sort by:[Date]
pcb binding practice
Updated on Mon, 2015-03-09 06:00. Originally created by qhxu on 2015-03-09 06:00.
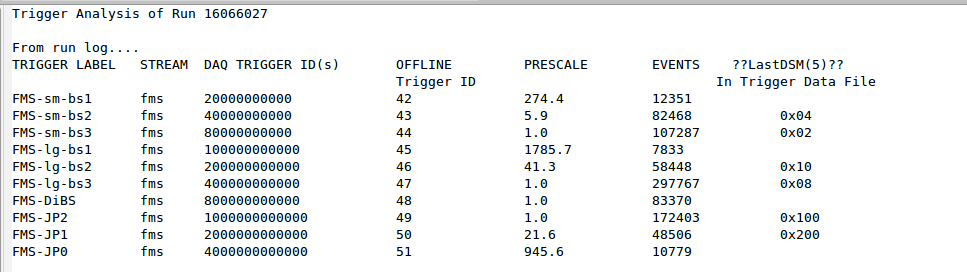
AnalysisRun16066027
Updated on Tue, 2015-03-10 00:20. Originally created by heppel on 2015-03-08 03:21.The detailed analysis of triggers for this run follows
Background estimation with slope ptbalance cut
Updated on Mon, 2015-06-01 14:27. Originally created by jlzhang on 2015-03-06 09:58. 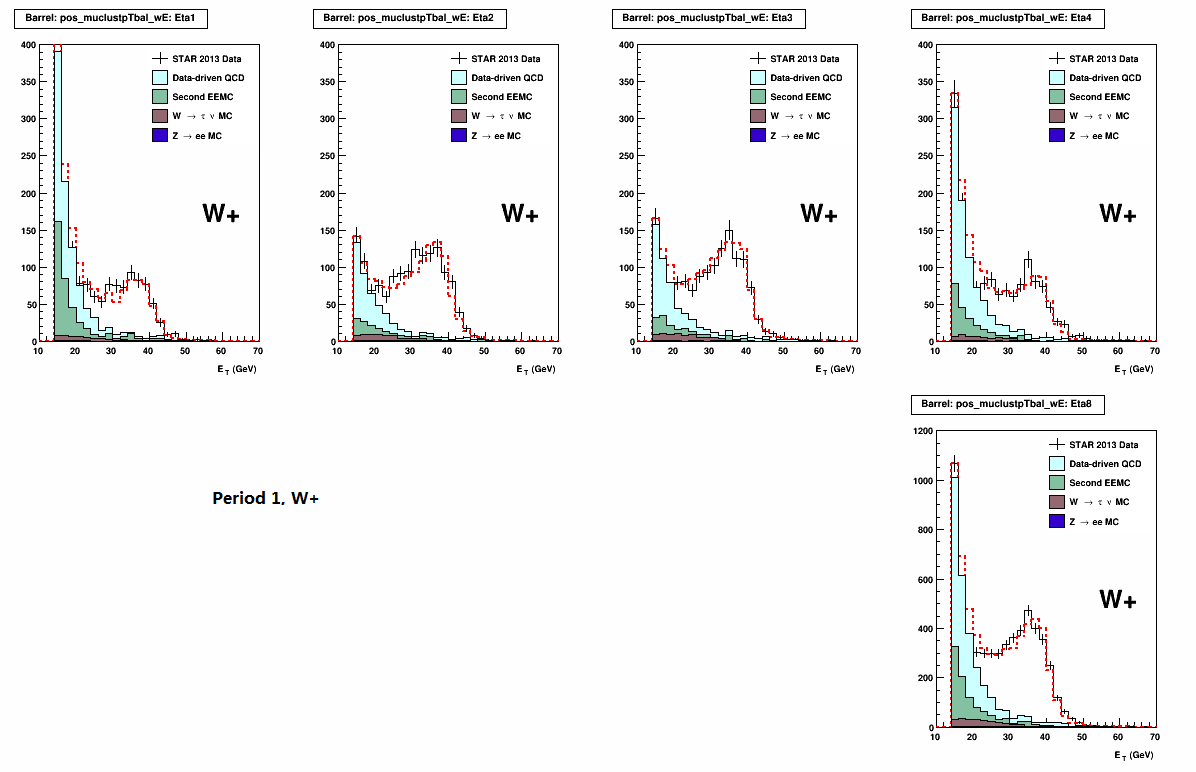
Scaler rates first transverse fill
Updated on Fri, 2015-03-06 09:47. Originally created by jml on 2015-03-06 09:47.
Documentation for Performing BEMC Gain Calibration
Updated on Wed, 2015-03-11 21:45. Originally created by jkadkins on 2015-03-06 00:06.The attached PDF gives instructions for running all of the code to peform a gain calibration on the BEMC.
Partonic pT plots - first look
Updated on Sun, 2015-03-08 20:14. Originally created by sra233 on 2015-03-05 19:24.The first plot is for partonic pt of 2-3 in one file in one run.
The second plot is for the partonic pt of 2-3 in all the files in all the runs.
STAR status run 15. March 5th, Spin PWG meeting
Updated on Thu, 2015-03-05 11:11. Originally created by fazio on 2015-03-05 11:11.ECT* Heavy Quarks in Heavy Ion Collisions workshop
Updated on Wed, 2015-03-11 07:43. Originally created by rvertesi on 2015-03-05 09:03.slides
v1 - for pwg discussion
v2 - for collaboration discussion