2008.10.21 Shower shapes, 5/25 strips cluster energy, raw vs. data-driven MC
Ilya Selyuzhenkov October 21, 2008
Data sets:
- pp2006 - STAR 2006 pp longitudinal data (~ 3.164 pb^1)
after applying gamma-jet isolation cuts (R_cluster > 0.9 is used below). - gamma-jet[gamma-filtered] - data-driven Prompt Photon [p6410EemcGammaFilter] events.
Partonic pt range 2-25 GeV. - QCD jets[gamma-filtered] - data-driven QCD [p6410EemcGammaFilter] events.
Partonic pt range 2-25 GeV.
Some comments:
- Overall comment: effect of data-driven shower shape replacement procedure
on QCD background events is small, except probably pre1=0 pre2=0 case. -
Fig. 1-3, upper left plots (pre1=0 pre2=0) show that
average energy per strip in data-driven gamma-jet MC (i.e. solid red square in Fig. 3)
is systematically higher than that for pp2006 data (black circles in Fig. 3).Note, that there is an agreement between SMD shower shapes
for pp2006 data and data-driven gamma-jet simulations
if one scales them to the same peak value
(Compare red vs. black in upper left plot from Fig. 1 at this link) -
Fig. 4, upper left plot (pre1=0 pre2=0):
Integrated SMD energy from 25 strips
in raw gamma-jet simulations (red line) match pp2006 data (black line)
in the region where signal to background ratio is high, E_smd(25-strips)>0.1GeV.
This indicates that raw MC does a good job in
reproducing total energy deposited by direct photon. -
Fig. 5, upper left plot (pre1=0 pre2=0):
There is mismatch between distributions of energy in 25 strips cluster
from data-driven gamma-jet simulations and pp2006 data.
This probably reflects the way we scale our library shower shapes
in data-driven shower shape replacement procedure.
Currently, the scaling factor for the library shape is calculated based on the ratio
of direct photon energy from Geant record to the energy of the library photon.
Our library is build out of photons from eta-meson decay,
which has been reconstructed by running pi0 finder.
The purity of the library is about 70% (see Fig. 1 at this post for more details).The improvement of scaling procedure could be to
preserve total SMD energy deposited within 25 strips from raw MC,
and use that energy to scale shower shapes from the library. -
Fig. 6, upper left plot (pre1=0 pre2=0):
Mismatch between integrated 5-strip energy for raw MC and pp2006 in Fig. 6
corresponds to "known" difference in shower shapes from raw Monte-Carlo and real data.
Figure 1: SMD shower shapes: data, raw, and data-driven MC (40 strips).
Vertical axis shows average energy per strip (no overall shower shapes scaling)
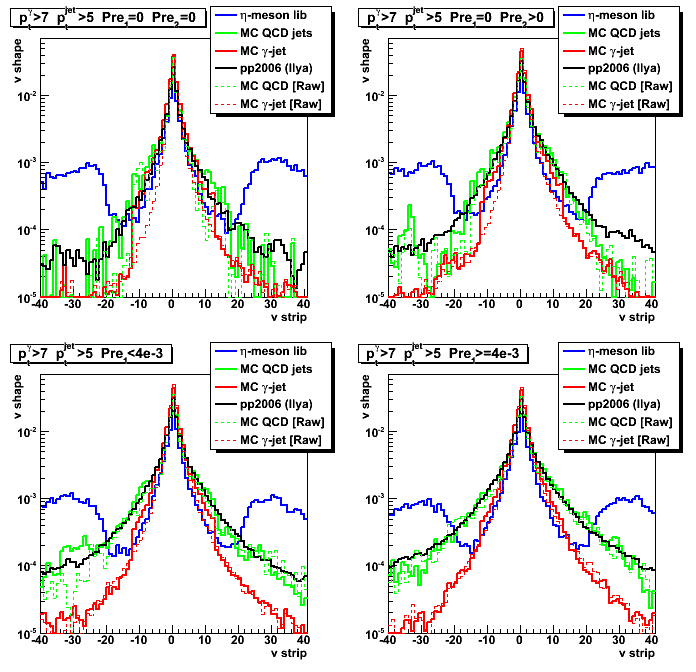
Figure 2: Shower shapes: data, raw, and data-driven MC (12 strips)
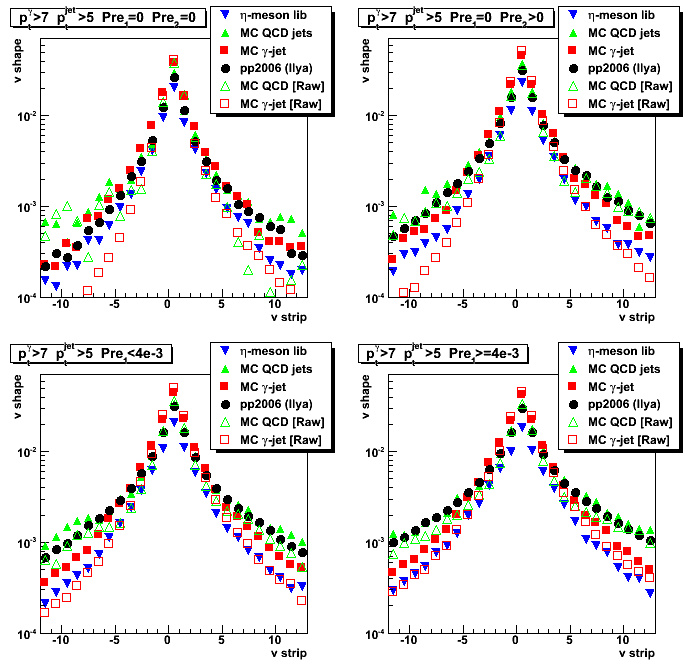
Figure 3: Shower shapes: data, raw, and data-driven MC (5 strips)
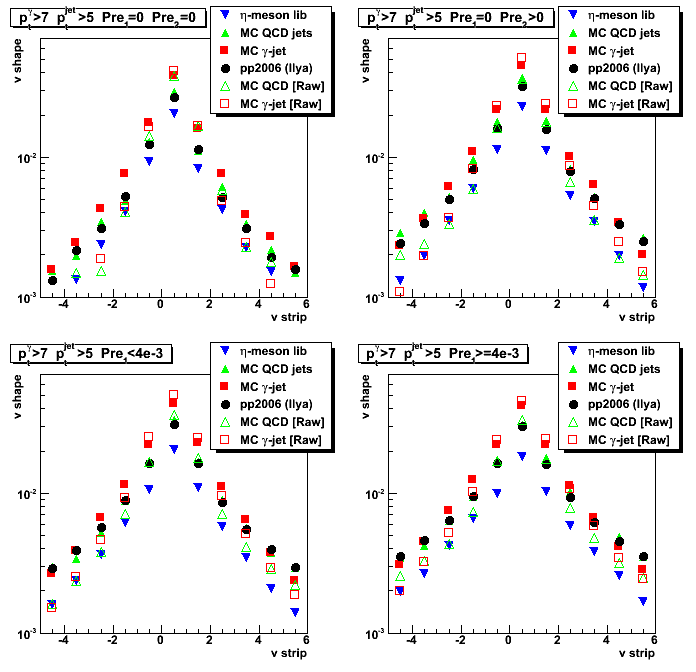
Figure 4: 25 strips SMD cluster energy for raw Monte-Carlo
(Note: type in x-axis lables, should be "25 strip peak" instead of 5)
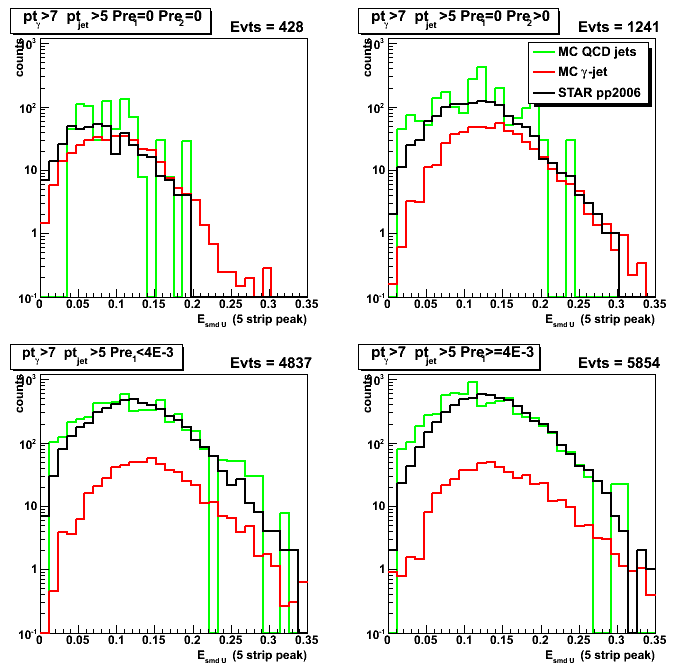
Figure 5: 25 strips SMD cluster energy for data-driven Monte-Carlo
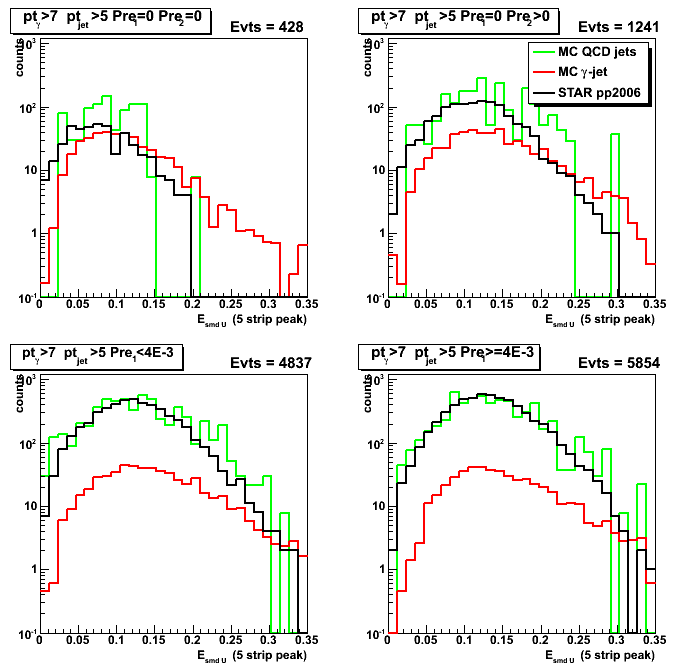
Figure 6: 5 strips SMD peak energy for raw Monte-Carlo
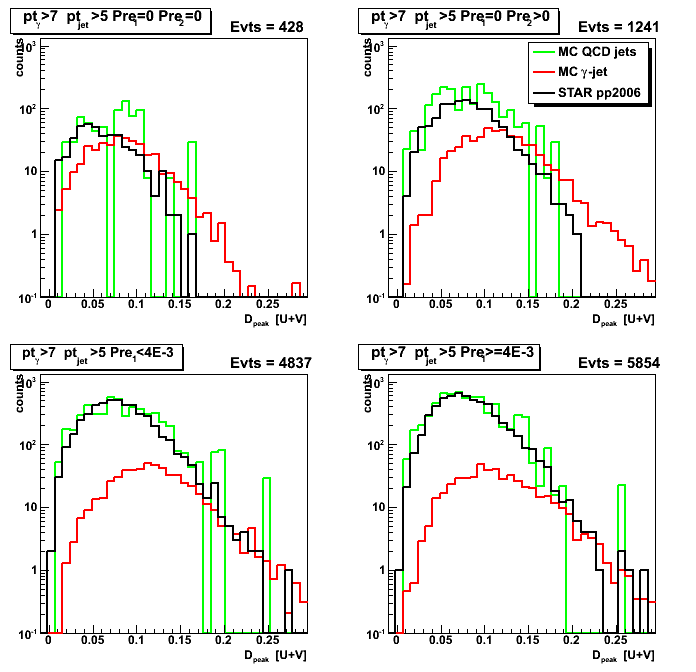
Figure 7: 5 strips SMD peak energy for data-driven Monte-Carlo
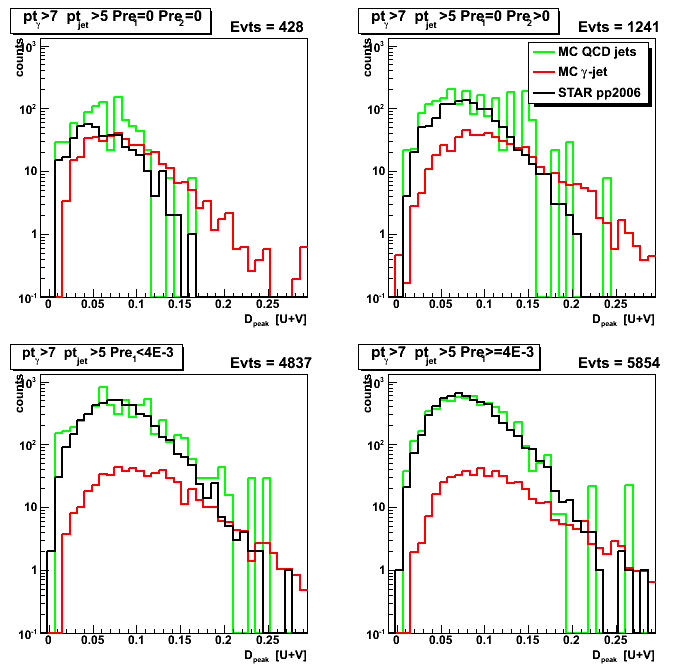
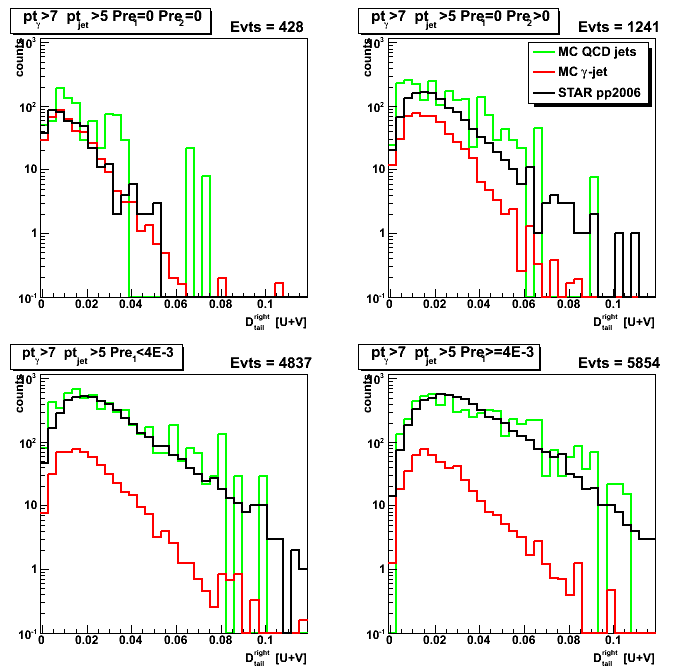
Figure 8:Energy from the right tail (up to 30 strips) for raw Monte-Carlo
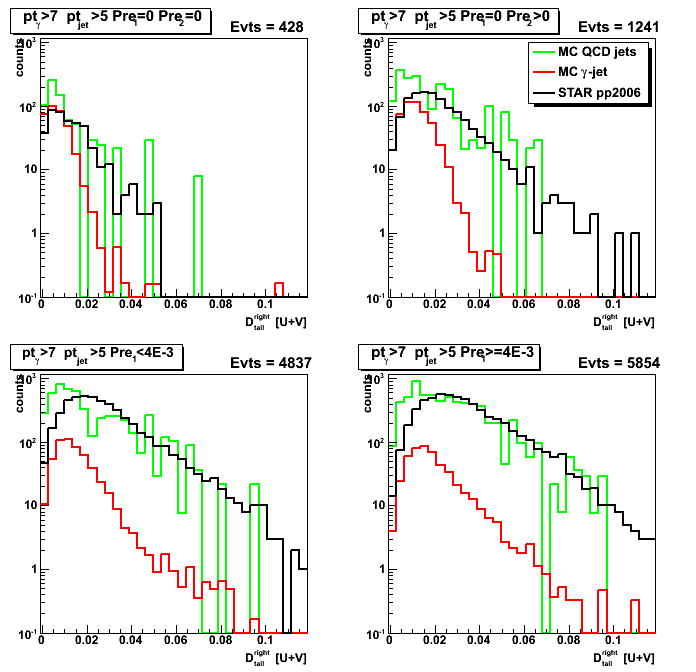
Figure 9:Energy from the right tail (up to 30 strips) for data-driven Monte-Carlo
- Printer-friendly version
- Login or register to post comments