- BEMC
- BEMC Detector Operator Manual
- Calibrations
- Database
- Hardware
- Mapping
- Service Tasks
- Software
- Useful Documents
- EEMC
- ETOF
- FCS
- FGT
- FPD & FMS & FPS
- FTPC
- FTT
- HLT
- L3
- PMD
- PP2PP
- RICH
- Roman Pot Phase II*
- SSD
- SVT
- Slow Controls
- TPC
- TRG
- Trigger Detectors
- VPD
- test
Calibration Uncertainty Calculation
Updated on Mon, 2009-05-11 09:04. Originally created by mattheww on 2009-03-30 11:18.
Under:
Summary:
The uncertainty on the 2006 BTOW Calibration is 1.6%. This value is the combination of a 1.3% overall uncertainty and a 0.9% uncertainty caused by variations in the different crates. This uncertainty should be treated as a measure of the bias in the 2006 Calibration.
Plan:
Attached is a document how the calibration uncertainty for 2006 will be calculated:
- Eliminate dependence on simulations through tighter fiducial volume cuts
- Reduce trigger bias by explicitly avoiding electrons matched to trigger HTs or TPs
- Validate modeling of E/p backgrounds. Confirm that the fit is unbiased by checking
consistency of low-background and high-background samples. - Confirm that crate timing does not systematically bias the energy reconstruction.
The uncertainty on the calibration will be assigned as the maximum between |E/p −1.0| and the uncertainty on the peak position.
Method:
We did some initial studies to determine the magnitude of each of these effects, and then we generated calibration trees covering the entire 200 GeV pp run from 2006. The code used to generate these trees is available in StRoot/StEmcPool/StEmcOfflineCalibrationMaker.
We made the following cuts on the tracks to select good electrons and an unbiased sample.
List 1:
- 3.5 < dEdx < 4.5
- abs(vertexZ) < 30
- 1.5 < p < 15 GeV
- dR (from tower center to track projection) < 0.004 (in units of deta,dphi)
- tower_id == tower_id_exit of projection
- Energy of highest neighbor < 0.5 * track energy
After making these cuts, we fit the remaining sample to a gaussian plus a first order polynomial, based on a study of how to fit the background best.
Figure 1 uses an isolation cut to find a background rich sample to fit:

Figure 2 shows the stability of the E/p location (on the y-axis) between our fit and just a gaussian for different windows in dEdx (x-axis)
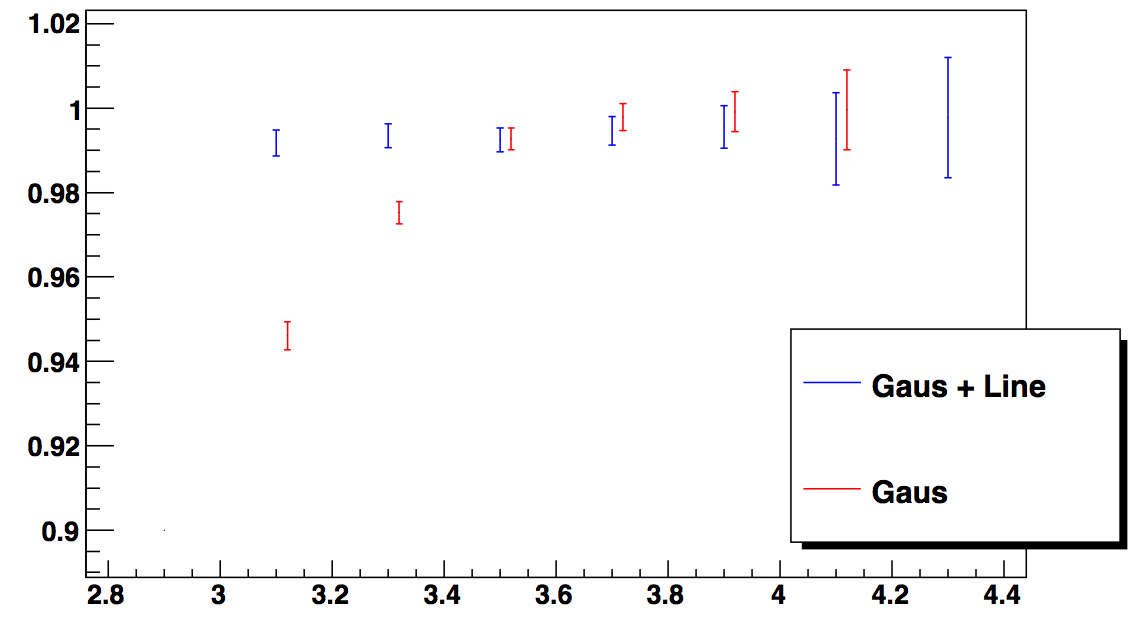
Figure 3 shows the E/p location (y-axis) for different annuli in dR (x-axis/1000), which motivated our dR cut to stay in a flat region:
.png)
After making all of these cuts, we fit E/p to the entire sample of all our electrons. We then add different cuts based on the trigger information to see how that might affect the bias. We looked at four scenarios:
List 2:
- All electrons after stringent cuts
- Electrons from events that were NOT HT/HTTP triggered
- Electrons from events that were only HT/HTTP triggered
- Electrons from HT/HTTP events with trigger turnon tracks (4.5 < p < 6.5 GeV) removed
From these scenarios we chose the largest deviation from E/p = 1.0 as the overall uncertainty on the calibration. This happens to be scenario 3, working out to 1.3%.
Figure 4: E/p for different scenarios
.png)
We also observed a possible crate systematic by fitting E/p for each crate separately.
Figure 5 E/p for each crate:
.png)
According to the chi^2, there is a non statistical fluctuation. To figure out how much that is, we compared the RMS of these points to that when the data is randomly put into 30 partitions. It turns out that all of it is due to that one outlier, crate 12. Since crate 12 contributes 1/15 to each eta ring that it touches, the deviation of this point from the fit causes an uncertainty of 0.9%. This additional uncertainty increases the total uncertainty to 1.6%.
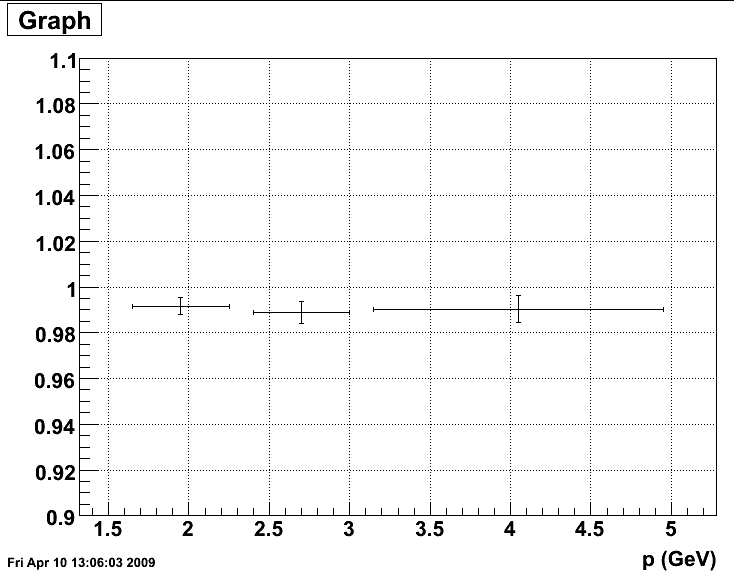
Side Note - Linearity:
After removing HT/HTTP events, we took a look at this plot of p (y-axis) vs E/p (x-axis). By eye, it looks pretty flat, which we verified by splitting into p bins.
Figure 6 p vs E/p
.png)
Figure 7 E/p vs p
Eta Dependence:
There was some question about whether there was eta dependence. This was investigated and found to be inconsequential: http://drupal.star.bnl.gov/STAR/node/14147/
Figure 8: Divided the sample into 3 separate time periods. Period 1 goes is before run 7110000. Period 2 is between runs 7110000 and 7130000. Period 3 is after run 7130000. The deviations are below 1.6%.
.png)
Figure 9: Agreement between east and west barrel:
.png)
Figure 10: ZDC Rate vs. energy/p
.png)
Figure 11: E/p fits for three different regions in ZDC rate: 0 - 8000, 8000-10000, 10000-20000 Hz.
.png)
»
- Printer-friendly version
- Login or register to post comments