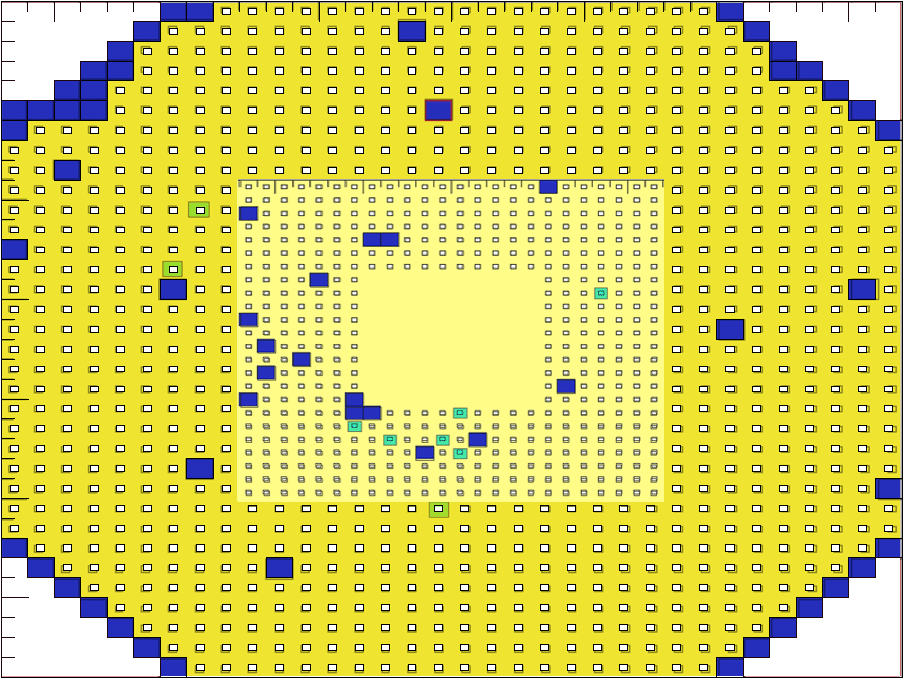
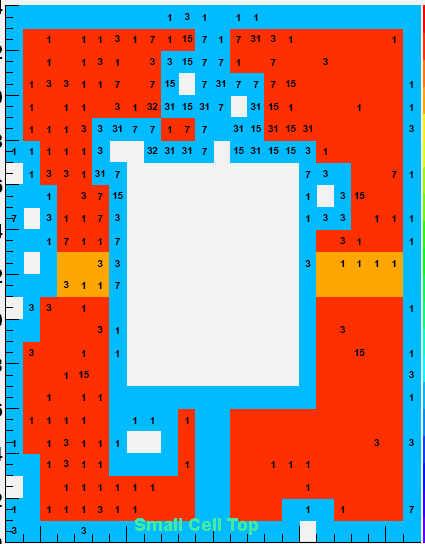
The following figure represents the dead cells (Dark Blue) and very weak cells (Light Blue) for run 10179077

The following is a list of dead cells (Dark Blue)
North Large (nstb=1)
Dead: nstb=1 row=0 col=9 nADC=1100 aveADC=1.404545 nLED=6213 aveLED=2.965234 hbincnt=11
Dead: nstb=1 row=1 col=1 nADC=93841 aveADC=9.405271 nLED=614 aveLED=9.602606 hbincnt=3
Dead: nstb=1 row=5 col=0 nADC=3838 aveADC=8.000000 nLED=7 aveLED=8.000000 hbincnt=1
Dead: nstb=1 row=5 col=13 nADC=38459 aveADC=1.150368 nLED=6730 aveLED=8.379792 hbincnt=27
Dead: nstb=1 row=5 col=14 nADC=908 aveADC=1.691630 nLED=6730 aveLED=7.363150 hbincnt=11
Dead: nstb=1 row=8 col=14 nADC=55 aveADC=1.054545 nLED=0 aveLED=0.000000 hbincnt=2
Dead: nstb=1 row=12 col=16 nADC=131695 aveADC=1.172429 nLED=2220 aveLED=1.475225 hbincnt=6
Dead: nstb=1 row=14 col=10 nADC=328 aveADC=1.448171 nLED=0 aveLED=0.000000 hbincnt=9
Dead: nstb=1 row=23 col=9 nADC=1279 aveADC=2.007819 nLED=0 aveLED=0.000000 hbincnt=3
Dead: nstb=1 row=28 col=6 nADC=8020 aveADC=1.003367 nLED=2 aveLED=1.000000 hbincnt=3
South Large (nstb=2)
Dead: nstb=2 row=3 col=12 nADC=13833 aveADC=1.986482 nLED=6730 aveLED=39.578455 hbincnt=74
Dead: nstb=2 row=14 col=15 nADC=19376 aveADC=2.010425 nLED=57 aveLED=2.000000 hbincnt=2
Dead: nstb=2 row=16 col=10 nADC=115224 aveADC=8.045754 nLED=102 aveLED=8.000000 hbincnt=2
Dead: nstb=2 row=24 col=16 nADC=2228 aveADC=1.535907 nLED=0 aveLED=0.000000 hbincnt=20
North Small (nstb=3)
Dead: nstb=3 row=2 col=11 nADC=1572 aveADC=1.192112 nLED=2973 aveLED=1.101245 hbincnt=10
Dead: nstb=3 row=4 col=3 nADC=11 aveADC=2.000000 nLED=1 aveLED=2.000000 hbincnt=1
Dead: nstb=3 row=4 col=4 nADC=54 aveADC=4.296296 nLED=3 aveLED=4.000000 hbincnt=2
Dead: nstb=3 row=7 col=7 nADC=11479 aveADC=16.269013 nLED=119 aveLED=16.000000 hbincnt=4
Dead: nstb=3 row=10 col=11 nADC=5421 aveADC=2.052758 nLED=16 aveLED=2.000000 hbincnt=2
Dead: nstb=3 row=12 col=10 nADC=1813 aveADC=2.003309 nLED=0 aveLED=0.000000 hbincnt=3
Dead: nstb=3 row=13 col=8 nADC=257599 aveADC=10.380320 nLED=1201 aveLED=9.665279 hbincnt=4
Dead: nstb=3 row=14 col=10 nADC=2560 aveADC=2.002344 nLED=4 aveLED=2.000000 hbincnt=2
Dead: nstb=3 row=16 col=5 nADC=2021 aveADC=8.007917 nLED=16 aveLED=8.000000 hbincnt=2
Dead: nstb=3 row=16 col=11 nADC=7253 aveADC=1.019716 nLED=149 aveLED=1.020134 hbincnt=7
Dead: nstb=3 row=17 col=4 nADC=2037 aveADC=2.026510 nLED=11 aveLED=2.000000 hbincnt=3
Dead: nstb=3 row=17 col=5 nADC=9 aveADC=2.000000 nLED=0 aveLED=0.000000 hbincnt=1
Dead: nstb=3 row=20 col=1 nADC=645 aveADC=2.003101 nLED=3 aveLED=2.000000 hbincnt=2
Small South (nstb=4)
Dead: nstb=4 row=0 col=5 nADC=69245 aveADC=1.001069 nLED=82 aveLED=1.000000 hbincnt=2
Dead: nstb=4 row=15 col=6 nADC=91 aveADC=11.604396 nLED=0 aveLED=0.000000 hbincnt=4
Dead: nstb=4 row=19 col=1 nADC=109 aveADC=36.110092 nLED=0 aveLED=0.000000 hbincnt=4
The Following Cells have very low gain (light blue)
Low: nstb=1 row=10 col=9 nADC=13719 aveADC=4.452511 nLED=6530 aveLED=11.952221 hbincnt=13
Low: nstb=1 row=13 col=10 nADC=3235 aveADC=5.183308 nLED=6241 aveLED=18.152219 hbincnt=13
Low: nstb=1 row=25 col=0 nADC=1913 aveADC=30.670152 nLED=5329 aveLED=48.111090 hbincnt=14
Low: nstb=3 row=18 col=5 nADC=1096 aveADC=54.978102 nLED=3884 aveLED=63.752832 hbincnt=13
Low: nstb=3 row=19 col=0 nADC=288005 aveADC=37.980452 nLED=2662 aveLED=46.413223 hbincnt=9
Low: nstb=3 row=19 col=3 nADC=531 aveADC=76.052731 nLED=0 aveLED=0.000000 hbincnt=9
Low: nstb=4 row=8 col=8 nADC=309816 aveADC=20.887133 nLED=1346 aveLED=20.041605 hbincnt=10
Low: nstb=4 row=17 col=0 nADC=137 aveADC=9.430657 nLED=0 aveLED=0.000000 hbincnt=9
Low: nstb=4 row=20 col=0 nADC=92 aveADC=53.565217 nLED=0 aveLED=0.000000 hbincnt=6
The ADC distribution (black) and led ADC distribution (red) is shown for each FMS cell in
STAR/files/userfiles/1651/file/adc.pdf
There is 1 histogram for each cell and the histograms have names that are printed with a c statement like
printf("ADCr%d_c%d_d%d \n",row,col,nstb-1);
row ranges from 0 (top small) to 23 (bottom small)
row ranges from 0 (top large) to 33 (bottom large)
col ranges from 0 (center) to 11 (outside edge small)
col ranges from 0 (center) to 16 (outside edge large)
Bit Shifting (unlike other plots on this page, in this plot the top of the plot is the lower part of the FMS!!


