2008.03.28 EEMC SMD shapes: gamma's from gamma-jets (data), MC, and eta-meson analysis
Ilya Selyuzhenkov March 28, 2008
Some observations:
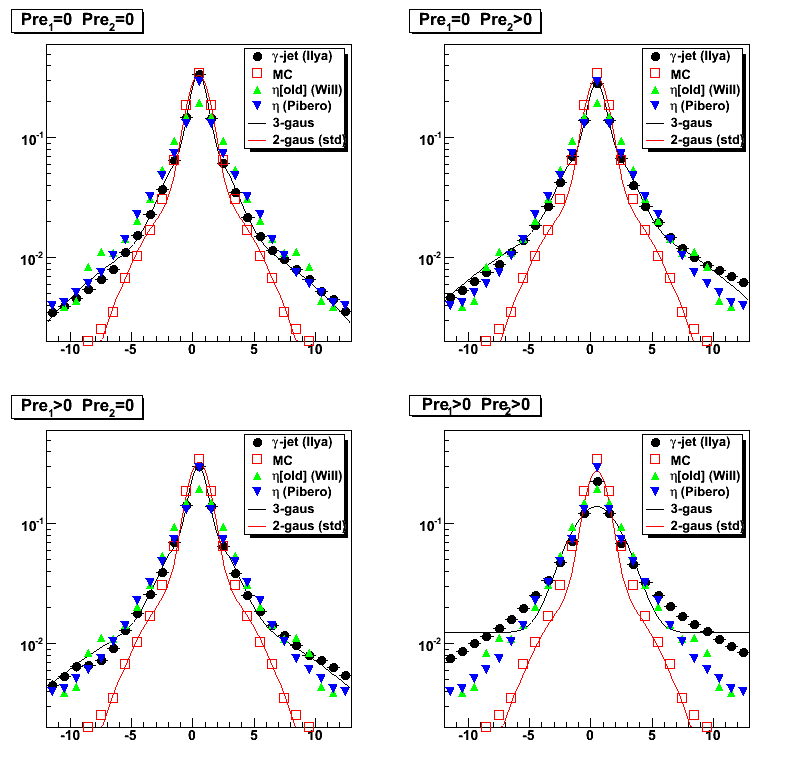
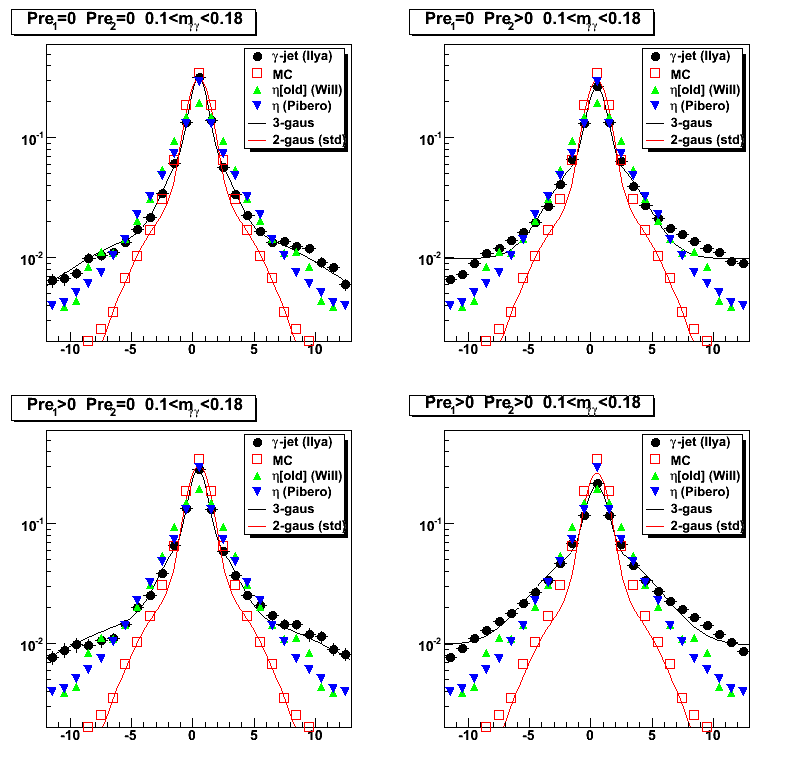
- SMD data-driven shapes from different analysis are in a good agreement (Figure 1, upper left plot)
- Overall MC shape is too narrow compared to the data shapes (Figure 1, upper left plot)
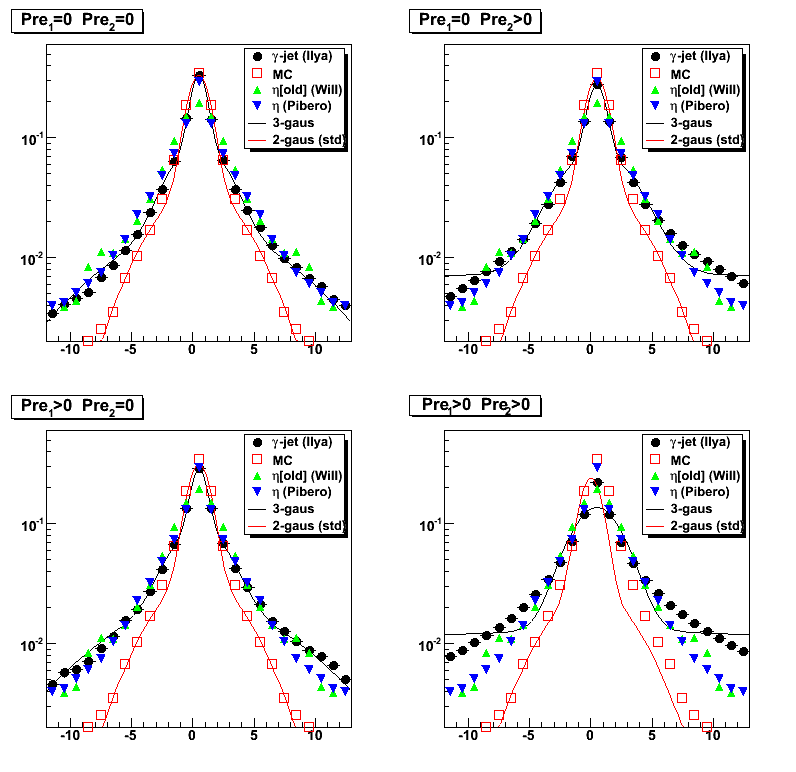
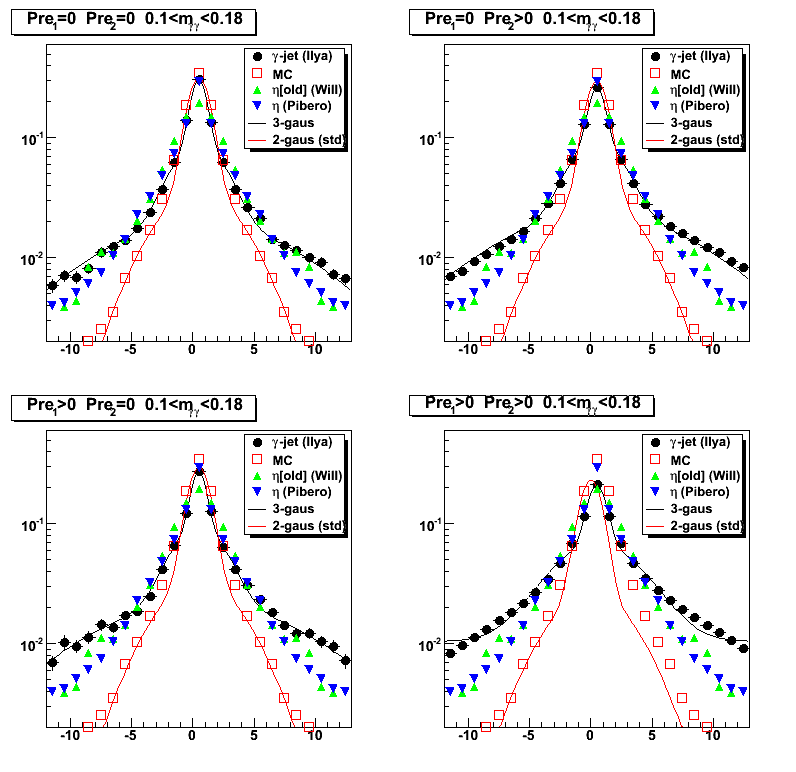
- Shapes are similar with or without gamma-jet 7GeV pt cut (compare Figures 1 and 2),
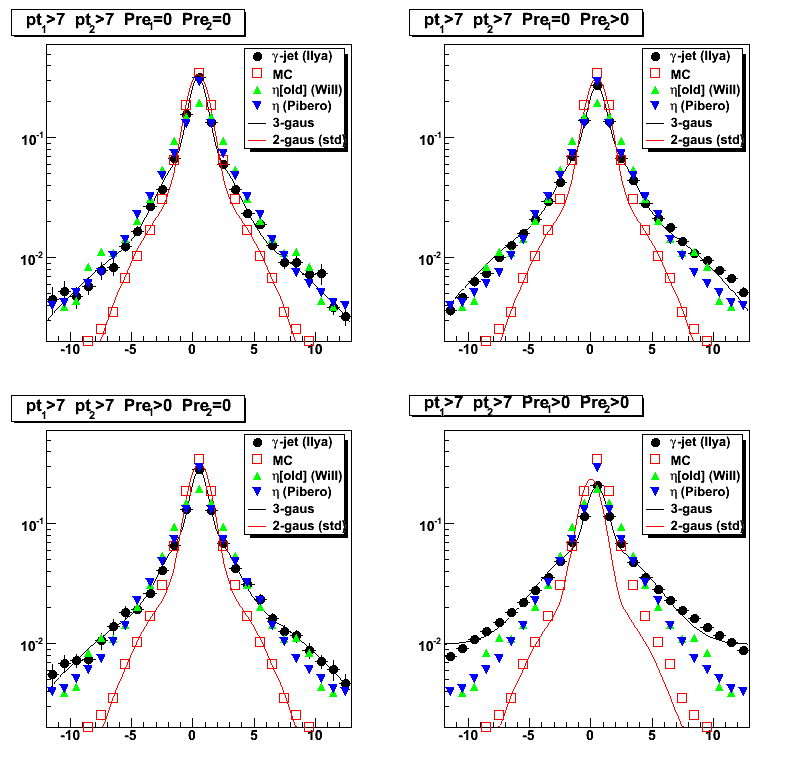
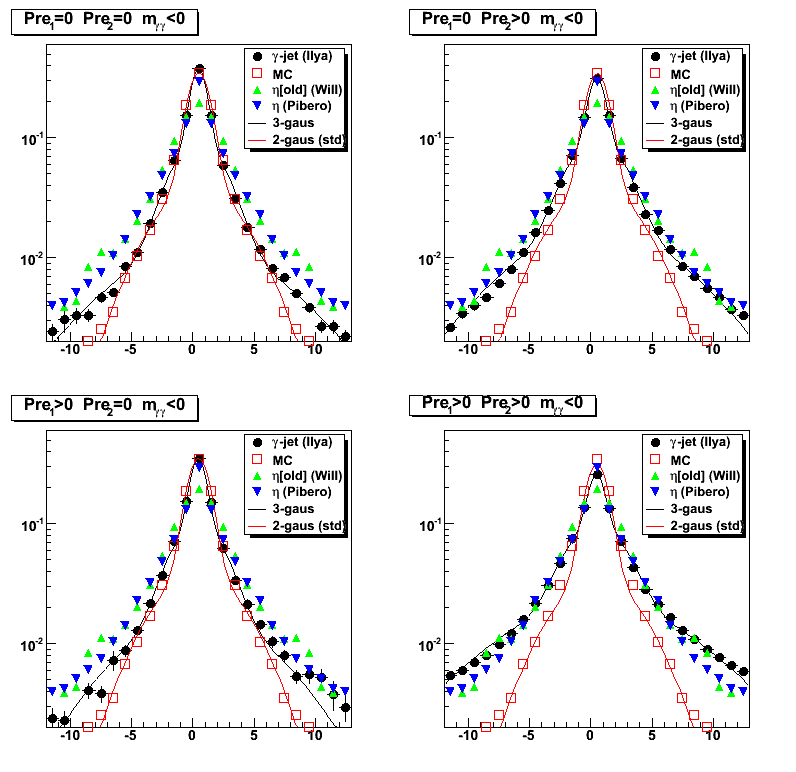
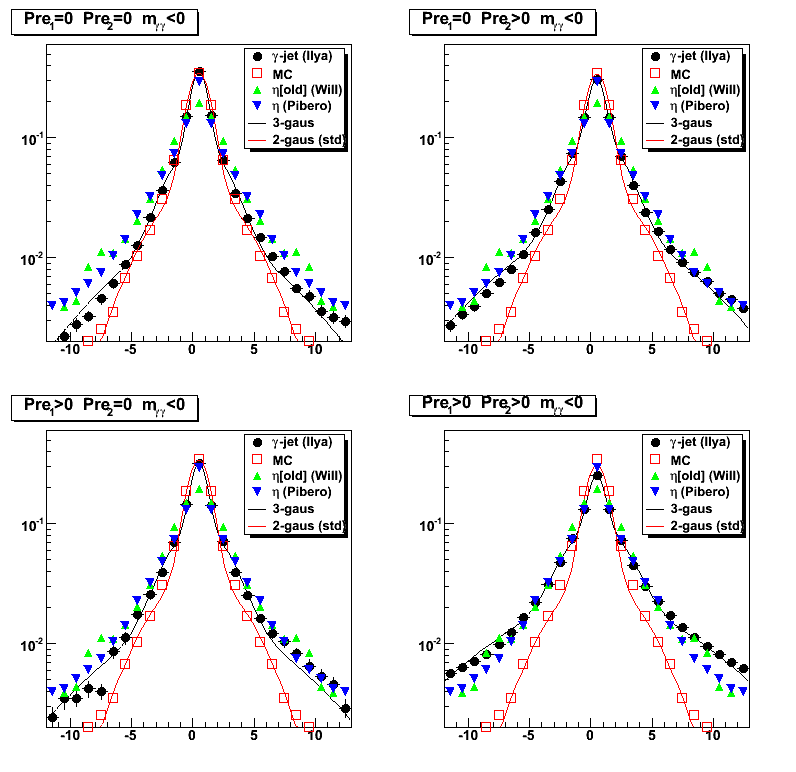
what may indicate that shape is independent on energy (at least within our kinematic limits). - Data-driven and MC shapes are getting close to each other (Figure 4, upper left plot)
when requiring no energy above threshold in both preshower layers and
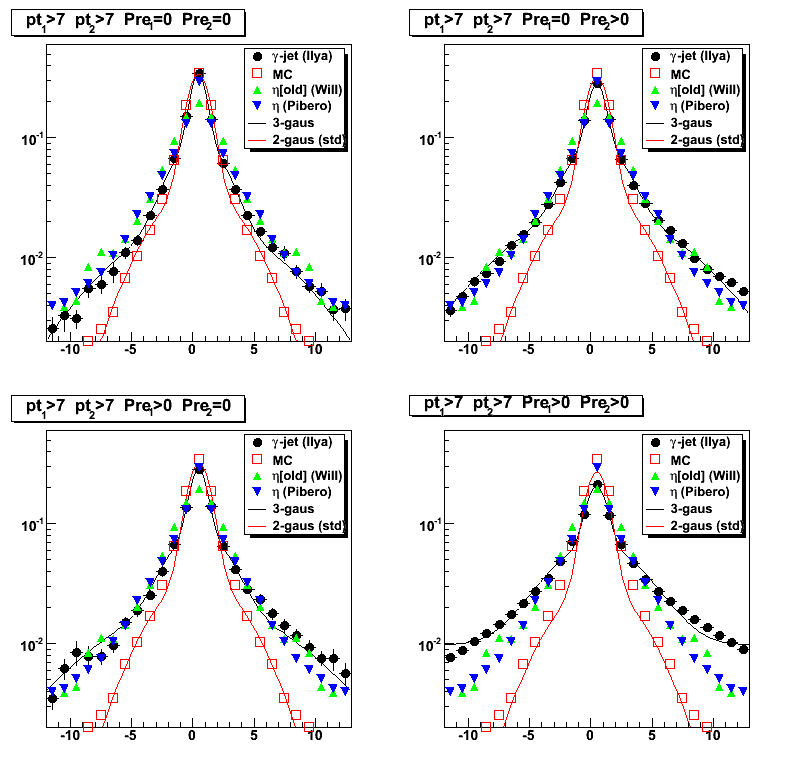
with suppressed contribution from pi0 background.
The latter is achieved by using the information on
reconstructed invariant mass of 2gamma candidates (compare Figure 3 and 4).One interpretation of this can be that in Monte Carlo simulations
the contribution from the material in front of the detector is underestimated - Energy distribution for each strip in the SMD peak does not looks like a Gaussian (Figure 5),
what makes very difficult to interpret results obtained from chi2 analysis (Figure 6-8). -
Triple Gaussian fit gives a better description of the data shapes,
compared to the double Gaussian function (compare red and black lines on Figure 1-4)
Figure 1: EEMC SMD shape comparison for various preshower cuts
(black points shows u-plane shape only, v-plane results can be found here)
Figure 2: EEMC SMD shape comparison for various preshower cuts with gamma-jet pt cut of 7GeV
(black points shows u-plane shape only, v-plane results can be found here)
Figure 3: Shapes with an additional cut on 2-gamma candidates within pi0 invariant mass range.
Sample invariant mass distribution using "simple" pi0 finder can be found here
(black points shows u-plane shape only, v-plane results can be found here)
Figure 4: Shapes for the candidates when "simple" pi0 finder failed to find a second peak
(black points shows u-plane shape only, v-plane results can be found here)
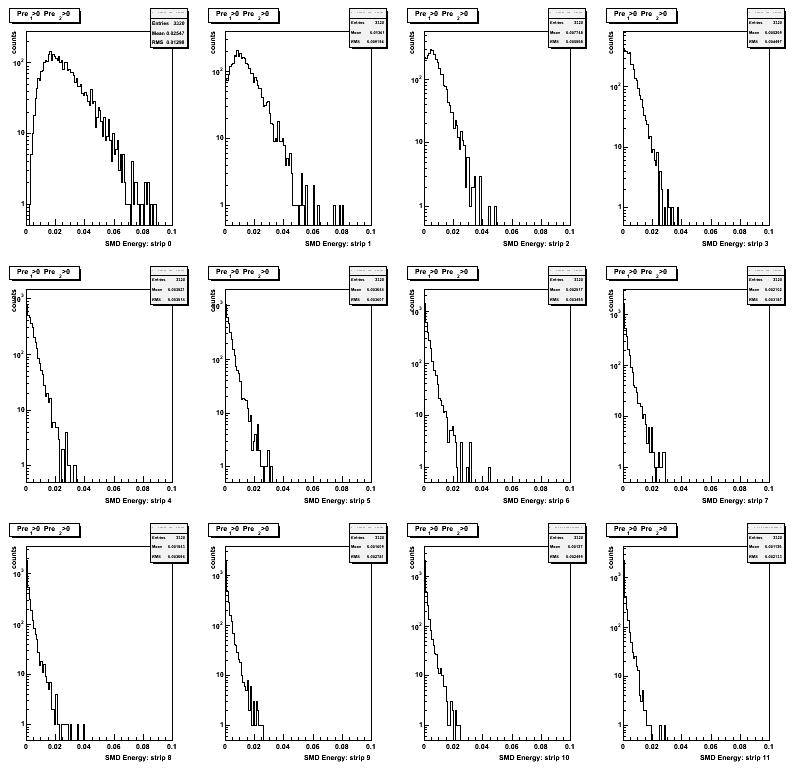
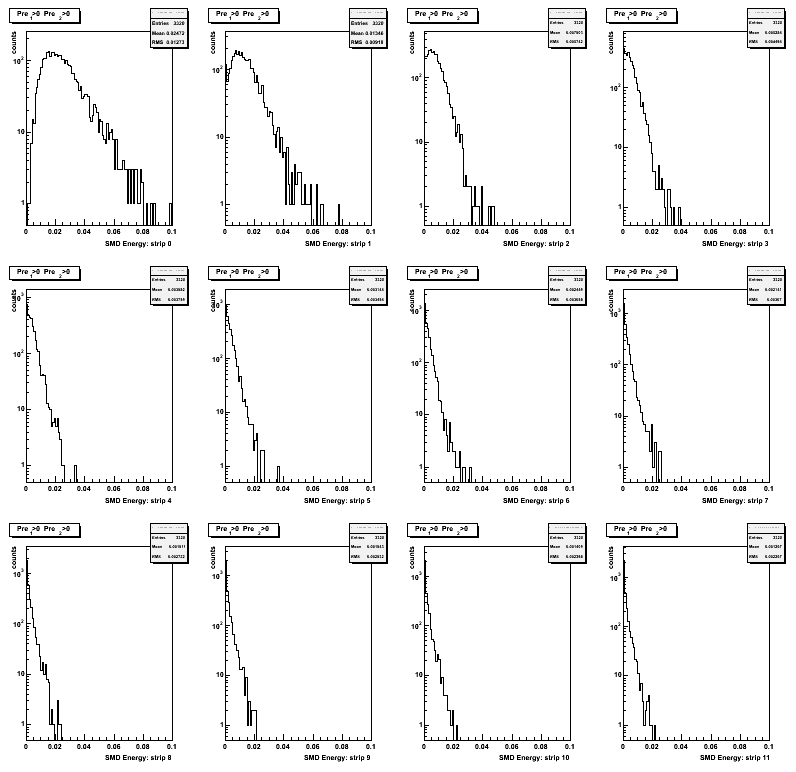
Figure 5: Strip by strip SMD energy distribution.
Only 12 strips from the right side of the maximum are shown.
Zero strip (first upper left plot) corresponds to the high strip in the shape
Note, that already at the 3rd strip from a peak,
RMS values are comparable to those for a mean, and for a higher strips numbers RMS starts to be bigger that mean.
(results for u-plane only, v-plane results can be found here)
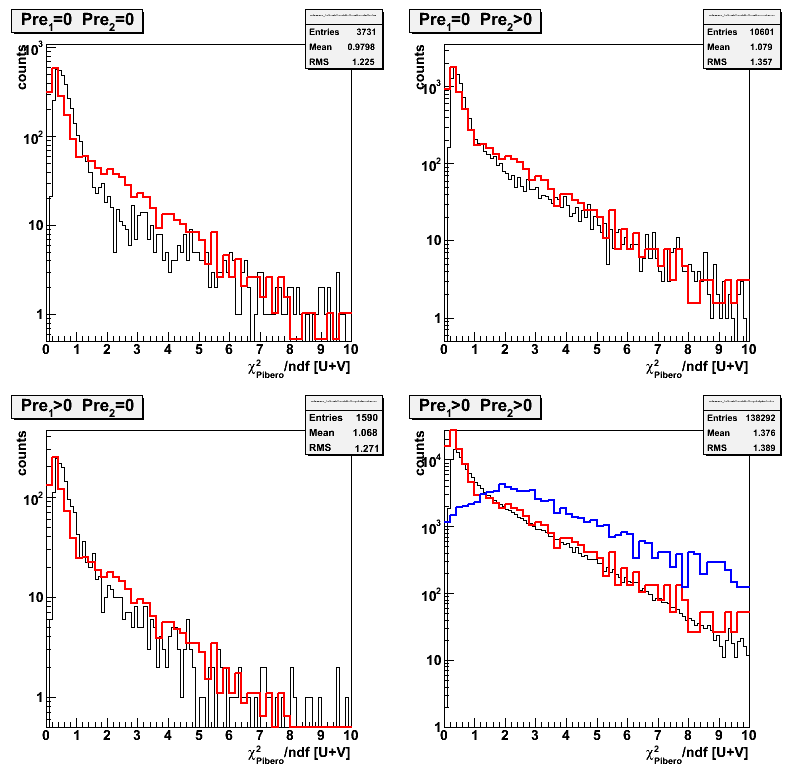
Comparing chi2 distributions for gamma-jet candidates using MC, Will, and Pibero's shapes
Results for side residual (together with pt, eta, phi distributions) for gamma-jet candidates can be found at this web page
Red histograms on Figures 6-8 shows chi2 distribution from MC-photons (normalized at chi2=1.4)
Blue histograms on Figures 6-8 shows chi2 distribution from MC-pions (normalized at chi2=1.4)
Figure 6: Chi2/ndf for gamma-jet candidates using Monte Carlo shape
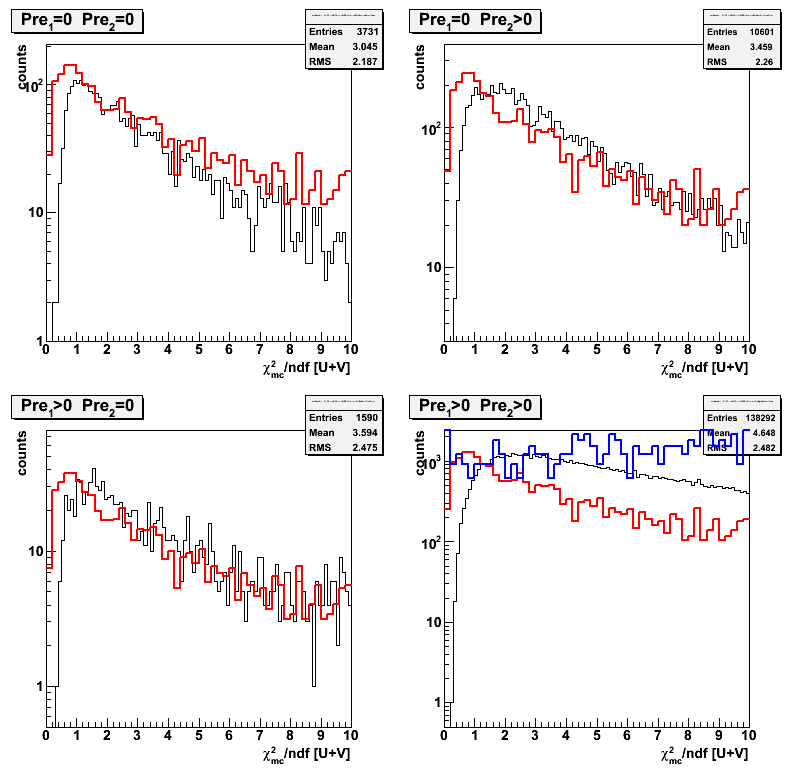
Figure 7: Chi2/ndf for gamma-jet candidates using Will's shape (derived from eta candidates based on Weihong's pi0-finder)
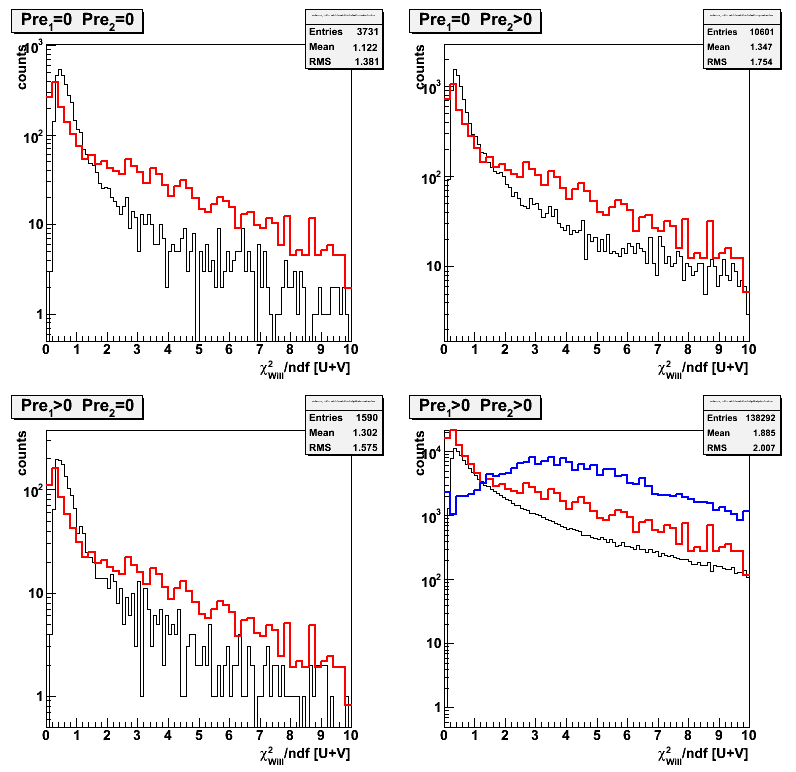
Figure 8: Chi2/ndf for gamma-jet candidates using Pibero's shape (derived from eta candidates)
- Printer-friendly version
- Login or register to post comments