2008.04.03 chi2-shape subtraction for different Preshower conditions
Ilya Selyuzhenkov April 03, 2008
Request from Hal Spinka:
Hi Ilya,
I think you gave up on the chi-squared method too quickly, and am sorry I missed the phone meeting last week. So, I would like to make a request that will hopefully take a minimal amount of your time to show that all is okay. Then, if there is a delay in getting the sided residual information out and into the beam use request, you can still fall back on the chi-squared method.
In your March 28 posting, Figure 8 at the bottom, I would like to get numerical values for the events per bin for the black curves. I won't use the preshower1>0 and preshower2=0 data, so those you don't need to send. Also, I won't use the red or blue curve information.
I think your problem has been that you normalized your curves at chi-squared/ndf = 1.4 instead of the peak. What I plan to do is to normalize the (pre1=0, pre2=0) to the (pre1=0, pre2>0) data in the peak and subtract. The (pre1=0, pre2=0) set should have some single photons, but also some multiple photons. The (pre1=0, pre2>0) should also have single photons, and more multiple photons, since the chance that one of them will convert is larger. The difference should look roughly like your blue curve, though perhaps not exactly if Pibero's mean shower shape is not perfect (which it isn't). I will do the same thing with taking the difference between (pre1>0, pre2>0) and (pre1=0, pre2=0), and again the difference should look roughly like your blue curve. The (pre1>0, pre2>0) data should have even larger fraction of multiple photons than either of the other two data sets. I would expect the two difference curves to look approximately the same.
Hope this is possible for you to do. Since our reduced chi-squared curve looks so much like the one from CDF, I am pretty confident that we are okay, but this should be checked to convince people that we are not doing anything terribly wrong.
Reply by Ilya:
Dear Hal,
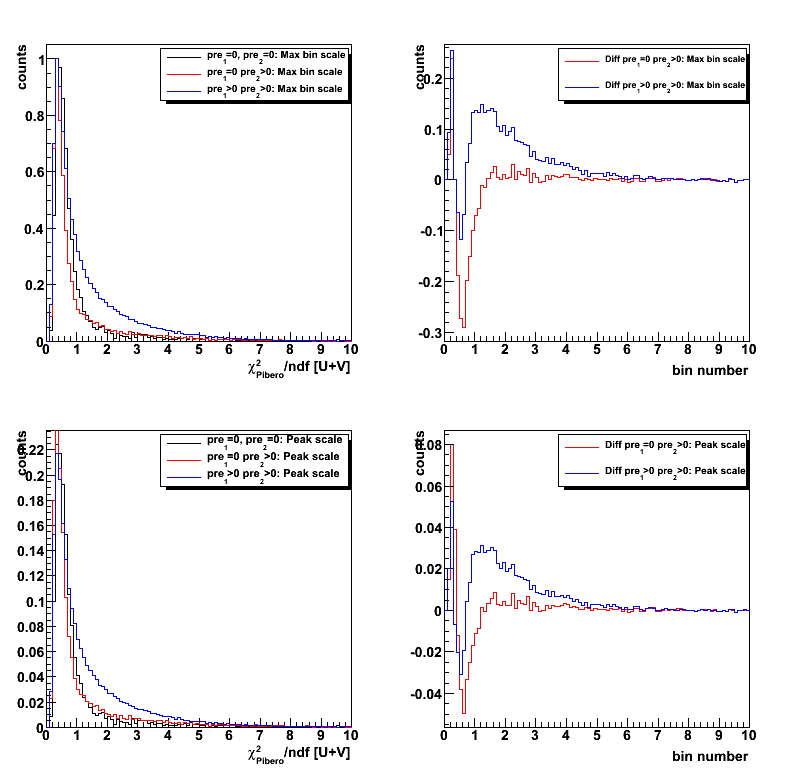
I have tried to implement your idea and produce a figure attached.
There are 4 plots in it:
1. Upper left plot shows normalized to unity (at maximum) chi2 distribution (obtained with Pibero shape for gamma-jet candidates) for a different pre1, pre2 conditions
2. Upper right plot shows bin-by-bin difference: a) between normalized chi2 for pre1=0, pre2>0 and pre1=0, pre2=0 (red) and b) between normalized chi2 for pre1>0, pre2>0 and pre1=0, pre2=0 (blue)
3. Bottom left Same as upper right, but normalization were done based on the integral within [-4,4] bins around maximum.
4. Bottom right Same as for upper right, but with a different normalization ([-4,4] bins around maximum)
I have also tried to normalized by the total integral, but the results looks similar.
Figure 1: See description above
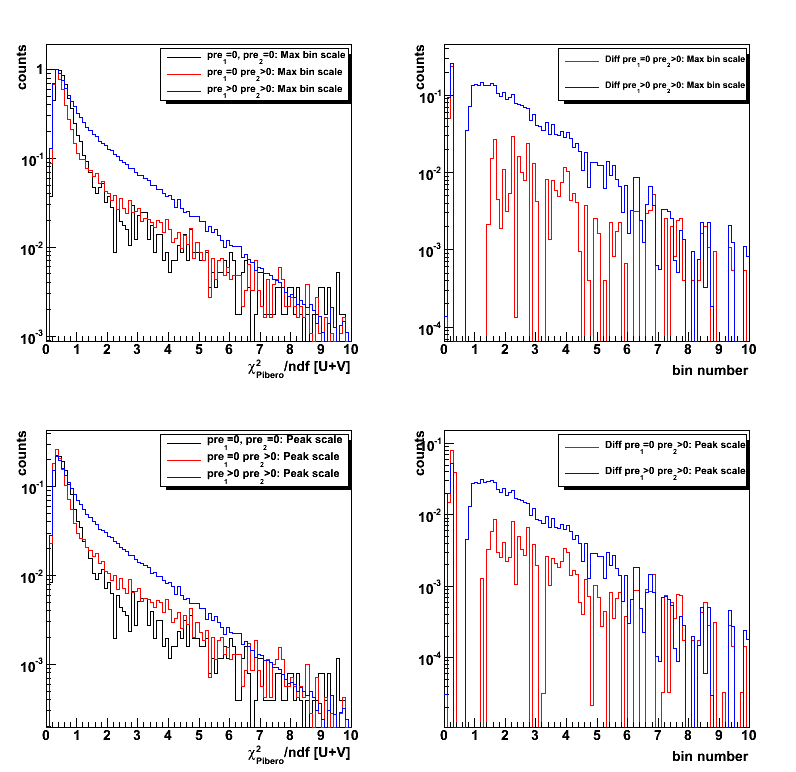
Figure 2: Same without log scale (See description above)
- Printer-friendly version
- Login or register to post comments