2008.11.11 Yields vs. analysis cuts
Ilya Selyuzhenkov November 11, 2008
Data sets:
- pp2006 - STAR 2006 pp longitudinal data (~ 3.164 pb^1)
after applying gamma-jet isolation cuts (R_cluster > 0.9 is used below). - gamma-jet[gamma-filtered] - data-driven Prompt Photon [p6410EemcGammaFilter] events.
Partonic pt range 2-25 GeV. - QCD jets[gamma-filtered] - data-driven QCD [p6410EemcGammaFilter] events.
Partonic pt range 2-25 GeV.
Figure 1: Reconstructed gamma pt for di-jet events and
Geant cuts: pt_gamma[Geant] > 7GeV and 1.05 < eta_gamma[Geant] < 2.0
Total integral for the histogram is: N_total = 5284
(after weighting different partonic pt bins and scaled to 3.164pb^-1).
Compare with number from Jim Sowinski study for
Endcap East+West gamma-jet and pt>7 GeV: N_Jim = 5472
( Jim's numbers are scaled to 3.164pb^-1 : [2539+5936]*3.164/4.9) 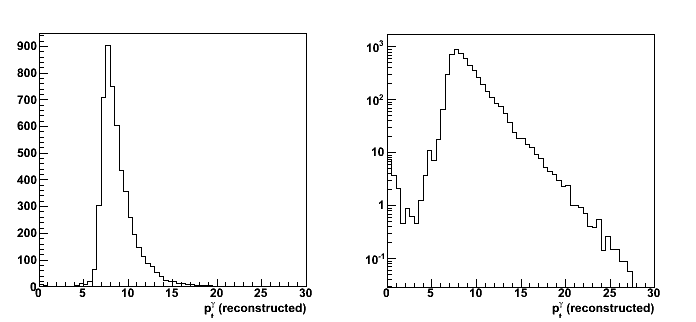
Figure 2: Reconstructed jet pt for di-jet events and the same cuts as in Fig. 1

Yield vs. various analysis cuts
List of cuts (sorted by bin number in Figs. 2 and 3):
- N_events : total number of di-jet events found by the jet-finder
- cos(phi_gamma - phi_jet) < -0.8 : gamma-jet opposite in phi
- R_{3x3cluster} > 0.9 : Energy in 3x3 cluster of EEMC tower to the total jet energy
- R_EM^jet < 0.9 : neutral energy fraction cut for on away side jet
- N_ch=0 : no charge tracks associated with a gamma candidate
- N_bTow = 0 : no barrel towers associated with a gamma candidate (gamma in the endcap)
- N_(5-strip cluster)^u > 2 : minimum number of strips in EEMC SMD u-plane cluster around peak
- N_(5-strip cluster)^v > 2 : minimum number of strips in EEMC SMD v-plane cluster around peak
- gamma-algo fail : my algorithm failed to match tower with SMD uv-intersection, etc...
- Tow:SMD match : SMD uv-intersection has a tower which is not in a 3x3 cluster
Figure 3: Number of accepted events vs. various analysis cuts
The starting number of events (shown in first bin of the plots) is
the number of di-jets with reconstructed gamma_pt>7 GeV and jet_pt>5 GeV
upper left: cuts applied independently
upper right: cuts applied sequentially
lower left: ratio of pp2006 data vs. MC sum of gamma-jet and QCD-jets events (cuts applied independently)
lower right:ratio of pp2006 data vs. MC sum of gamma-jet and QCD jets events (cuts applied sequentially)
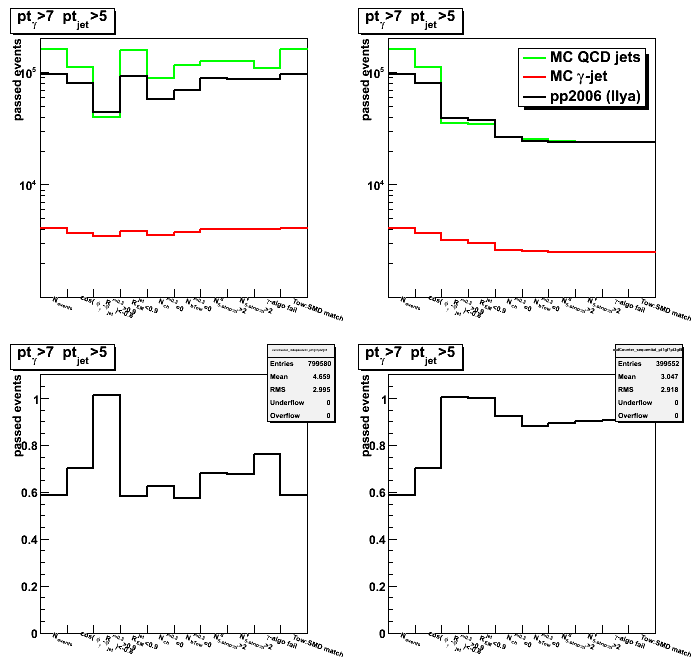
Figure 4: Number of accepted events vs. various analysis cuts
Data from Fig. 3 (upper plots) scaled to the initial number of events from first bin:
left: cuts applied independently
right: cuts applied sequentially

- Printer-friendly version
- Login or register to post comments