- Bulk correlations
- Common
- GPC Paper Review: ANN-ASS pp Elastic Scattering at 200 GeV
- Hard Probes
- Heavy Flavor
- Abstracts, Presentations and Proceedings
- Comparisons between STAR and PHENIX
- HF PWG QM2011 analysis topics
- HF PWG Embedding page
- HF PWG Preliminary plots
- HF PWG Weekly Meeting
- Heavy Quark Physics in Nucleus-Nucleus Collisions Workshop at UCLA
- NPE Analyses
- PWG members and analysis
- PicoDst production requests
- Upsilon Analysis
- Combinatorial background subtraction for e+e- signals
- Estimating Acceptance Uncertainty due to unknown Upsilon Polarization
- Estimating Drell-Yan contribution from NLO calculation.
- Response to PRD referee comments on Upsilon Paper
- Upsilon Analysis in Au+Au 2007
- Upsilon Analysis in d+Au 2008
- Upsilon Analysis in p+p 2009
- Upsilon Paper: pp, d+Au, Au+Au
- Using Pythia 8 to get b-bbar -> e+e-
- Varying the Continuum Contribution to the Dielectron Mass Spectrum
- WWW
- Jet-like correlations
- LFS-UPC
- Measurement of Single Transverse Spin Asymmetry, A_N in Proton–Proton Elastic Scattering at √s = 510 GeV
- Other Groups
- Peripheral Collisions
- Spin
Invariant Mass
Updated on Fri, 2010-09-17 18:18. Originally created by rjreed on 2010-09-02 14:51.
Under:
0-60% Centrality
From ntuple generated on 5/25/2010. Macro MacroUpsAAInvMassMakeHistosFromTree06012010.C is attached.
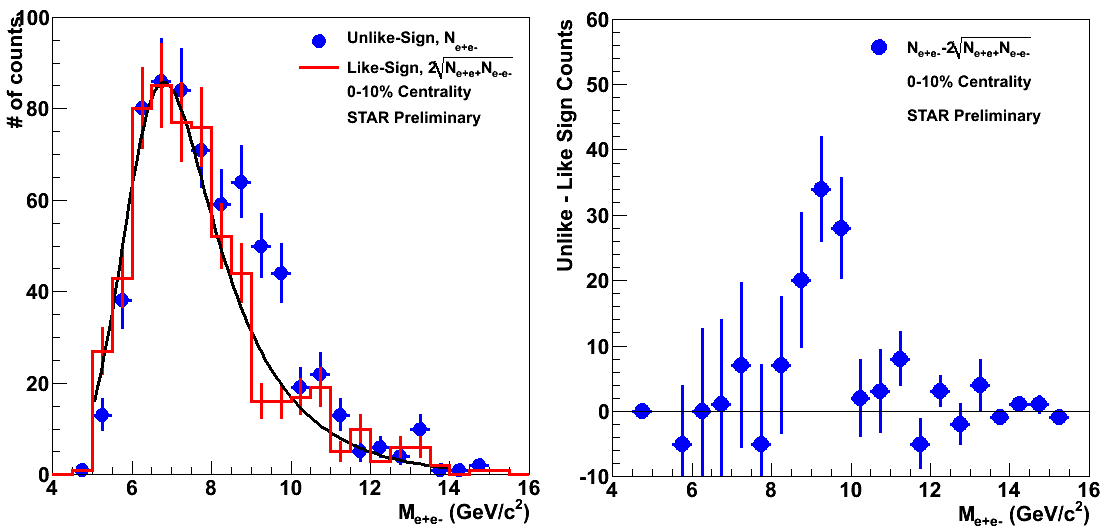
Figure 1: Invariant mass plots for 0-60% centrality. Generated with cuts -1.4<nSigmaElectron<3.0, 0.8<E/p<1.4, refMult>47. m_0 shfit was calculated to be 6.36+/-0.20 and wdith is 1.10+/-0.15. For 8<=m<=11 n+- = 258, n++ = 90, n-- = 74.
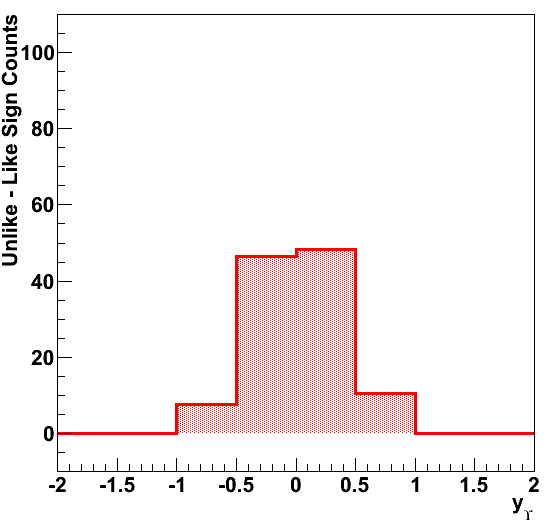
Figure 2: Invariant Mass versus rapdity for 0-60% centrality.
For refMult > 50 all values remained the same. For refMult>44, n+- =259 but everything else remained the same.
This indicates that the systematic uncertainty on dN/dy for the 0-60% centrality is extremely small.
0-10%
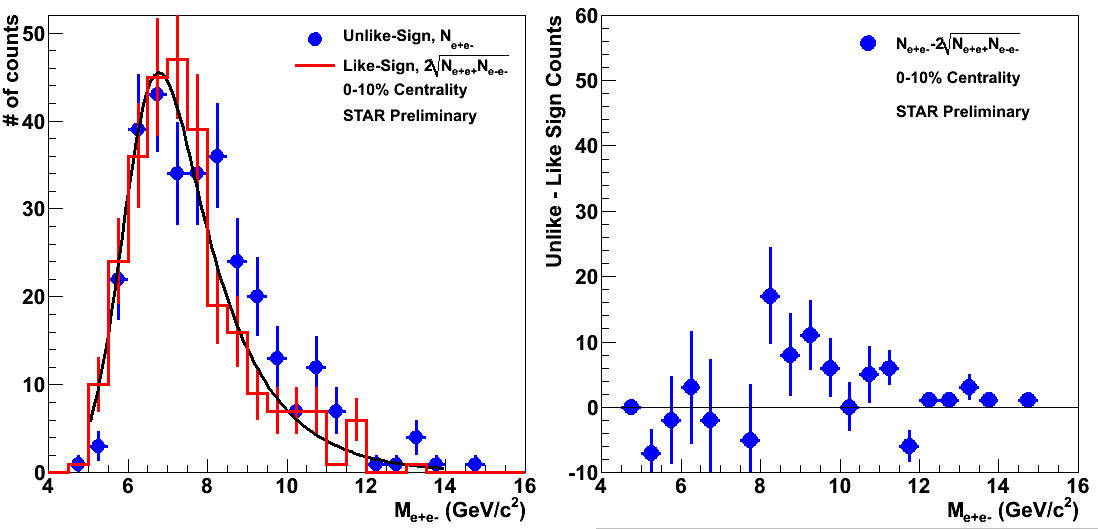
Figure 3: Invariant mass plots for 0-10% with the same cuts as Figure 1 except refMult>430. m_0shift = 6.39 +/- 0.25 and width 0.99 +/- 0.15. n+- = 112, n-- = 28, n++ = 37.

Figure 4: Invariant mass versus rapidty for 0-10% centrality.
For refMult>449 m_0 shift = 6.50 +/- 0.32 width = 1.05 +/- 0.18
n+- = 104, n-- = 28, n++ = 35
For refMult>411 m_0 shift 6.41 +/- 0.28 width = 1.10 +/- 0.17
n+- = 140, n-- = 35, n++ = 44
ref>449
N++ = 34
N-- = 28
N+- = 98
ref>411
N++ = 43
N-- = 35
N+- = 133
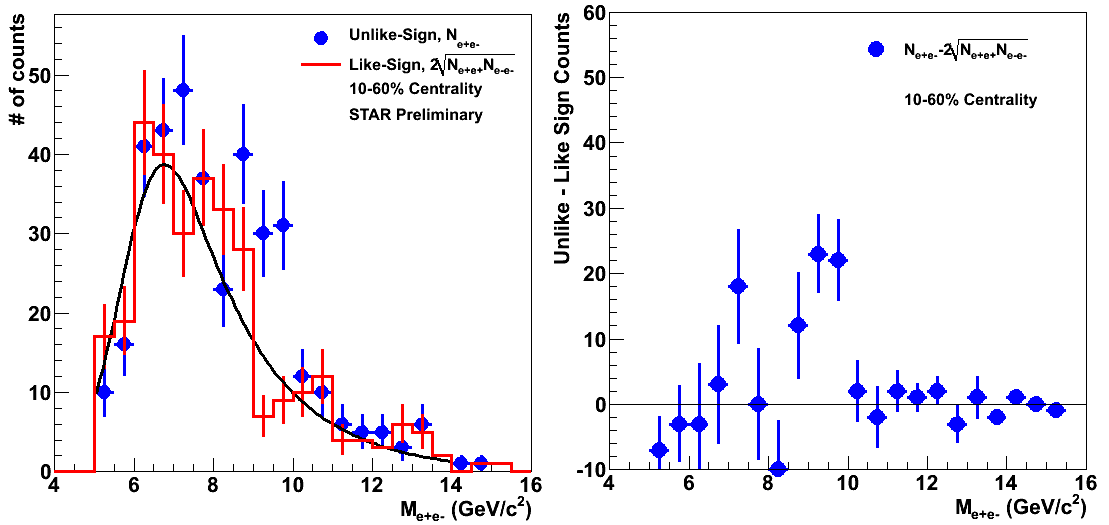
Figure 5: Invariant mass plots for 10-60% with the same cuts as Figure 1 except 47<refMult<430. m_0shift = 6.20 +/- 0.33 and width 1.16 +/- 0.29. n+- = 146, n-- = 46, n++ = 53.
The lower cut in refMult does not change the value much, see discussion for Figures 1 and 2. If we vary the higher refMult cut, the results are:
47<ref<449
N++ = 56
N-- = 46
N+- = 157
47<ref<411
N++ = 46
N-- = 39
N+- = 125
For the 3 cases, we can calculate the signal (upsilon+DY+b-bbar) as:
0-10% S = 48 +/- 13(stat) +7/-12 (sys)
10-60% S = 47 +/-16(stat) +8/-7 (sys)
0-60% S = 95 +/- 21(stat) +1/-0 (sys)
Where the systematic errors here are only related to the uncertainty in the centrality definition. The uncertainty in the efficiency due to the centrality selection will be calculated using embedding. I looked at the differences in the yield from data because the refMult distribution of upislon candidates is drastically different than the triggered or minbias distribution. It is heavily weighted towards the central end, which is why uncertainty on the cut for 60% central events doesn't make a large difference. We don't really have any upsilon candidate events with refMult < 47 (candidate defined as a trigger cluster with tracks extrapolated to the clusters with basis PID cuts).
In the 0-60% centrality case, we unfortunately have a downward fluctuation in the background curve right under the upsilon peak. Instead of using the background histogram, I populated a histogram using the fit to the background and filled it with the same number of counts as the original background. I then set the error bars in each bin of the new histogram to the same values as in the original background histogram.
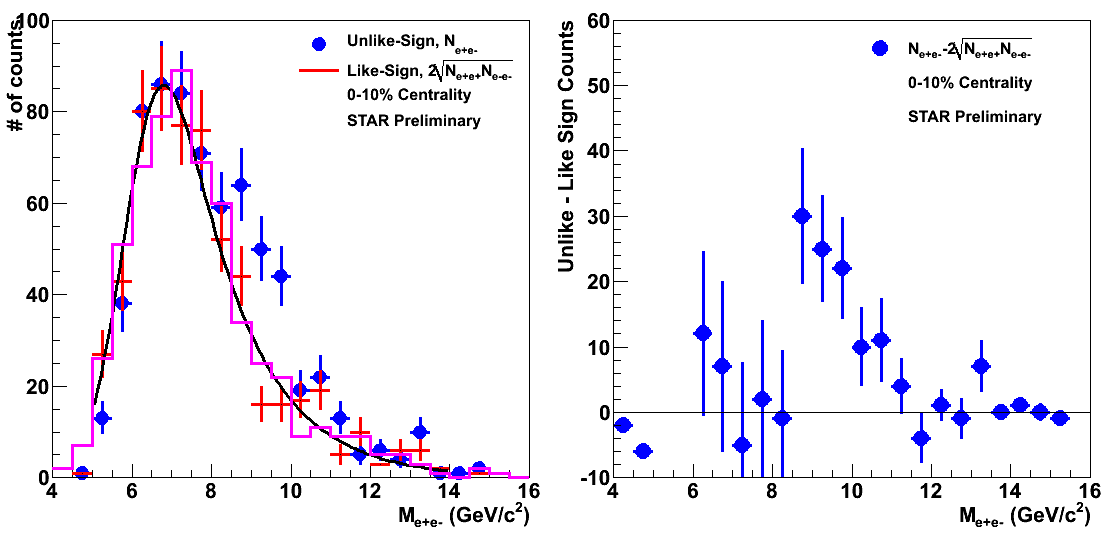
Figure 5: Purple histogram on the left is the created histogram and the histogram on the right is the subtracted histogram using the purple histogram instead of the red background histogram. The resulting counts are 101 in the signal region. The number when using the background histogram is 103.
»
- Printer-friendly version
- Login or register to post comments