Upsilon Analysis in p+p 2009 - pT Spectra
Upsilon cross-section in p+p collisions at sqrt(sNN) = 200 GeV, 2009 data - pT Spectra
Note: All data plots are currently using -2 < nσe < 3 which is not optimized for this analysis!
Note: All data plots are using every run; run-by-run QA has not yet been completed!
- pT Spectra (Drew)

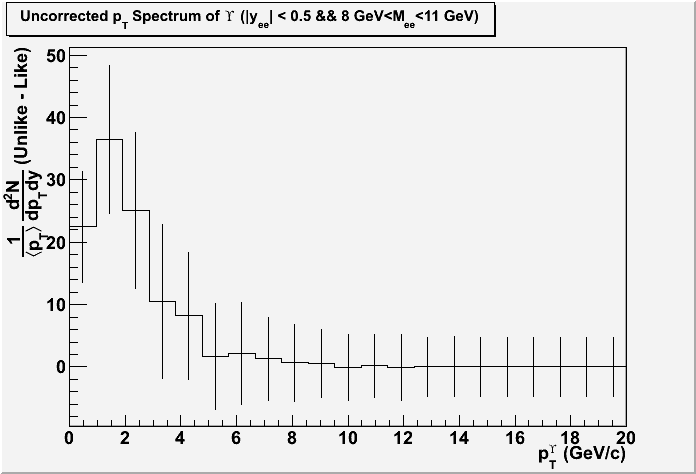
- First stab at pT spectrum of Upsilons from ee daughters. This does not have efficiency corrections yet.
- DY and bbbar are "subtracted" by multiplying the bin by the ratio of Yeild(Upsilon)/Yeild(Upsilon+DY+bbbar).
- The errors are added in quadrature, which is correct only to first order for this DY and bbbar "subtraction".
- <pT> is just the mean of the bin, not the mean of the hits in the bin
- Improvements on the way
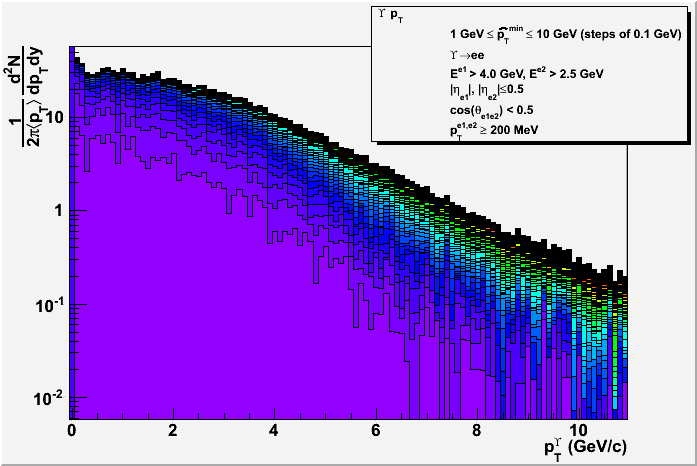
- pQCD Upsilon pT Spectra
- p+p √S = 200 GeV
- Pythia 8.1.53 with the following cuts:
- Upsilon -> ee pair
- Can only detect this decay channel
- Ee1 > 4.0 GeV, Ee2 > 2.5 GeV
- L2 trigger
- need to verify the actual trigger.. changed from 2006 to 2008/9
- L2 trigger
- |ηe1| < 0.5, |ηe2| < 0.5
- mid-rapidity
- cos(θe1e2) < 0.5
- Ensure the electrons are roughly back-to-back
- pT e1 > 200 MeV, pT e2 > 200 MeV
- Upsilon -> ee pair

- 2.5 M p+p->bbbar events for each pTHatMin
- 1 GeV <= pTHatMin <= 10 GeV in steps of 0.10 GeV
- Boosts the statistics of less likely collisions
- Stacked histograms together
- normalization factor: (cross section at X GeV) / (cross section at 1.0 GeV)
- First bin is basically divided by 0 and is cutoff
Groups:
- Printer-friendly version
- Login or register to post comments
