2009.09.11 Test of corrected EEMC geometry: LOW_EM cuts
Test of corrected EEMC geometry: SVT and LOW_EM cuts
Monte-Carlo setup:
- One particle per event (only photons in this post)
- Full STAR 2006 geometry (with/without SVT, LOW_EM cuts)
In Kumac file: detp geom y2006g; gexec $STAR_LIB/geometry.so (vary SVTT_OFF, LOW_EM)
LOW_EM cut definition is given at the end of this page - Throw particles flat in eta (1.2, 1.9), phi (0, 2pi), and pt (6-10 GeV)
- Using A2Emaker to get reconstructed Tower/SMD energy
(this post: no EEMC SlowSimulator) - Vertex z=0
- ~50K/per iteration
- Non-zero energy: 3 sigma above pedestal
Color coding:
- SVT, LOW_EM marked in legend as LowEM (single photon MC)
- STV, no-LOW_EM marked in legend as default (single photon MC)
- no-SVT, no-LOW_EM marked in legend as no-SVT (single photon MC)
- photon-jet candidates [pp2006] (used data points from this post)
- photons from eta-meson [pp2006]
Pre-shower bins:
- Ep1 = Ep2 = 0 (no energy in both EEMC pre-shower layers)
- Ep1 = 0, Ep2 > 0
- 0 < Ep1 < 4 MeV
- 4 < Ep1 < 10 MeV
- Ep1 > 10 MeV
- All pre-shower bins combined
Note: Ep1/Ep2 is the energy deposited in the 1st/2nd EEMC pre-shower layer.
For a single photon MC it is a sum over
all pre-shower tiles in the EEMC with energy of 3 sigma above pedestal.
For eta-meson/gamma-jet candidates from pp2006 data the sum is over 3x3 tower patch
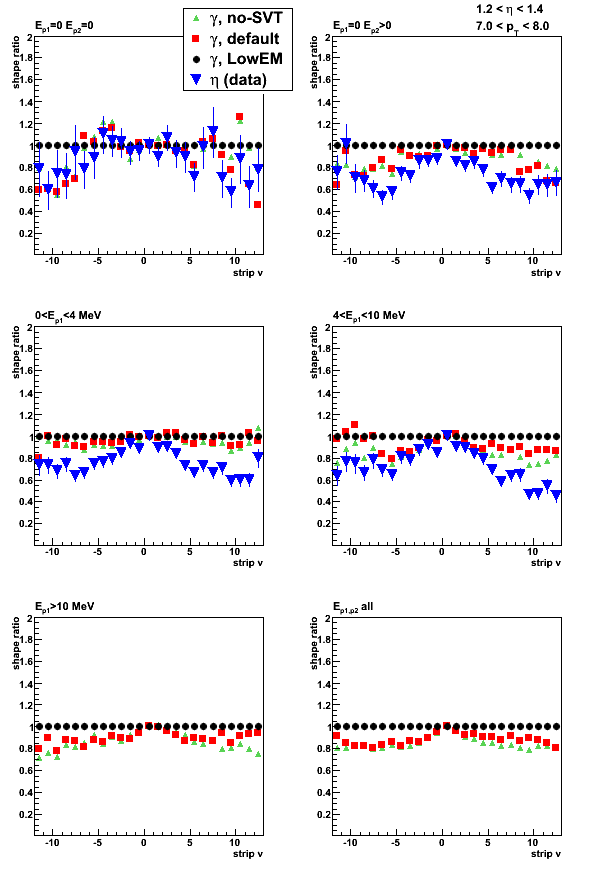
Shower shapes
Single particle kinematic cuts: pt=7-8GeV, eta=1.2-1.4
Eta-meson shower shapes (blue) taken from Fig. 1 from here of this post
All shapes are normalized to 1 at peak (central strip)
Figure 1: Shower shape sorted by pre-shower conditions.

Figure 2: Shower shape ratio. All shapes in Fig. 1 are divided by single photon shape
for "SVT+LOW_EM" configuration (black circles in Fig. 1)
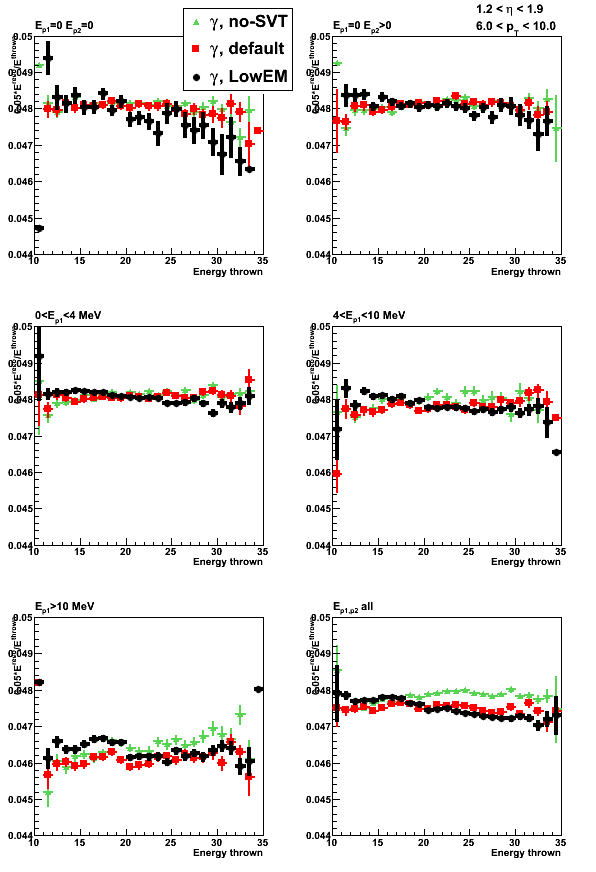
Sampling fraction
Figure 3: Sampling fraction (0.05 * E_reco/ E_thrown)
Pre/post-shower energy and migration
Figure 4: Pre-shower1 energy (all tiles)

Figure 5: Pre-shower2 energy (all tiles)

Figure 6: Post-shower energy (all tiles)
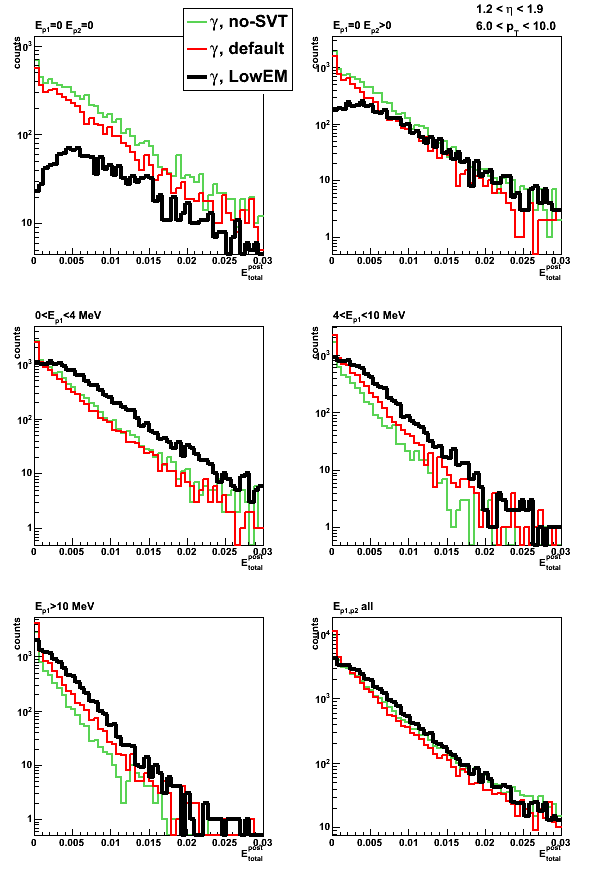
Figure 7: Pre-shower bin photon migration

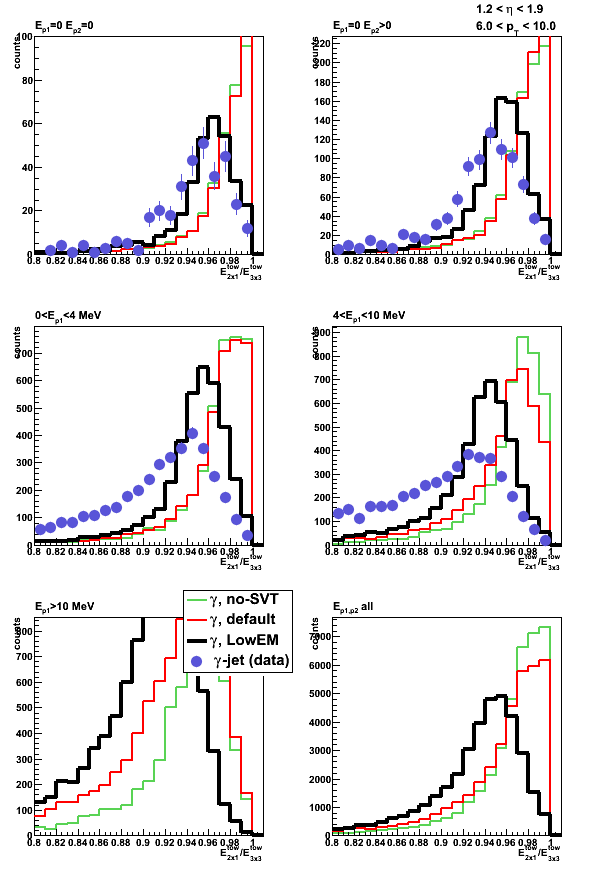
Tower energy profile
Figure 8a: Energy ratio in 2x1 to 3x3 cluster
For the first 4 pre-shower bins total yield in MC is normalized to that of the data
Blue circles indicate photon-jet candidates [pp2006] (points from this post)
Same data on a linear scale

Figure 8b: Energy ratio in 2x1 to 3x3 cluster: 7 < pt < 8 and 1.2 < eta < 1.4
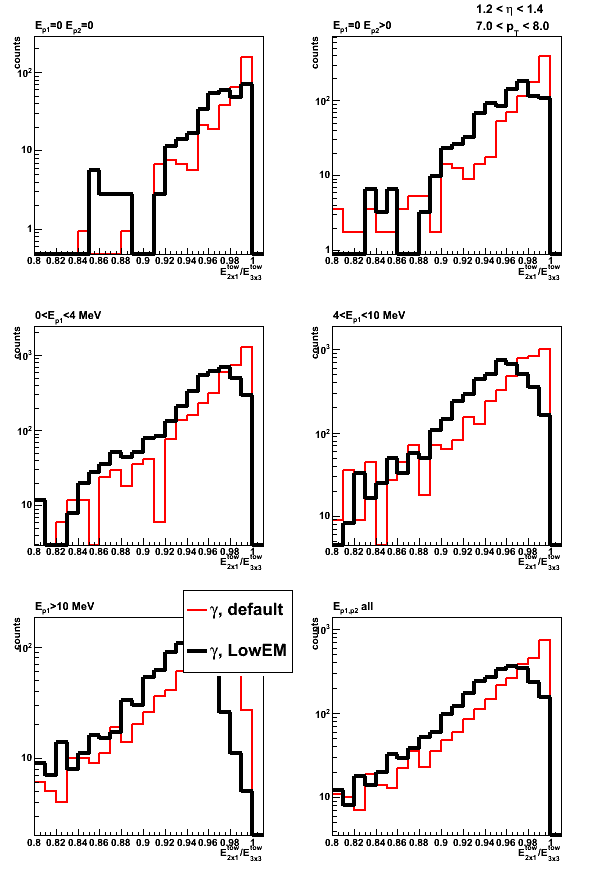
Figure 8c: Energy ratio in 2x1 to 3x3 cluster: 7 < pt < 8 and 1.6 < eta < 1.8
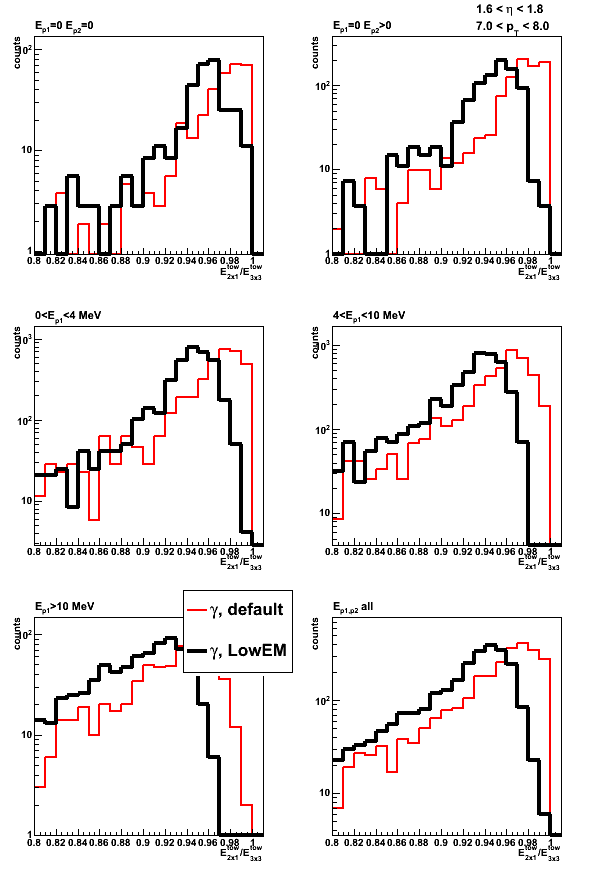
Figure 9: Average energy ratio in 2x1 to 3x3 cluster vs. thrown energy
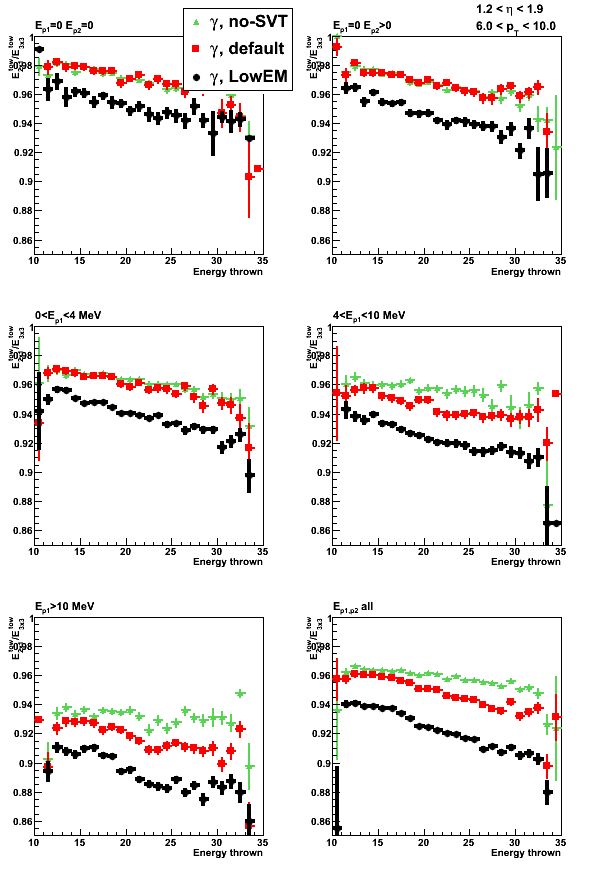
Figure 10: Average energy ratio in 2x1 to 3x3 cluster vs. thrown energy

LOW_EM cut definition
LOW_EM option for the STAR geometry (Low cuts on Electro-Magnetic processes)
is equivalent to the following set of GEANT cuts:
- CUTGAM=0.00001
- CUTELE=0.00001
- BCUTE =0.00001
- BCUTM =0.00001
- DCUTE =0.00001
- DCUTM =0.00001
All these values are for kinetic energy in GeV.
Cut meaning and GEANT default values:
- CUTGAM threshold for gamma transport (0.001);
- CUTELE threshold for electron and positron transport (0.001);
- BCUTE threshold for photons produced by electron bremsstrahlung (-1,);
- BCUTM threshold for photons produced by muon bremsstrahlung (-1);
- DCUTE threshold for electrons produced by electron delta-rays (-1);
- DCUTM threshold for electrons produced by muon or hadron delta-rays (-1);
Some details can be found at this link and in the GEANT manual
- Printer-friendly version
- Login or register to post comments