- BEMC
- BEMC Detector Operator Manual
- Calibrations
- Database
- Hardware
- Mapping
- Service Tasks
- Software
- Useful Documents
- EEMC
- ETOF
- FCS
- FGT
- FPD & FMS & FPS
- FTPC
- FTT
- HLT
- L3
- PMD
- PP2PP
- RICH
- Roman Pot Phase II*
- SSD
- SVT
- Slow Controls
- TPC
- TRG
- Trigger Detectors
- VPD
- test
MIP check on 2006 Slope Calibration
Updated on Wed, 2007-03-21 09:05. Originally created by kocolosk on 2006-10-31 09:10.
Under:
~300k events processed using fastOffline:
Run 7079034 ~189K
Run 7079035 ~115K
Number of events with nonzero primary tracks = 109k / 309k = 35%
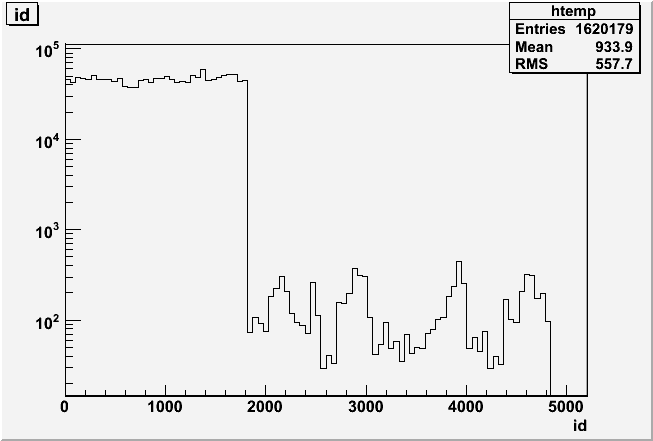
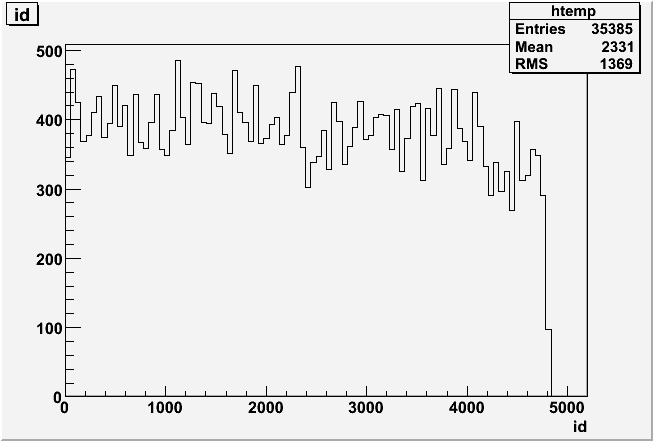
Still a few problems with pedestal widths in the database, although now they appear to be restricted to id > 4200. If I don't cut on adc>2*rms, the software id distribution of MIPs looks pretty isotropic:
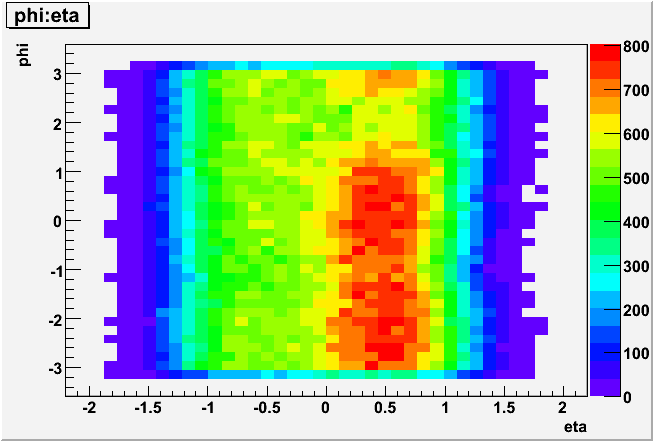
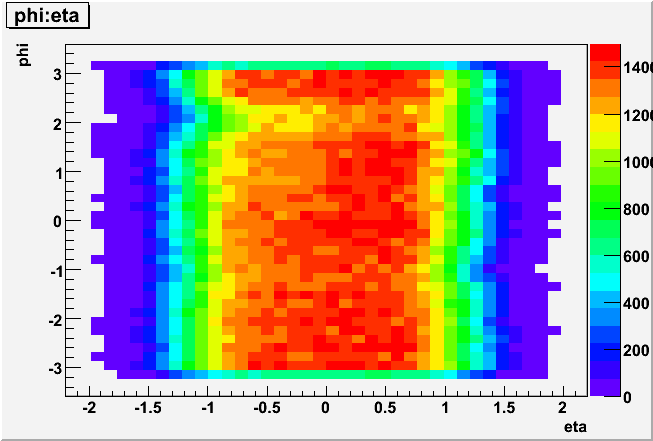
The distribution of primary tracks also looks a lot better:
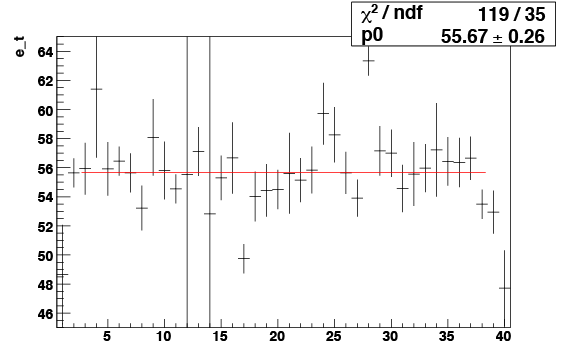
I was able to calculate MIP gains for each of the 40 eta-rings. The plot at the top fits a line to the full-scale transverse energies extracted from the gains (excluding the outer two eta-rings on each side). For the error calculations I used the error on the extraction of the mean of the MIP ADC peak and propagated this through the calculation. This is not exactly correct, but it's a pretty close approximation. In a couple of cases the error was exceedingly small (10^-5 ADC counts), so I forced it to an error of 1 GeV (the fit failed if I didn't).
As you can see in the text file, an error of 1 ADC in the MIP peak leads to an error of 3 GeV in the full-scale transverse energy. Therefore I would say that pedestal fluctuations (1-2 ADCs) give an additional error of 5 GeV to my calculations, which means that the majority of these eta-rings are consistent with a 60 GeV full-scale.
Conclusions:
- A straight-line fit yields 56 GeV as the average full-scale transverse energy of the towers
- We have enough stats; errors are dominated by pedestal fluctuations leading to a 5 GeV uncertainty
- Tower response is flat in E_t across eta-rings (excluding last two rings where MIPs fail)
- Good job Stephen and Oleg!
The First Attempt
Note: The first attempt at this analysis was plagued by poor TPC tracking and also problems with corrupted BTOW pedestal widths in the database. I'm including the content of the original page here just to document those problems.
250k events processed using fastOffline:
Run 7069023 100K
Run 7069024 100K
Run 7069025 50K
Number of events with nGlobalTracks > 0 = 30166 (12%)
On the left you see the software id distribution of slope candidates (adc-ped>3*rms, no tracking cuts). There's a sharp cutoff at id==1800. But before you go blaming the BEMC for the missing MIPs, the plot on the right shows eta-phi distribution of global tracks without any EMC coincidence. The hot region in red corresponds to 0<id<1800:


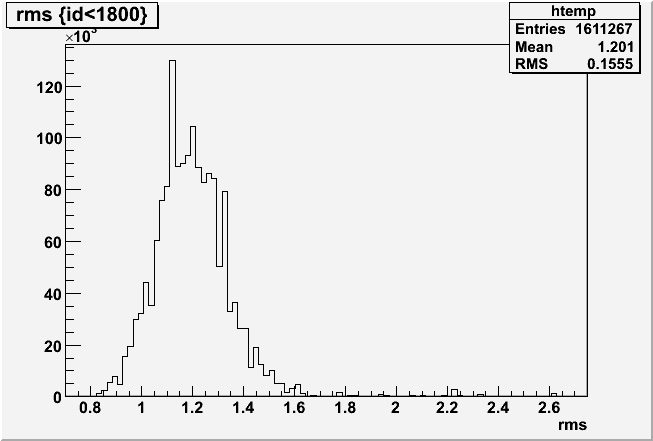
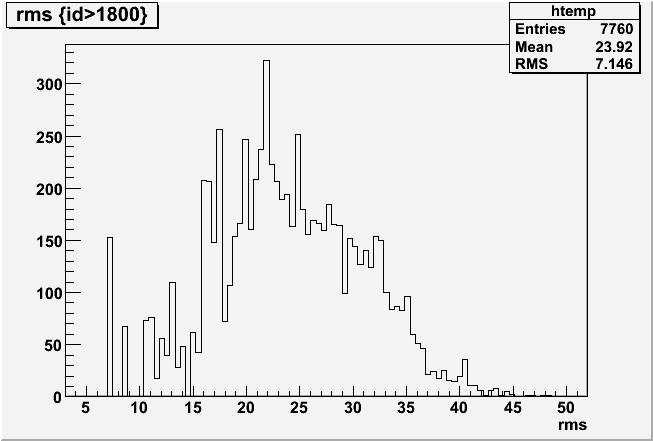
As it turns out, the missing slope candidates are likely due to wide pedestals. The pedestal values look fine, but if I plot pedrms for id<1800 and id>1800 using the slope candidates that did survive:


Is it possible that the TPC track distribution is connected to this problem?
»
- Printer-friendly version
- Login or register to post comments

