- General information
- Data readiness
- Calibration
- BeamLine Constraint
- Calibration Run preparation
- Calibration Schedules
- Calibration topics by dataset
- Docs
- STAR Automated Calibration Project
- SVT Calibrations
- TPC Calibrations
- Drift velocity
- Enter TPC gains into database
- Field Cage Shorts
- Miscellaneous TPC calibration notes
- Padrow 13 and Padrow 40 static distortions
- RunXI dE/dx calibration recipe
- SpaceCharge and GridLeak
- SpaceCharge and GridLeak Calibration How-To Guide
- Effect of SVT and SSD on SpaceCharge Calibration
- SpaceCharge azimuthal anisotropy
- AuAu15 (2014)
- AuAu19 (2011)
- AuAu200 (2004)
- AuAu200 (2007)
- AuAu200 (2011)
- AuAu200 (2014)
- AuAu200 (2016)
- AuAu27 (2011)
- CuAu200 (2012)
- CuCu200 (2005)
- CuCu22 (2005)
- GridLeak R&D
- UU193 (2012)
- dAu20 (2016)
- dAu200 (2008)
- dAu200 (2016)
- dAu39 (2016)
- dAu62 (2016)
- pAl200 (2015)
- pAu200 (2015)
- pp200 (2006)
- pp200 (2009)
- pp200 (2015)
- pp400 (2005)
- pp500 (2011)
- pp510 (2012)
- pp510 (2013)
- pp62 (2006)
- TPC Hit Errors
- TPC OmegaTau
- TPC Sector Alignment
- TPC Slewing
- TPC T0s
- TPC de/dx
- TPC survey instructions
- Twist (ExB) Distortion
- Databases
- Quality Assurance
- Calibration
- Grid and Cloud
- Infrastructure
- Machine Learning
- Offline Software
- Production
- S&C internal group meetings
- Test tree
dAu200 (2008) SpaceCharge calibration quality check
Updated on Tue, 2009-04-21 20:19. Originally created by genevb on 2009-04-21 17:56.
Under:
The improved SpaceCharge calibration from August 2008 was used in the P08ie productions of Run 8 dAu data. To verify that it did what was expected, I regenerated the plot of signed DCA distributions as dAu200 (2008). This sample is predominantly data recorded in January 2008. The result is shown here:
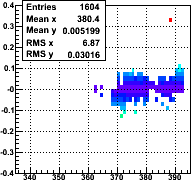
This looks similar to the "after" estimate with the exception of the red point with a signed DCA of 0.33cm (despite it, the mean DCA is within 52 microns of zero). This outlier point is a notable example of the fact that this production did not automatically handle stuck RICH scalers (see the mention earlier on this page of the anomalous RICH scalers as well as a more thorough discussion Finding a cut for corrupt scalers in Run 8 dAu).
In more detail, the outlier point is from run 9023014, during which the ZDC east scaler got stuck, clearly seen in the following plot (black points are mean DCA vs. event number, and the red histogram denotes when the timestamp of the event changes by a second, serving as a clock to show the stuck data lasting only a couple seconds):
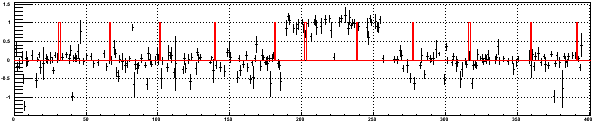
So a portion of this run's data (about 70 events out of the 400 which I examined in this file alone) has been corrected improperly, leading to signed DCAs of about 1 cm. Such data is unusable for physics and should be discarded. I therefore re-ran the data using Cutting events with corrupt RICH scalers in analyses which have been found to help and the results are slightly better:
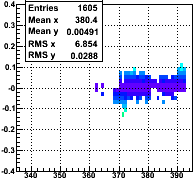
So the improved SpaceCharge calibration is certainly effective as determined by the measure of mean signed DCAs, with the caveat that the RICH scaler cuts need to be used for the P08ie production.
However, this is not the only indicator of the calibration performance. In particular, the width of the signed DCA distribution can be informative and was used to study performance in You do not have access to view this node:
There are two things to note about this plot:
- The means are offset from zero a bit, inconsistent with the plot shown earlier on this page. The plot was made with (in principle) the same data and I am still looking into this difference.
- The widths are generally in the range of about 0.2 cm, notably larger than they were in You do not have access to view this node. This also needs some further understanding.
-Gene
»
- Printer-friendly version
- Login or register to post comments