2008.04.09 Applying gamma-jet reconstruction algorithm for gamma-jet simulated events
Ilya Selyuzhenkov April 09, 2008
Data sample:
Monte-Carlo gamma-jet sample for partonic pt range of 5-7, 7-9, 9-11,11-15, 15-25, 25-35 GeV.
Analysis: Simulated MuDst files were first processed through jet finder algorithm (thanks to Renee Fatemi),
and later analyzed by applying gamma-jet isolation cuts (see this link for details) and studying EEMC SMD response (see below).
To test the algorithm, Geant records were not used in this analysis.
Further studies based on Geant records (yield estimates, etc) are ongoing.
EESMD shapes comparison
Figure 1:Comparison between shower shape profile for data and MC.
Black circles shows results for MC gamma-jet sample (all partonic pt).
For v-plane results see this figure
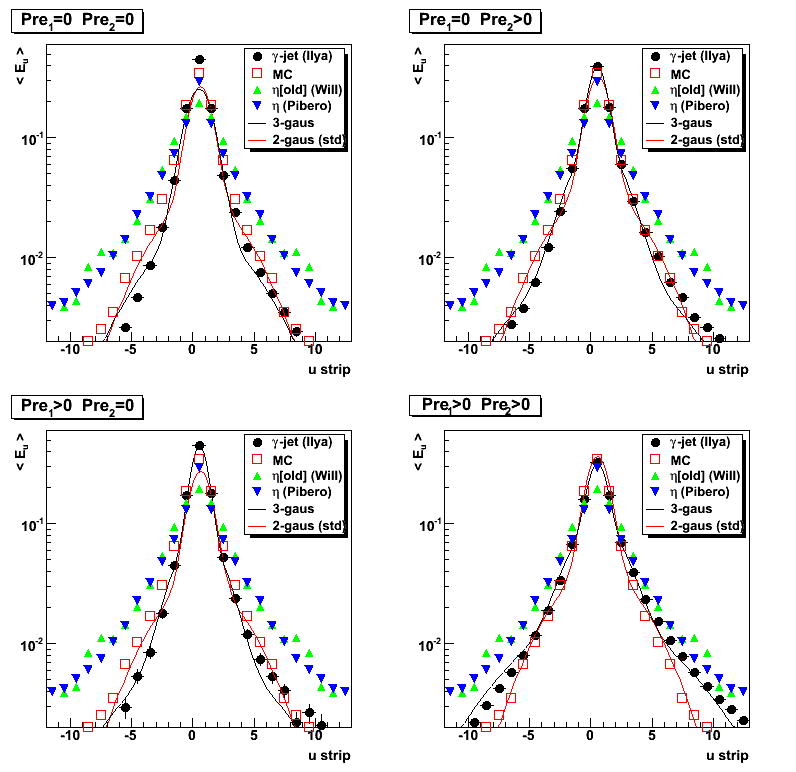
Correlation between gamma and jet pt, eta, phi
Figure 2:Gamma vs jet transverse momentum.
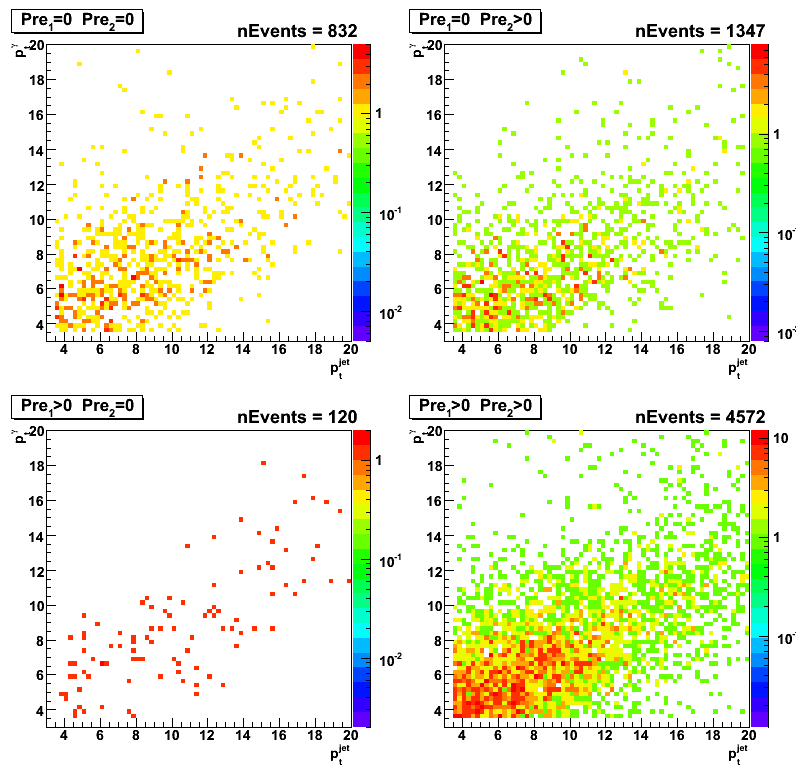
Figure 3:Gamma vs jet azimuthal angle.
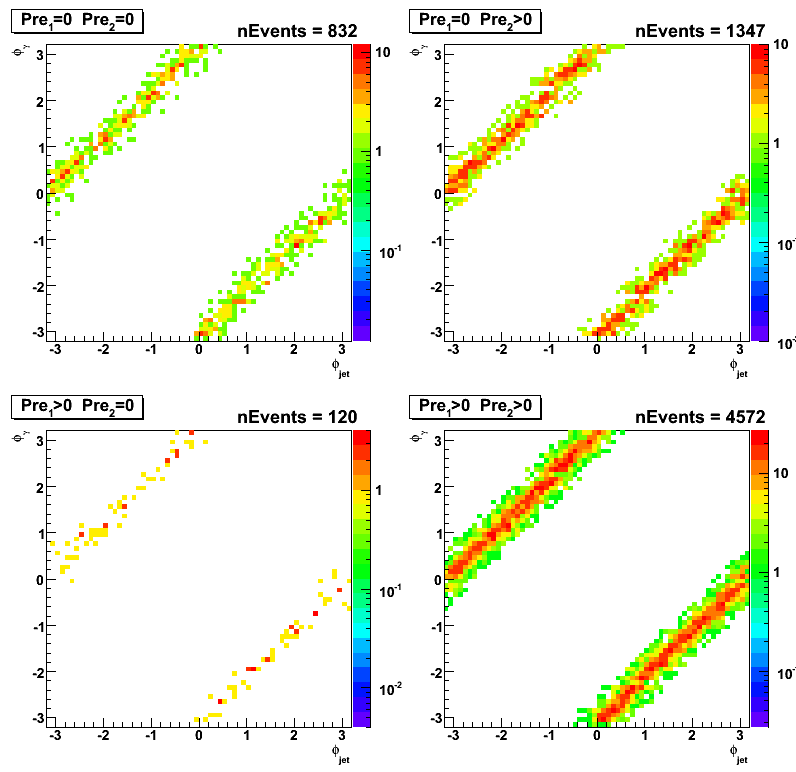
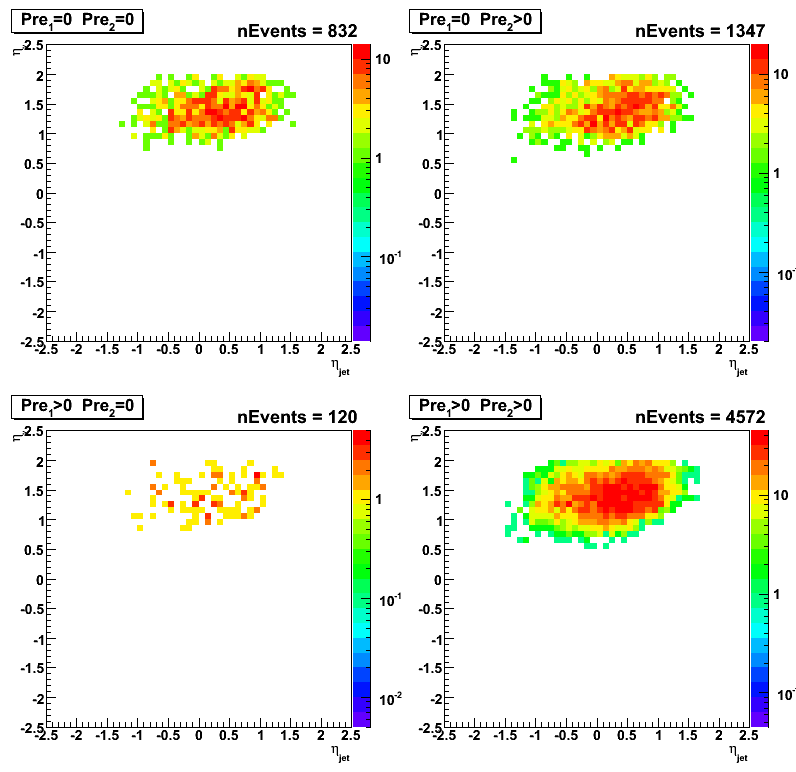
Figure 4:Gamma vs jet pseudo-rapidity.
Results from maximum sided residua study
Definitions for F_peak, D_peak, D_tail^max (D_tail^min) can be found here
Figure 5:F_peak vs maximum residual
for various cuts on energy deposited in the EEMC pre-shower 1 and 2
(within a 3x3 clusters around tower with a maximum energy).
Shower shape used to fit data is fixed to the shape from the previous gamma-jet study of real events
(see black point on Fig.1 [upper left plot] at this page)
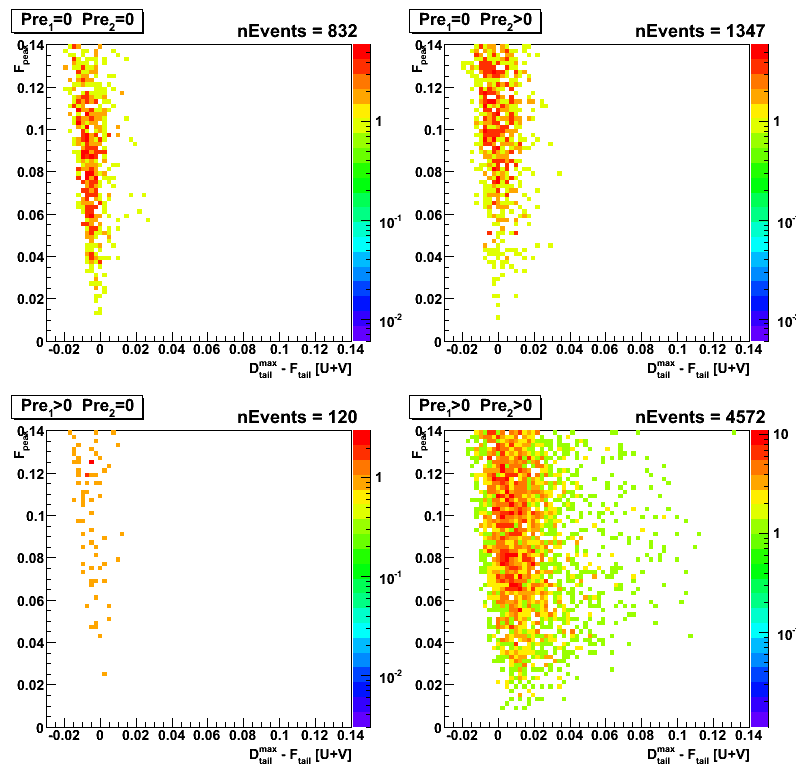
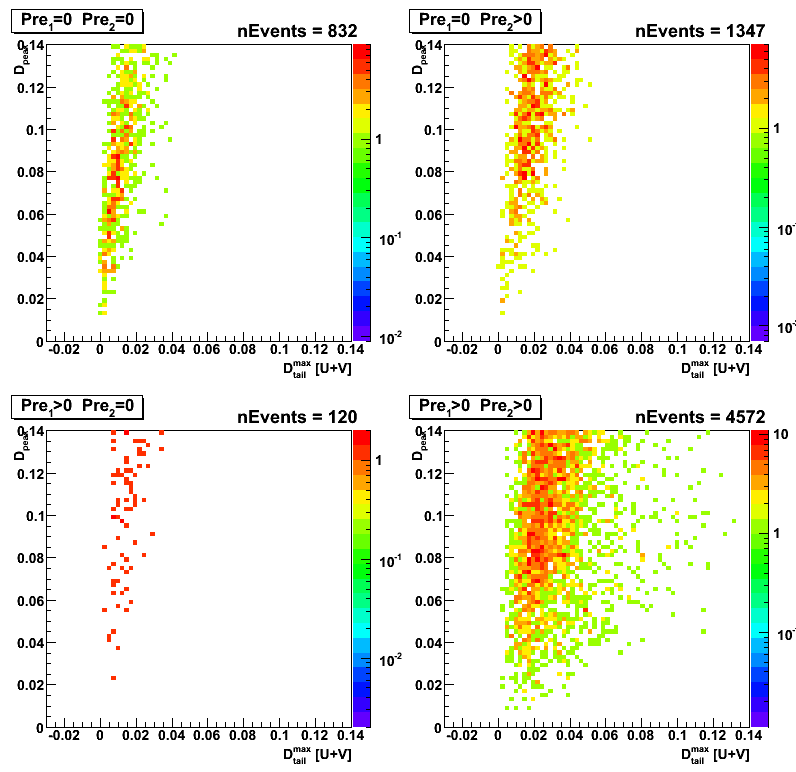
Figure 6: F_peak vs D_tail^max: click here
Figure 7: F_peak vs D_tail^max-D_tail^min: click here
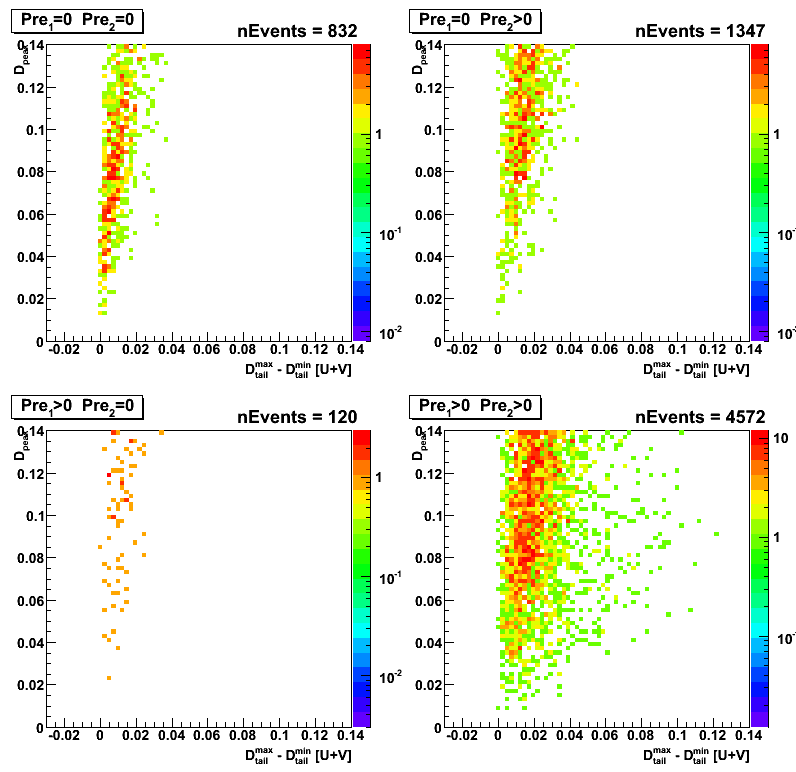
Postshower to SMD[uv] energy ratio
Figure 8:Logarithmic fraction of energy in post shower (3x3 cluster) to the total energy in SMD u- and v-planes
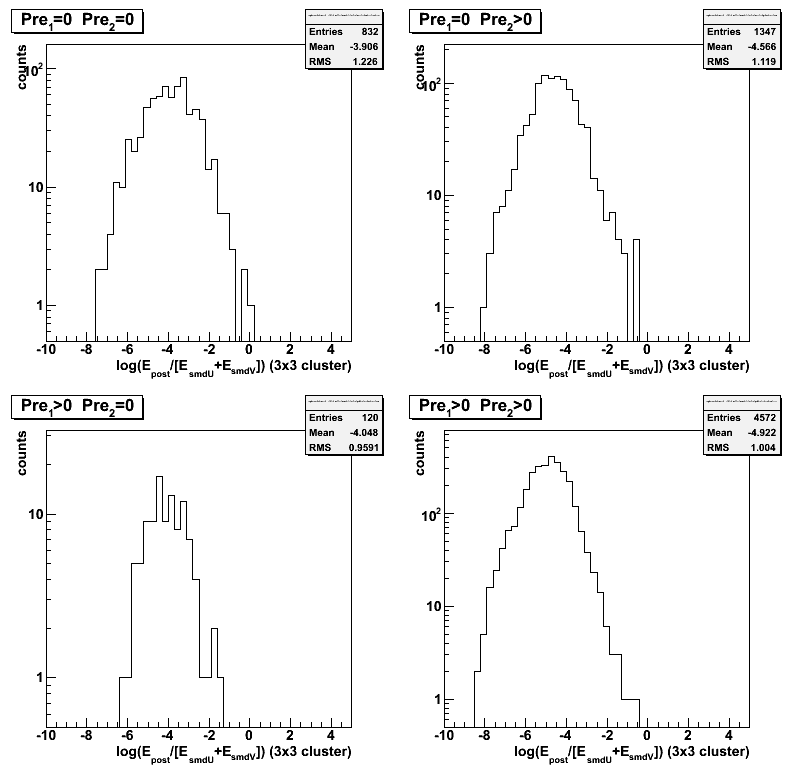
Figure 8a:
Same as figure 8, but for gamma-jet candidates from the real data (no pt cuts).
Logarithmic fraction of energy in post shower (3x3 cluster) to the total energy in SMD u- and v-planes
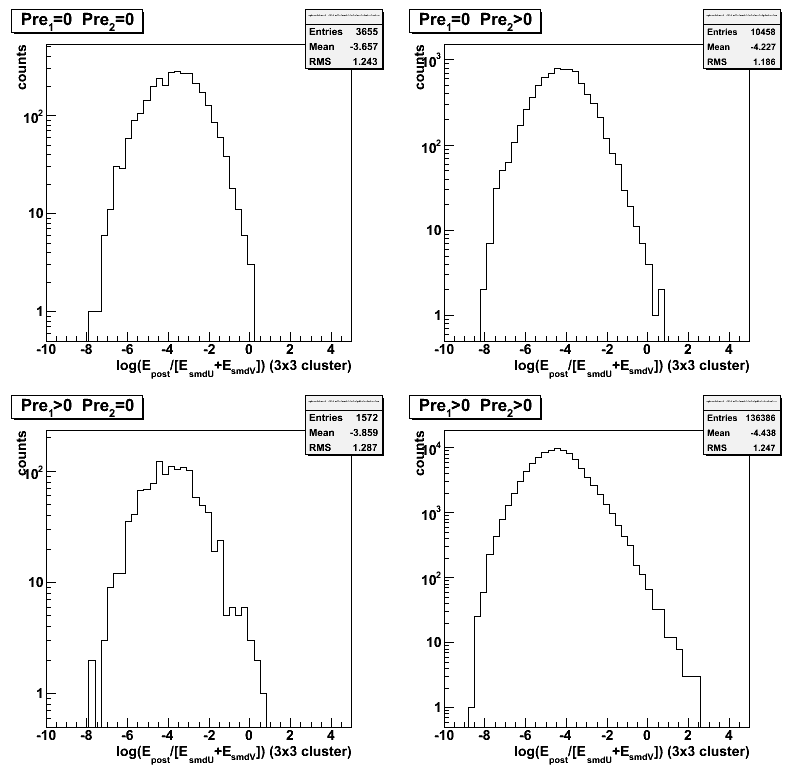
Figure 8b:
Comparison between gamma-jet candidates from data with different preshower conditions.
Points are normalized in peak to the case of pre1 > 0, pre2 > 0
Logarithmic fraction of energy in post shower (3x3 cluster) to the total energy in SMD u- and v-planes
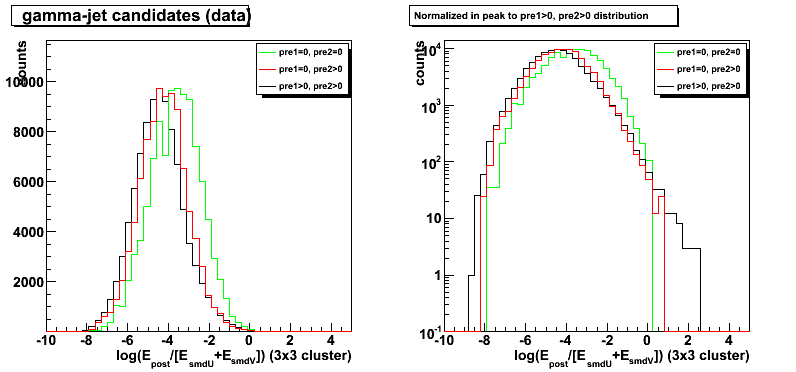
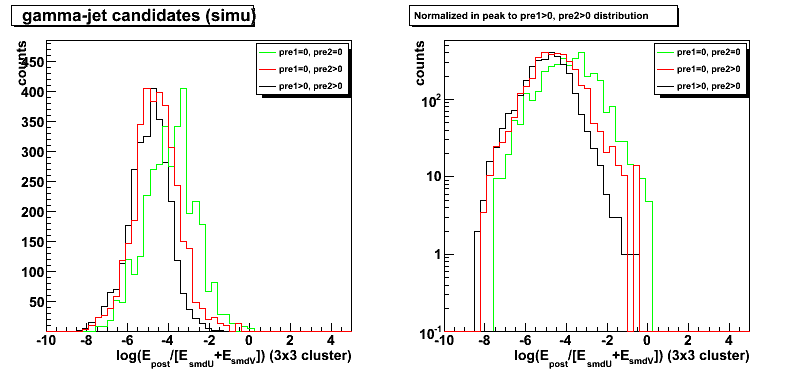
Figure 8c:
Comparison between gamma-jet candidates from Monte-Carlo simulations with different preshower conditions.
Points are normalized in peak to the case of pre1 > 0, pre2 > 0
Logarithmic fraction of energy in post shower (3x3 cluster) to the total energy in SMD u- and v-planes
Additional QA plots
Figure 9: Jet neutral energy fraction
Figure 10: High v-strip vs u-strip
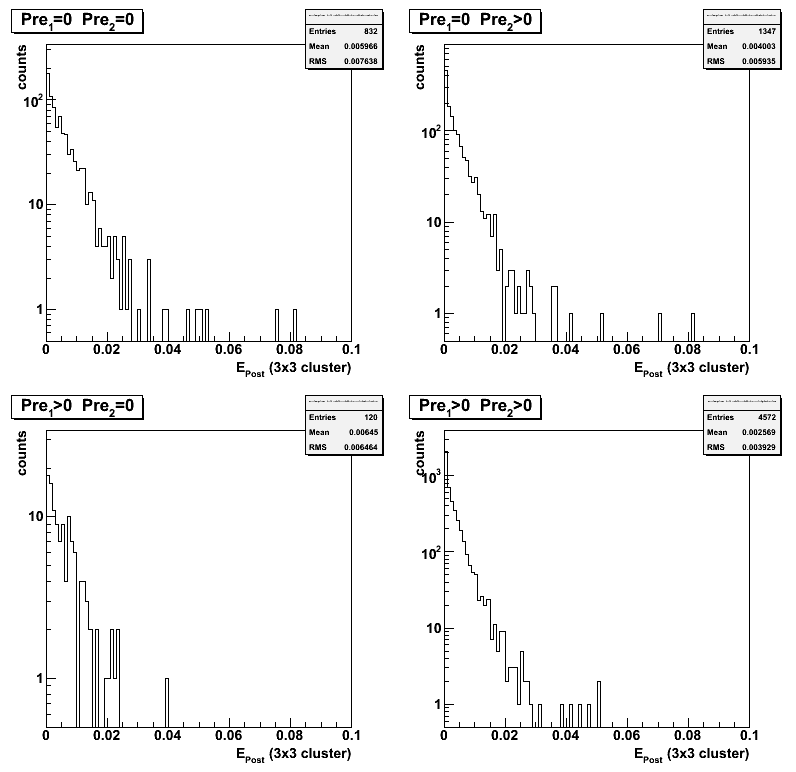
Figure 11: energy post shower (3x3 cluster)
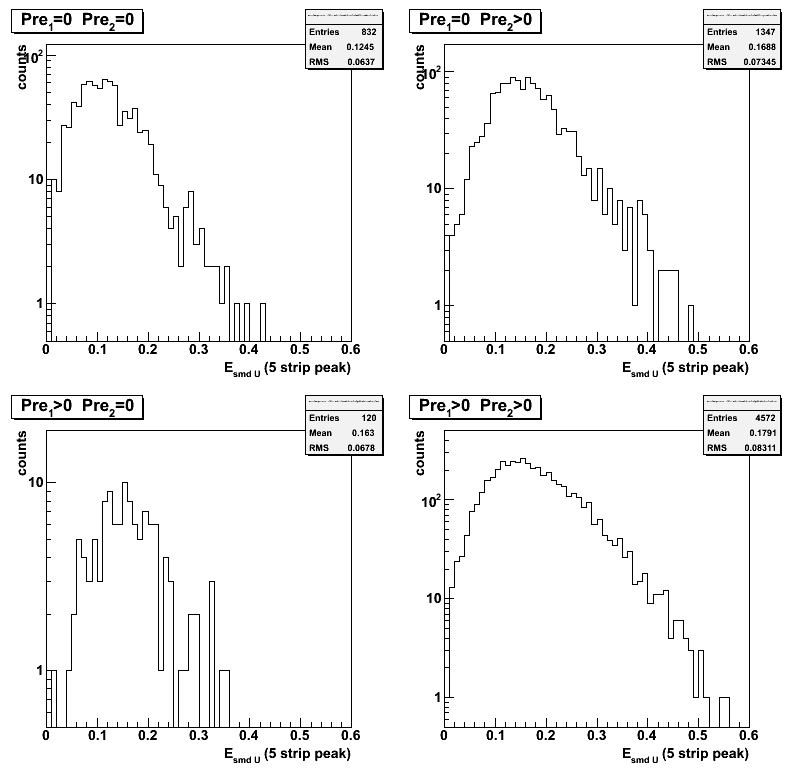
Figure 12: Peak energy SMD-u
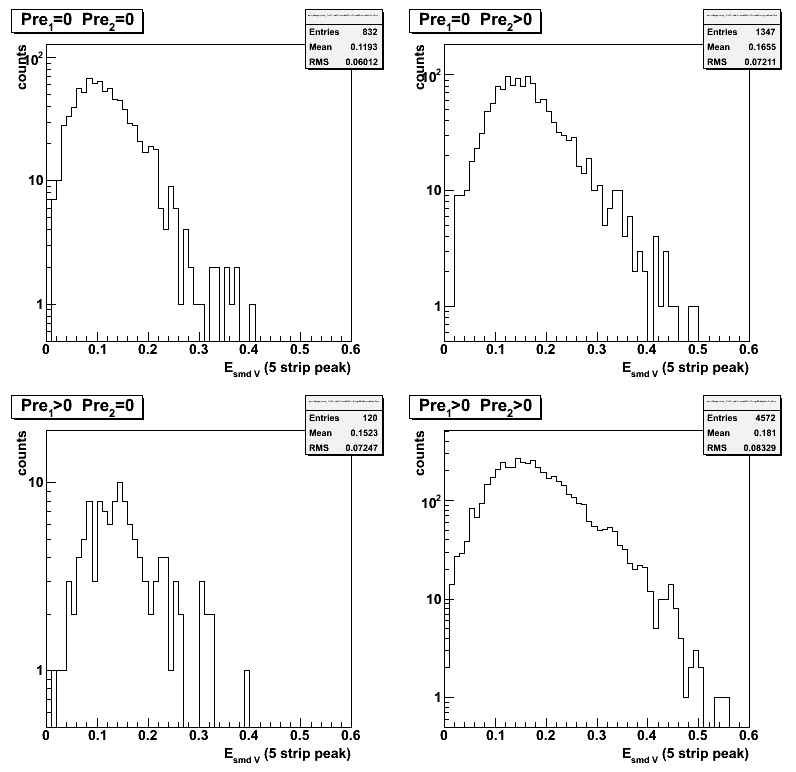
Figure 13: Peak energy SMD-v
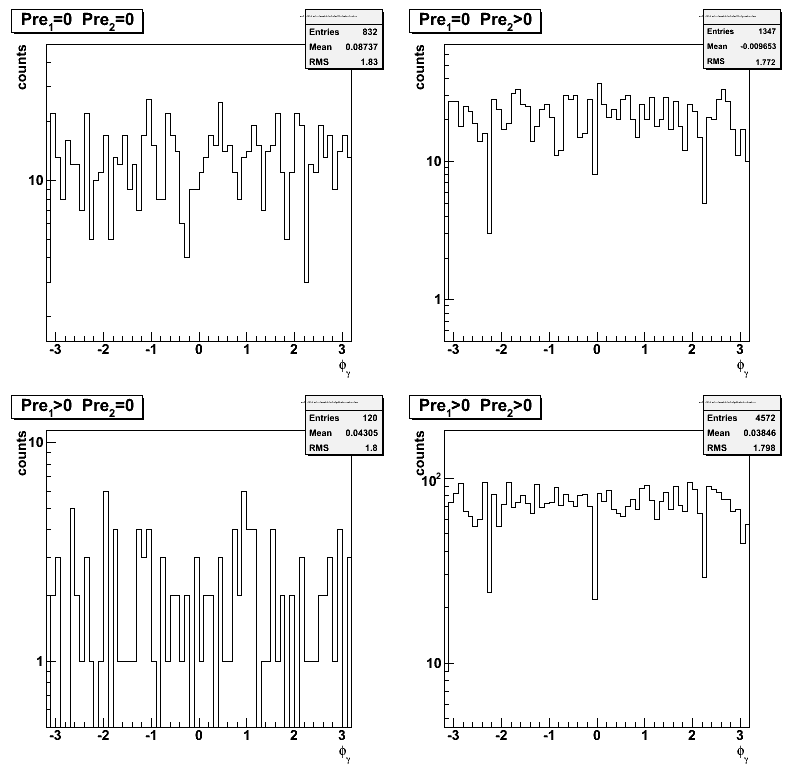
Figure 14: Gamma phi
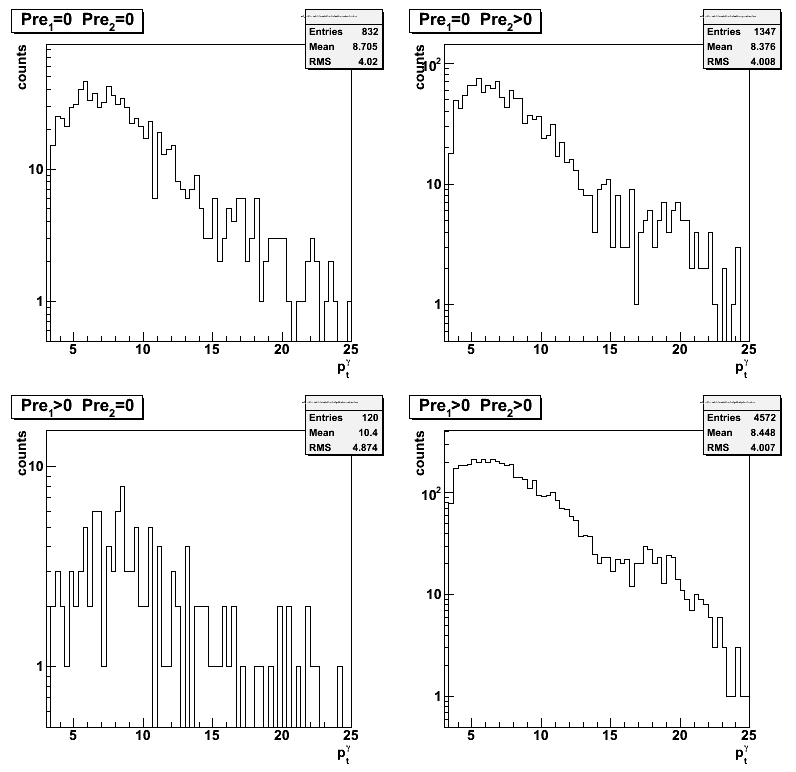
Figure 15: Gamma pt
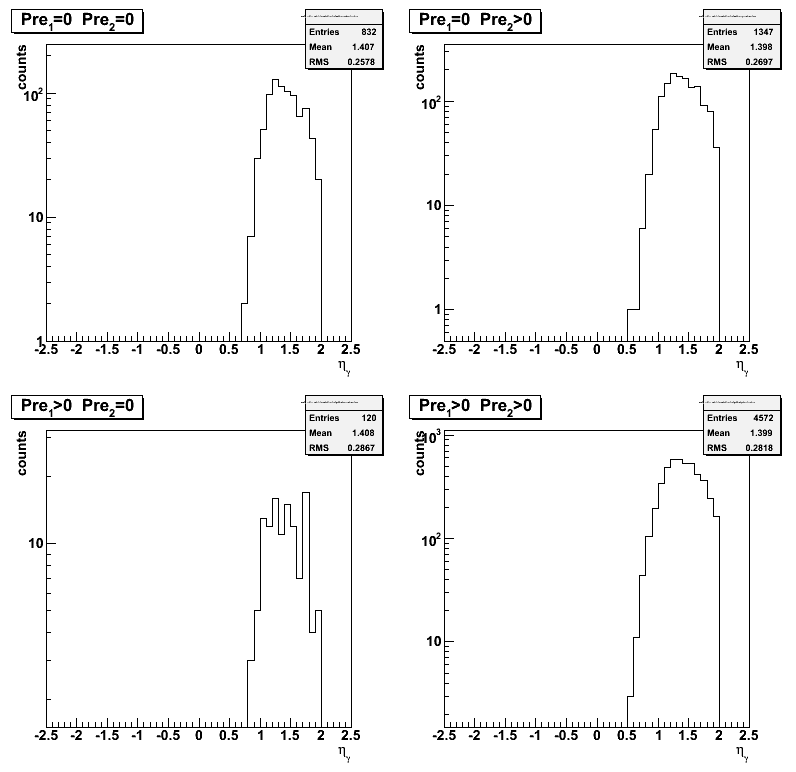
Figure 16: Gamma eta
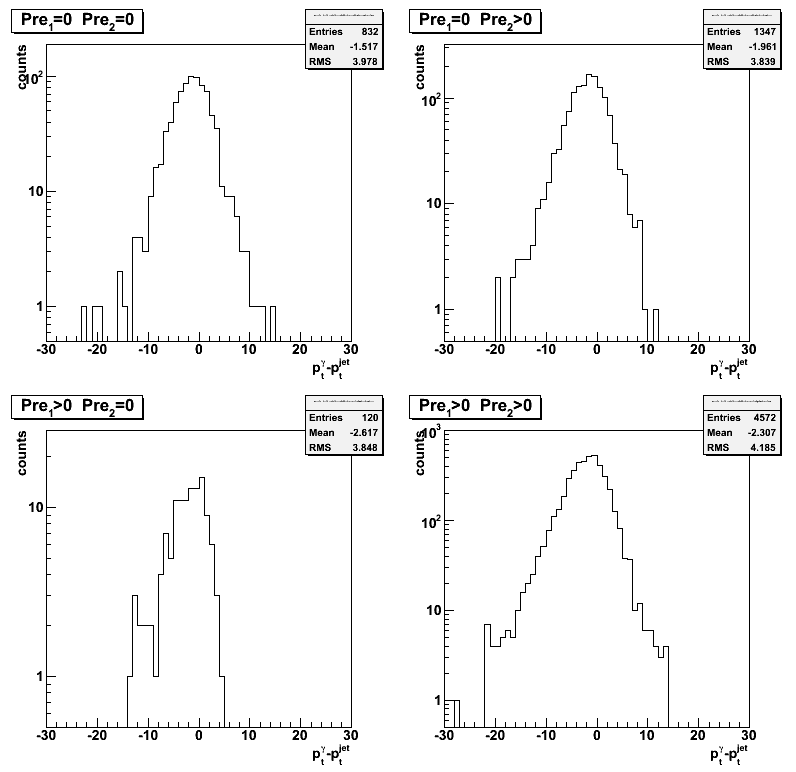
Figure 17: Delta gamma-jet pt
Figure 18: Delta gamma-jet eta
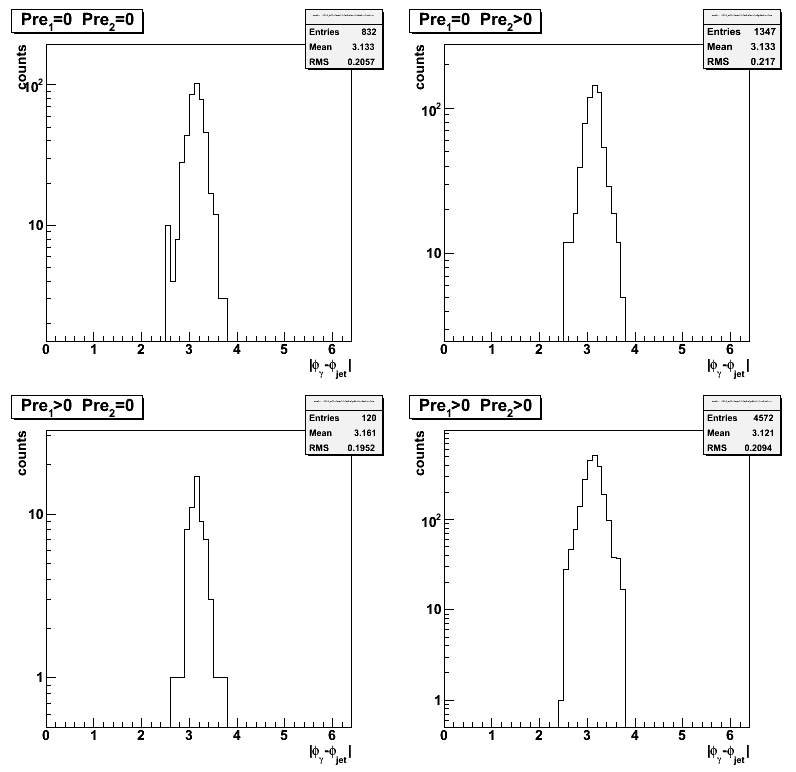
Figure 19: Delta gamma-jet phi
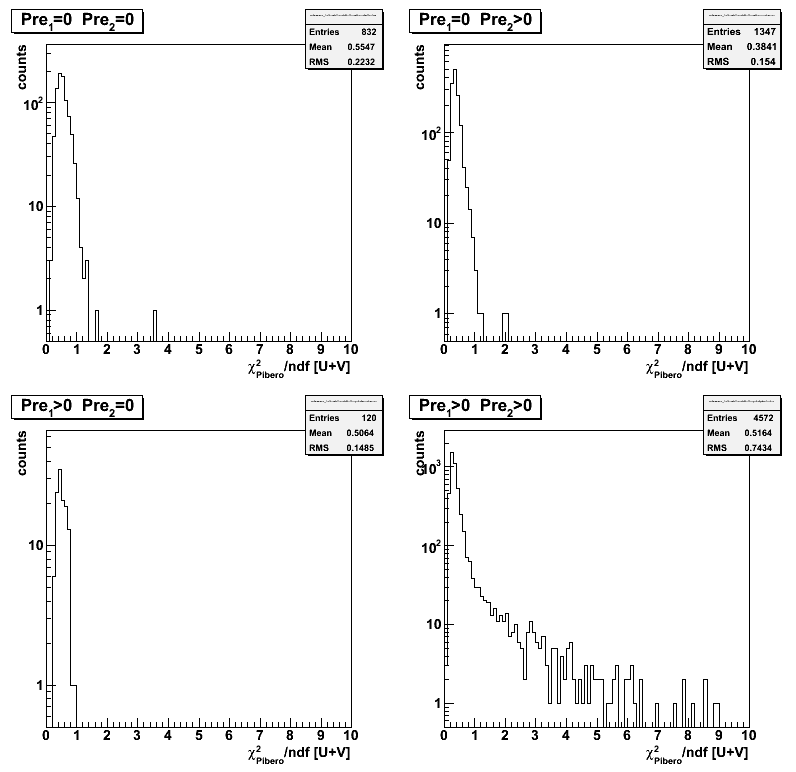
chi2 distributions
Figure 20:chi2 distribution using "standard" MC shape
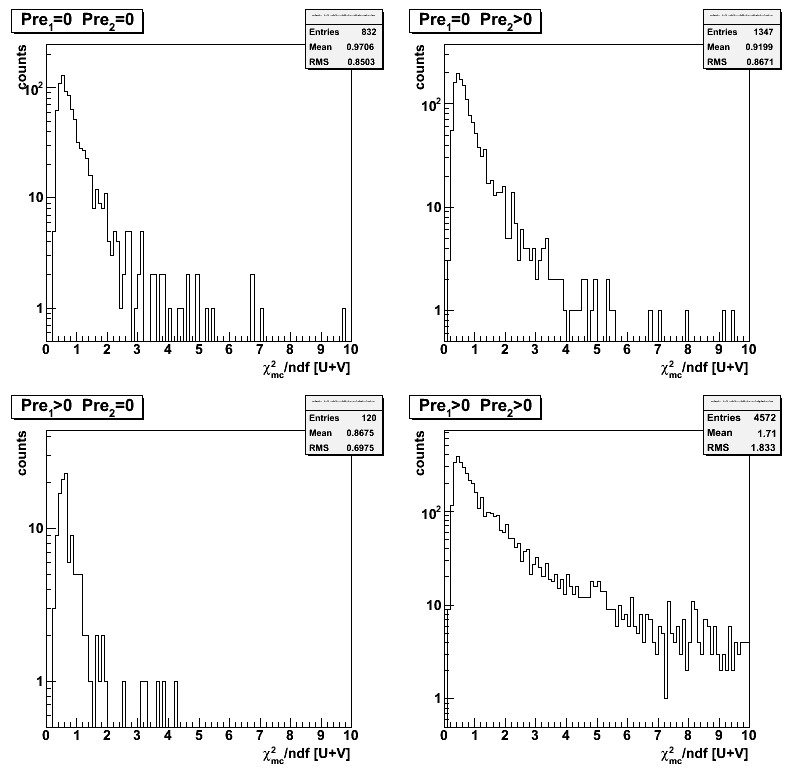
Figure 21:chi2 distribution using Pibero shape
- Printer-friendly version
- Login or register to post comments